
Historically, marketing has been understood as an art of the marketeer in understanding the target segment and preparing marketing campaigns catering to their mindset accordingly.It was difficult to measure impact of individual marketing activity and hence dicey to decide on resource allocation to different marketing campaigns. The emergence of Machine Learning has made it easy to understand the effectiveness of marketing activities and hence making it easier for marketers to allocate resources efficiently and maximise ROI.
What is Marketing Mix Modeling?
Marketing mix modelling is statistical technique to determine decision making via evaluating effectiveness of marketing initiatives and thereby increasing ROI.It can be hence a key factor impacting success or failure of a product. By knowing details of impact of each marketing activity on sales it is easy to allocate resources to activities who will maximize the revenues & cut spending on activities who are not generating enough revenue
- Improve ROI on existing investments
- Understand which campaigns you are overspending / underspending
- Efficienly allocate marketing budgets
As we can see, the dashboard for MMM is done for an organization which is spending on TV,newspaper,sales campaigns,banners etc to drive sales.
A decision maker can easily see spending on campaigns,recommended spend & action required for each of the marketing activities undertaken.This will optimize the costs & maximize revenue impacted by marketing activities.The company can reach maximum ROI using the data from dashboard & gain advantage over competitors
Let’s take a closer look
There are 4Ps in marketing:
- Product-What the firm offers or sells is the product.It can be anything ranging from computer to beverage
- Price-It refers to how much your commodity(product/services) is paid for
- Place-It is where buyers look to avail product/service offerings.It is also important for the company to select the right distribution channel.
- Promotion-Selecting the right method to reach an audience is very critical for success of a product.It can also range from TV advertisement to online campaigns.
"Marketing mix modelling is closely linked to the 4Ps in that it attempts to assess how much success each element has produced and predict what potential success can be achieved by altering and optimising the marketing mix."
Advantages of marketing mix modelling:
- Allocate budget to different marketing campaigns- To achieve marketing goals and get full returns, this method can be used to determine the most effective marketing channel (e.g. TV, internet, print, radio, etc.).
- Facilitates superior forecasting of sales patterns-MMM can be used to predict sales based on scheduled marketing activities and then model different business scenarios, such as a 10 percent increase in spending, the amount of spending needed to achieve a 10 percent increase in sales, etc.
- Better execution of ad campaigns- Markets may recommend optimum levels of spending on highly effective marketing platforms through MMM to prevent saturation.
- Enables advertisers to show the ROI of their endeavours-By analysing gains in sales through marketing campaigns initiated ROI can be established by advertisers to showcase top management the impact of their endeavours.
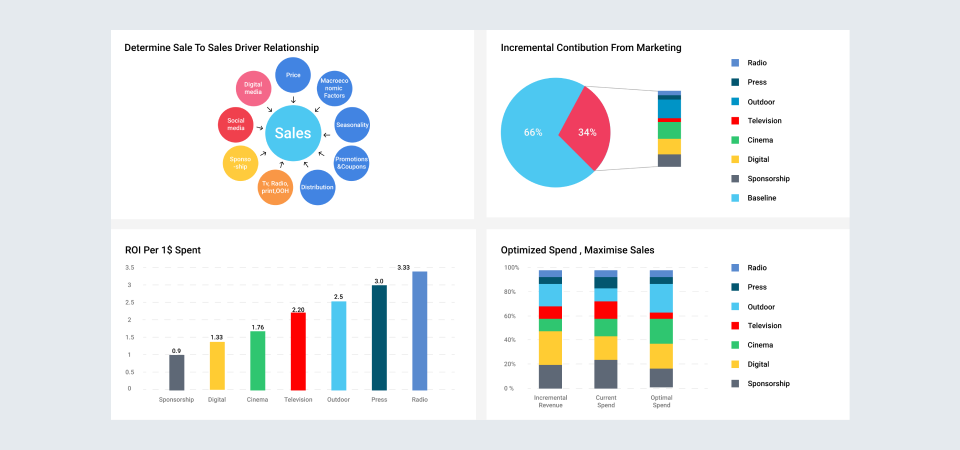
As shown in above picture the information obtained from Marketing Mix Modelling, 4 critical information is derived from it & can help company achieve its objectives:
- Incremental contribution from marketing gives activity wise impact on target objective(sales, market share, brand awareness) & it is very easy to sift out important activities from redundant efforts
- Cost optimization-Current spend on each activity as well as optimized or suggested spend for achieving maximum return can be easily captured through it.
- ROI calculation-ROI for each marketing activity can be easily calculated and company can evaluate its option to spend more or scrap an activity
- Sales to sales drivers relationship-Sales can be impacted by multiple activities & it helps in establishing this relationship making it easier for decision makers to scrutinize & focus on limited activities reducing their time, efforts & resources.
How Marketing Mix Modelling works?
Let's understand with this with an illustration
Consider the table below:
| All figures are in thousand dollars | |||||
|---|---|---|---|---|---|
| Month | Monthly revenue sales | Marketing Expenses on different channels | |||
| TV | Newspaper | Social Media | Other | ||
| January | 2000 | 100 | 50 | 60 | 50 |
| February | 3000 | 150 | 60 | 65 | 60 |
| March | 2200 | 120 | 60 | 70 | 45 |
| April | 2500 | 110 | 75 | 80 | 50 |
| May | 1900 | 130 | 65 | 90 | 65 |
| June | 2700 | 140 | 60 | 80 | 70 |
As we can see the table contains information on monthly sales data for 6 months and monthly expenditure done on different channels in that period. Decision maker needs to identify which channels are most effective & he wants to allocate the marketing budget to different channels in a way to maximise the revenue.
The above table contains information on few channels and for certain months, but there might be more number of channels as well as longer duration in terms of information on number of months. It becomes difficult to identify the sales channels having maximum impact leading to inefficient allocation of resources to marketing channels thereby lowering ROI which could have been achieved. Marketing mix modelling is the answer to this problem. Using marketing mix modelling the decision maker can identify the marketing channels which are most effective and hence take appropriate action to gain maximum revenue. For this particular case, suppose the MMM is done & an appropriate technique (say linear regression) is used for the same the result will come like this:
Sales=C+a1*TV spending+a2*Newspaper spending+a3*Social media spending+a4*others;
Where, C=baseline sales(sales which would happen even without any promotional activity) a1=For every 1 unit spent on TV advertisement a1 amount of sales would be achieved and similar to a1, a2,a3,a4 would fetch the incremental sales on each unit money spent on newspaper,social media & others advertisement.
Since, output is providing the impact of investment on marketing activities to sales revenue, the decision maker will get a clear picture of budget allocation,
For example a hypothetical recommendation post analysis for above situation would look like:
| Spend figures are in thousand dollars | ||||
|---|---|---|---|---|
| Media | Recommendation | Old spend | New Spend | % Change |
| TV | Increase spend | 600 | 800 | 33.33% |
| Newspaper | Decrease spend | 500 | 400 | 20% |
| Social Media | Increase spend | 200 | 400 | 100% |
| Other | No action requires | 200 | 200 | 0 |
Data types required for Marketing Mix Modelling
| Data Type | Examples | Data Source | |||
|---|---|---|---|---|---|
| Time frequency | Monthly,weekly,daily etc. | Historical Data could be available in CRM, ledgers, company’s ERP | |||
| Location | Store level, city level, state level etc. | ||||
| Product | Single SKU,all SKUs of a brand, all brands | ||||
| Time range | <1 years, 1-2 years,>2 years | ||||
| Media Type | Data Required | Data Source |
|---|---|---|
| Internet(website,Youtube, facebook, instagram etc.) | Impressions of posts, outreach, clicks | Google Analytics, internal team |
| Offline sources(newspaper,TV etc.) | TRP,GRP,gross spending on media | Media agencies,Third party vendor,govt. Regulatory authorities |
| Self managed communication channels(mails, phone calls, messages etc.) | Number of people reached | Internal management |
And, data for money spent on different marketing activities can be obtained from internal department of the organization
Getting started with marketing mix modelling
Establish Goals- It is important to establish goals and outline objectives that needs to be obtained from MMM.There should be clarity on questions whose answers’ needs to be achieved through.e.g
- Price- Impact of pricing on revenue and thereby net profit.
- Media- Which channel(TV, social media, billboards etc.) is most effective in reaching out to customers.
- Competitive analysis- Analyse competitors’ marketing activities’ impact on revenues.
Data collection- To do the analysis a diverse & large database may be required involving various stakeholders for instance, it may range from store managers to CEO, sales representative to CMO.Hence, it is necessary to align goals and bring everyone together on board to collect data before doing analysis.
Relevant data- From this big database it is critical to identify the data important for analysis. A person responsible for data cleaning (i.e managing missing values, removing outliers) should be assigned task for this purpose.Analyzing the wrong data set would lead to a very different inference which can be detrimental to the organisation.
Types of sales drivers
Incremental drivers- These are the controllable components that the marketing team implements.These run on short basis.Data requirement vary week to week basis depending upon these factors
- Above the line activity- It includes TV advertising,internet,promotion campaigns etc.
- Below the line activity- It includes store specific campaigns, discounts etc.
- Through the line activity- through-the-Line advertising involves the use of both ATL & BTL marketing strategies. The recent consumer trend in the market requires integration of both ATL & BTL strategies for better results.
- 360° Marketing strategies established with the vision of brand building as well as conversions and digital marketing are examples of TTL activities.
Above the line activity data are collected on a relatively longer time frame compared to below the line activity. Above the line activities are targeted for a longer period of time & on the other hand below the line activities are targeted for immediate sales to achieve short term goal
Base drivers- Any effect obtained independent of marketing mix variables is the baseline.They are affected by different variables such as brand value, seasonality and other non-marketing variables such as GDP, growth rate, consumer sentiment, etc.It is important to evaluate the baseline results to understand the effect marketing practise have on the output of a product and the distribution of a product.e.g
- Price- The price is a very critical factor in deciding the other elements of the plan for the marketing mix.Price defines both the target customer market and the advertisement, promotion and delivery plan.
- Distribution- Essential drivers of the marketing mix are the number of store locations, the stock inside those locations, and the shelf life of that stock.Store locations and the inventory inside them are static and can be identified without any marketing intervention by customers. It is important since it compliments marketing activities
- Seasonality- Seasonality extends to patterns that arise in a normal way.There are major seasonal possibilities, and sometimes they are the most economically important periods of the year. For example, during the holiday season, chocolate sales may soar due to high demand
- Macroeconomic variables- The study of how the overall economy and markets are behaving is macroeconomics.The effects of problems such as inflation, gross domestic product (GDP), unemployment, etc. were considered.When it comes to MMM, macroeconomic conditions may have a huge effect on basic sales,such as reducing consumer buying power by growing unemployment rates and therefore reducing sales.
There are many other variables that impact sales
- Competition- Competitors need to be analyzed & their activities have to be tracked continuously as it may have catastrophic impacts to ignore it. For e.g-a competitor may launch a new product at high discount rates which can wipe out existing product of the organization.By keeping track of their activities a company may be dynamic in in its approach and decide on strategy to tackle challenges
- Substitution- Threat from organizations who offer product or services which can substitute existing product offerings from the company is imminent in most of the cases.e.g-a butter company may have threat from its substitute jam producing organization and hence their activities need to be tracked
- Halo effect- Halo effect is a term for the favouritism of a customer towards a brand's product due to the favourable interactions they have had with other brand items.e.g-Tesla cars have an image of providing excellent experience in electric vehicles and consumer may be biased for it against other electric vehicles.
- Cannibalization effect- A product from the same organization may hamper the sales of other products of the same company due to its usage,pricing etc. For e.g-Wireless headphones may reduce the sales of wired headphones offered by same company.
These factors may affect the sales/revenue of a company apart from the marketing efforts taken by the company. Apart from these, weather effects, epidemics, festivity, seasonality and many more factors also play a vital role. The more variables included the better is the output. These are not necessary but including them will provide a more holistic picture like whether bad sales was due to poor marketing or bad weather also played a role. These can be included in data set for a clearer picture.
Challenges in data
Missing values in dataset- A data set may have missing values system couldn’t capture the data or staff made an error in collecting data
It has further 2 categories
- Missing values across a single variable- This is the case where values of only one attribute are absent in the data set.During analysis, it can be handled either by encoding missing values with numbers or removing missing value data sets or by multiple imputations.
- Missing values across multiple data sets - The best approach to handle it is to do multiple imputation.Ideally 5 iterations should be done during imputation
Outliers- Outliers may be identified using descriptive analysis and the explanation underlying outliers needs to be identified.For instance, there may be a sudden spike in discontinuation of subscription with competitors' underlying trigger discount offers.
How to do marketing mix modelling?
Collect- Collecting data within MMM require econometrics(Econometrics is the quantitative application of evidence-based statistical and mathematical models to establish theories or test current economic hypotheses and predict future patterns from historical data.It subjects statistical experiments to real-world evidence and then compares and contrasts the findings with the hypothesis or hypotheses being tested.) methodologies to predict demand using above sales drivers’ data types
Modelling- Time series regression is a statistical approach focused on the response history (known as autoregressive dynamics) and the transfer of dynamics from appropriate predictors to predict a future response.Regression of time series will help you understand and forecast the behaviour from experimental or observational data of dynamic systems.i.e it is used to predict future response(sales, demand, cost) using historical data.Regression analysis of time series requires generating several different time intervals and related business outcomes during these times.The model is based on the concept created by Adstock, which dates back to 1979 and defines the non-linear relationship between advertisement and customer behaviour.Advertising have diminishing returns i.e the impact of advertising will keep reducing and hence it needs to be analysed in different time frames
Analysis- The output of model selected would vary as per model and variables selected.The output can range from TRPs to MROI(Monthly ROI) i.e part of sales.Three metrics can be used to analyze the fragments of sales
- Effectiveness-Sales/TRP
- Efficiency-Sales/Cost
- MROI-Profit/Cost
Optimization- The core purpose of MMM was to redesign inputs so that desired output is obtained.Hence, a simulation can be created to forecast output with changing inputs. For e.g, suppose a company wants to check the impact of changing spending on an activity keeping no changes in other promotional activities on sales, a simulation might look like this
| Promotional channel | Change in activity | Impact on sales |
|---|---|---|
| Social media | Increase spending by 5% | 3% rise in sales |
| TV | Increase spending by 5% | 10% rise in sales |
| Newspaper | Increase spending by 5% | No change |
Similarly, another model can be created where changes to multiple activities can be done & output can be simulated.For example
| Promotional channel | Change in activity | Impact on sales |
|---|---|---|
| Social media | Increase spending by 6% | Sales Increase by 4% |
| TV | Decrease spending by 5% | |
| Newspaper | Increase spending by 10% | |
| Other | No change |
Analysis Methodology
Multi- Linear regression-Market Mix Modeling uses the principle of Multi-Linear Regression. The dependent variable could be Sales or Market Share. The independent variables usually used are Distribution, price, TV spends, outdoor campaigns spends, newspaper and magazine spends, below the line promotional spends, and Consumer promotions information etc. Nowadays, Digital medium is highly used by some marketers to increase brand awareness.
So, inputs like Digital spends, website visitors etc. can also be used as inputs for MMM. An equation is formed between the dependent variables and predictors. This equation could be linear or non-linear depending on the relationship between the dependent variable and various marketing inputs. There are certain variables like TV advertisement which have a non-linear relationship with sales. This means that increase in TV GRP is not directly proportional to the increase in sales.
Checklist before doing analysis
Multi-regression analysis is a powerful tool to analyze, but before doing analysis data set has to meet certain criteria.In cases data might not be meeting criteria and can be modified to meet the criteria, let’s have a look the exhaustive list:
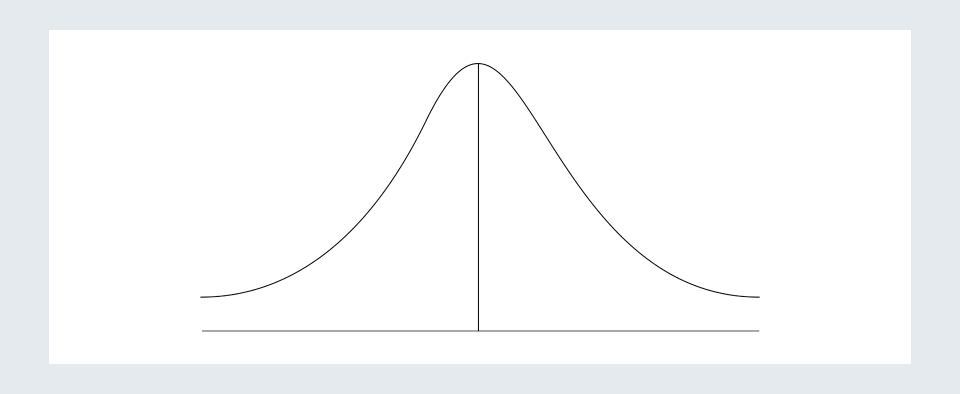
Data should be normally distributed-It is very important to check this & it can be done by creating a normal distribution plot, which is an available option in every data analytics software.
This is how a normal distribution looks like.
However, in real data the plot may not be a normal distribution curve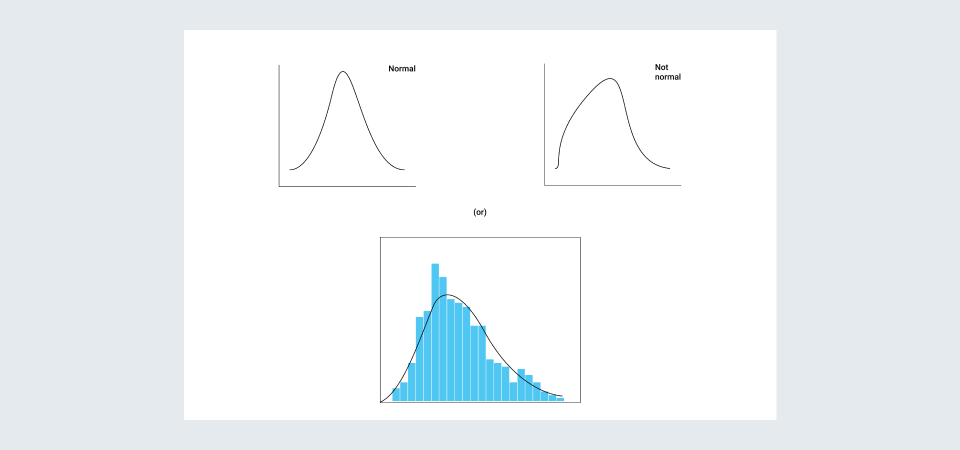
For real life data we can ignore some deviations, as seen in the above diagram more than 80% of area is under the normal distribution curve & hence good to go for regression analysis.
Sometimes OLS(Ordinary Least regression) technique is also used, especially when data is transformed to meet normal distribution assumption.Data transformation is done in cases where we want data to be normally distributed & is done by using mathematical functions. Some of the examples are as follows: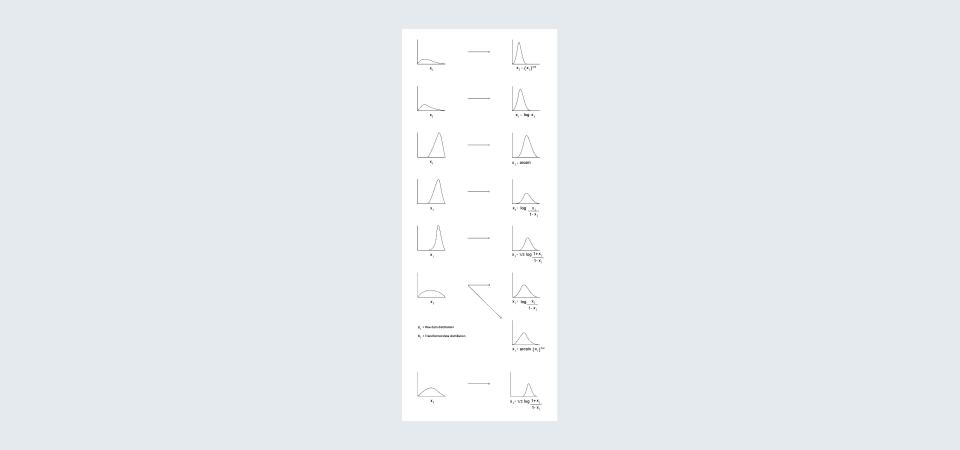
Scatter plot distribution: A scatter plot is required to check the distribution of data.It can be easily drawn by using features embedded in analytical softwares & the range of distribution is needed to be checked before conducting the analysis
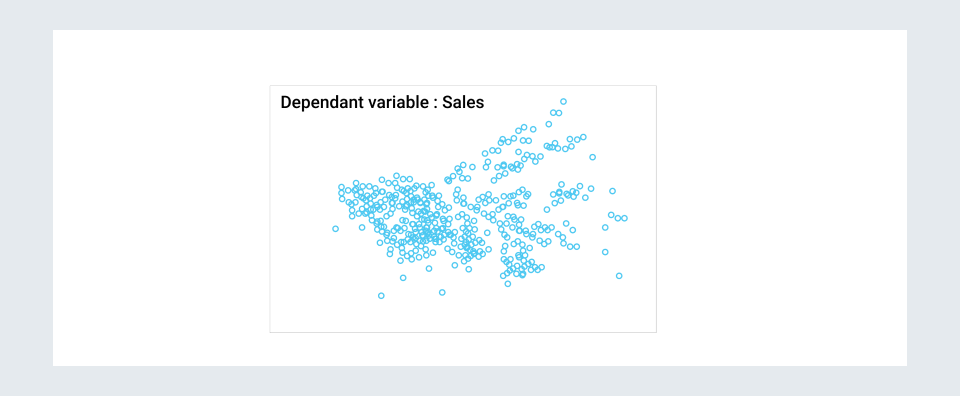
This a scatter plot where dependent variable(factor whose value will be dependent on many independent factors) is sales and independent variables are spending on different marketing channels.The data scattered should be in the range of -3 to +3 on both x axis as well as y axis to meet the criteria for doing regression analysis.
Goodness of fit: This test illustrates whether the survey data reflects the data that you would expect to see in the real population or whether it is biased in any way.In a normal distribution case, goodness-of-fit establishes the difference between the observed values and those that would be expected of the model.
The observed dark patches is the presence of data points and ideally it should be scattered around a linear curve y=x, i.e a diagonal line from bottom left origin towards the top right corner.
Results & interpretation
Let’s understand inference of result & commonly occurring issues & ways to fix them:
For illustration let’s take the situation where a decision maker wants to understand the impact of investing in different promotional channels TV, newspaper, social media & radio on sales revenue.
| Model | R | R square | Adjusted R Square | Std. Error of the Estimate | Change Statistics | ||||
|---|---|---|---|---|---|---|---|---|---|
| R Square change | F change | df1 | df2 | Sig.F Change | |||||
| 1 | .941a | .885 | .885 | 1924.67568 | .885 | 4277.305 | 1 | 555 | .000 |
| 2 | .951b | .904 | .904 | 1758.54375 | .019 | 110.816 | 1 | 554 | .000 |
| 3 | .952c | .907 | .907 | 1733.77627 | .003 | 16.941 | 1 | 553 | .000 |
| 4 | .955e | .911 | .911 | 1696.19313 | .001 | 5.328 | 1 | 551 | .021 |
After checking all the assumptions stated in the previous section, regression analysis was done, & above table is the snapshot of result.Let’s understand how to read the result.
Model- We can see model names 1,2,3 & 4.We have included 4 independent variables(spending on promotional channels TV, newspaper, social media & radio).The different models are created by adding one independent variable at a time, i.e for understanding model 1 includes only the impact of TV advertisement on sales revenue, model 2 includes impact of TV & newspaper promotion on sales revenue, similarly model 3 includes social media alongside TV & radio and so on..
Adjusted R squared- The R-squared which is also called the coefficient of determination, is used to explain the degree upto which input variables (independent variables) explain variation of desired output variables (dependent variables).
The adjusted R- squared is an altered version of R-squared which accounts for independent variables(predictors) which are not significant(important) in a regression model.A lower modified R-squared implies that the additional input variables do not add value to the formula, relative to a model with additional input variables.A higher modified R-squared means that the additional input variables are adding value to the model relative to a model with extra input variables.Adjusted r square value should be ideally around 1, but in real life data it is very rare to get that high value.For a real life data,value above .4 is good enough to go ahead, however focus should be getting value as high as possible
Model |
Unstandardized Coefficients |
Standardized Coefficients |
t |
Sig. |
Collinearity Statistics |
||
|---|---|---|---|---|---|---|---|
| B | Std. Error | Beta | Tolerance | VIF | |||
| 1 (Constant) TV advertisement |
-959.6000 .012 |
179.232 .000 |
.941 |
-5.354 65.401 |
.000 .000 |
1.000 |
1.000 |
| 2 (Constant) TV advertisement Social media |
-1646.201 .012 9.134E-7 |
176.272 .ooo .000 |
.912 .140 |
-9.339 69.333 10.527 |
.000 .000 .000 |
.979 .979 |
1.021 1.021 |
| 3 (Constant) TV advertisement Social media_Investment Newspaper _Investment |
-1668.682 .012 7.841E-7 1.005E-5 |
173.875 .000 .000 000 |
.918 .120 .057 |
-9.597 70.028 8.604 4.116 |
.000 .000 .000 .000 |
.977 .863 .873 |
1.024 1.159 1.146 |
| 3 (Constant) TV advertisement Social media_Investment Newspaper _advertisement_Investment Radio_advertisement_investment |
-2541.335 .012 8.834E-7 1.368E-5 .001 |
254.840 .000 .000 .000 .000 |
.915 .135 .078 .066 |
-9.972 70.968 9.596 5.418 4.613 |
.000 .000 .000 .000 .000 |
.974 .816 .788 .801 |
1.026 1.226 1.268 1.249 |
Let’s have a look at the other report generated during analysis(regression analysis will give multiple reports). Here we can see three terms, significance, tolerance & VIF. Let’s understand their significance:
- Significance - For every independent variable we can see the significance value. Significance value explains the confidence in results, i.e for example sig of .05 for a variable can be interpreted as the confidence level in result for variables is 95%{(1-.05)*100}. Typically sig level is at the discretion of analyst & usually commonly taken values are .05 or .1.Significance level of variable post analysis should be less than the value decided before analysis.
- Tolerance & VIF values- Before understanding their significance let’s understand collinearity first. In statistics, collinearity is the association between predictor variables (or independent variables), such that in a regression model they express a linear relationship. When predictor variables are correlated in the same regression model, the value of the dependent variable can not be predicted independently. In other words, some of the same variation in the dependent variable is explained by multiple independent variables, which in turn decreases its statistical significance. Similar to collinearity, multicollinearity defines a condition in which more than two predictor variables are correlated in order to observe a decrease in statistical significance when all of them are included in the model. Multicollinearity for variables can be checked with tolerance & VIF values. Tolerance value should not be less than .1 & VIF value shouldn’t be greater than 10. In case of collinearity is found, it can be eliminated by using the table below.
- B(coefficient)- As we can see the value of coefficient for each variable is provided. This coefficient can be used to obtain the required equation to simulate the impact in sales.
For example, here for model 4 suggests, sales=.012*TV advertisement investment+8.83exp(-7)*Social media advertisement investment+1.35exp(-5)*Newspaper advertisement investment+0.001*radio advertisement investment-2541.3
Usually the coefficients of independent variables are positive, implying as independent variable increases dependent variable value increases, but sometimes the value is negative implying decrease in the value of dependent variable on increasing independent variable.
As we can see here, the constant term in equation is negative, which is usually not the case. However, it is not a cause of concern since it implies the expected value of independent variable will be less than 0 if all independent variables become 0
Collinearity Diagnostics
| Model Dimension | Eigenvalue | Condition Index | |||||
|---|---|---|---|---|---|---|---|
Constant |
TV advertisement | Social Media_investement | Newspaper_advertisement _investment |
Radio_advertisement _investment |
|||
| 1 1 2 |
1.890 .110 |
1.000 4.155 |
.05 .95 |
.05 .95 |
|||
| 2 1 2 3 |
2.575 .319 .107 |
1.000 2.843 4.910 |
.02 .05 .92 |
.03 .14 .83 |
.05 .91 .04 |
||
| 3 1 2 3 4 |
2.970 .633 .290 .107 |
1.000 2.167 3.199 5.276 |
.02 .03 .03 .92 |
.02 .04 .11 .83 |
.03 .00 .93 .04 |
.04 .80 .16 .00 |
|
| 4 1 2 3 4 5 |
3.633 .811 .327 .173 .056 |
1.000 2.116 3.336 4.582 8.045 |
.01 .00 .00 .01 .98 |
.01 .01 .00 .80 .18 |
.02 .03 .74 .07 .14 |
.02 .50 .38 .04 .07 |
.01 .04 .05 .23 .67 |
As we can see in this table the value of conditional index for each variable is provided. Conditional index value for a variable should be less than or equal to 30. Even if tolerance & VIF values are within range conditional index is needed to be checked to find collinearity & eliminate it. Variables with conditional index values higher than are the reasons for trouble & hence can be removed as significant variable to solve the problem.
Conclusion
Marketing Mix Modelling is a tool that will help the decision makers identify the important mix of activities to reach the objectives like sales, market share.It will help plan the allocation of budget to different market activities & maximize ROI.The scope of MMM also includes multiple factors impacting the company growth objectives like seasonality,weather,natural factors etc.
Simulating in advance the impact of multiple factors on sales will help managers plan & take decisions in advance,utilize resources & time efficiently while maximizing the goal of the organization.