The rise of the online marketplaces has provided customers with a choice that they never had before
Before buying a product, customers check out the price and specialties in multiple channels to decide where to buy. E-commerce companies try to get their products across all touchpoints, reaching out to the largest possible audience. Multi-channel does not limit to online marketplaces; it includes social media platforms with purchase integrations, company websites selling their own products, and even the brick and mortar stores.
Multichannel E-commerce provides businesses with an easier path to widen their customer base, attracting more customers across the globe and bringing more revenues.It helps in creating broader brand awareness.
Overview Dashboard
This dashboard provides a complete overview of the entire transactions of the company – from inventory to sales. It has a channel filter to drill down to a particular channel. It helps the business track the overall progress, helping them draw insights about the below:
- Channel Performance
- Sales trend and breakdown
- Monthly growth comparison
Key Terms:
- GMV or Gross Merchandise Value measures the total value of sales over a period of time. GMV is different from sales as it considers site fees also.
- MTD or Month to date is the period starting from the 1st of the current month till today.
- PMTD or Previous Month to date is the period starting from the 1st of last calendar month till today.
| Goals | Questions to ask | Dashboard views |
|---|---|---|
| Assess channel performance | Which channel has brought in maximum sales? Which channel is performing well in terms of customer satisfaction? | Channel Overview |
| Sales Analysis | How much of the orders and sales get canceled/refunded? | GMV & Sales, Orders |
| Growth analysis | How do the KPIs vary from last month? | Sales Summary |
| Asses inventory situation | How much of the current inventory has been sold? | Inventory Overview |
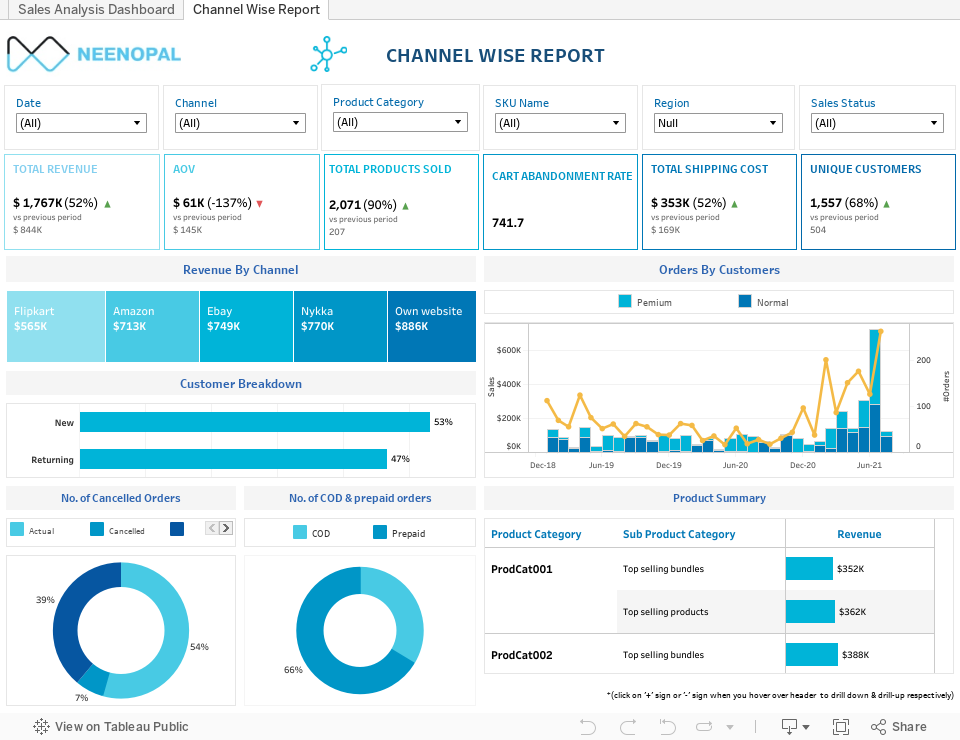
Channel wise Analysis
The dashboard gives the users a choice to select a channel to view the performance details of the particular channel. It looks at the various performance metrics, customer breakdown (new and returning), and the proportion of orders by payment mode.
The product summary table showcases the top-selling product categories, letting the user drill down to top-selling bundles and top-selling products.
| Goals | Questions to ask | Dashboard views |
|---|---|---|
| Track revenue growth trend Track customer growth trend |
What is the contribution of premium customers to revenue? How are the revenue and orders changing with time? | Revenue and Orders by Customers |
| Identify top-selling products and product bundles | Which are the top-selling product bundles? Which are the top-selling products? |
Product Summary |
| Plan marketing strategies | Which payment mode was used in maximum orders? | Order breakdown by payment mode |
| Analyze customer satisfaction with the orders | Which channel resulted in the maximum number of canceled/ refunded orders? | Breakdown of Orders |

- The channel overview compares the channels based on metrics important for assessing the current order-to-delivery process and customer satisfaction.
- GMV determines the health of the e-commerce business as it also includes the fees charged by the channels. If the amount of revenue lost to refunds (and cancellations) is high, it can be an indicator that the business needs to revisit its strategies.
- Sales summary gives a comparison of the important KPIs for the business with month to date and previous month to date values.
- Analyzing which payment modes have attracted a maximum number of customers would help plan the channel–wise promotional strategies. For example, more offers or coupons could be introduced on COD, if COD is the best mode for a channel.
- Product Summary helps in identifying the most profitable categories, the top selling bundles and the top selling products. These vary from channel to channel, i.e., what is a top selling bundle in one channel may not work in another.
Conclusion
This dashboard integrates performance metrics from multiple channels, thus assisting the business in making channel-based business strategies.