Revenue is the lifeline of any business – the money that makes the business run.
A business flourishes when it can increase its profits, which is possible only by keeping track of revenue and focusing on ways to increase it. The majority of the decisions regarding long-term sales and marketing strategies and day-to-day operations are taken based on the sales reports, which provide the most important information regarding sales at a glance.
This dashboard has the below three views, and all the views have the product filter, which allows the users to view the sales and performance data specific to that particular product.
-
Overview dashboard: This report gives an overview of the current performance or a product/multiple products (based on filter) – sales trend, sales comparison with last year and the seasonality or the current trend.
-
Detail View Report: This report gives the detailed product performance – drilling into the top selling products and customers.
-
Profit Analysis: The profit trend and other related aspects are included in this report.
-
Regional Sales Analysis: This report gives geospatial insights into revenue and profits.
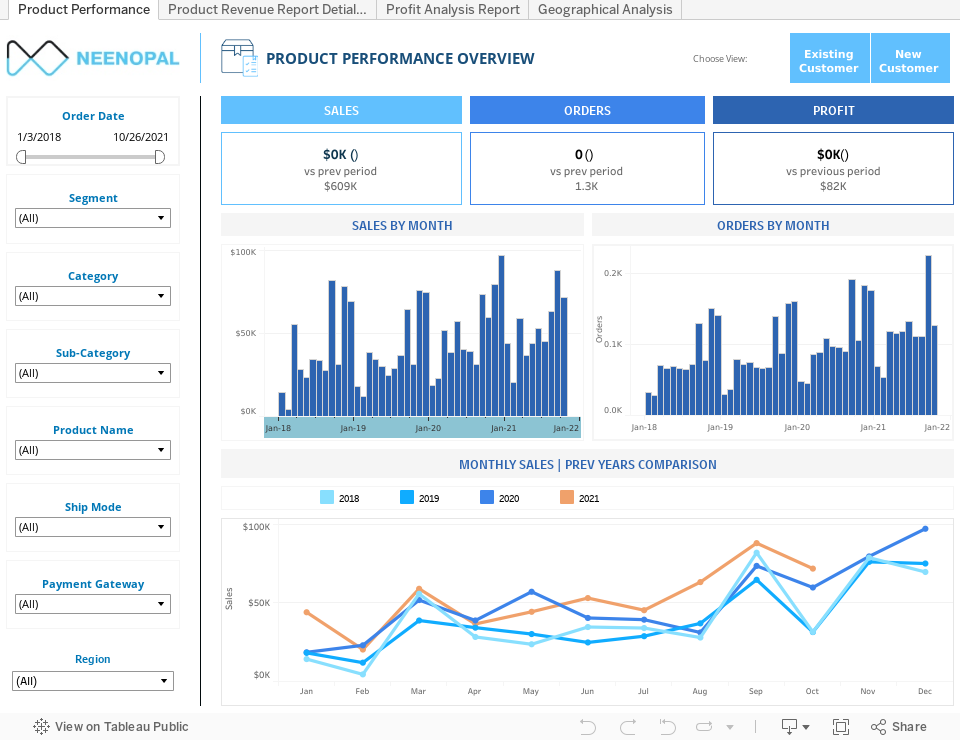
Product Performance: Overview
This report includes the basic KPIs important from a sales perspective – the sales trend, sales growth, total sales and total orders. The report has a New/ Existing customer filter which gives the users three choices – to view the data related to new customers alone, existing customers alone, or both. The objective of the report is to understand where the company stands in terms of revenue and continuous growth. With the product filter, it also helps in monitoring the performance of a single product. It identifies opportunities to achieve the below goals:
-
Track the current sales trend (individual product also)
-
Track the business growth
-
Catch the seasonality or change in trend in business
-
Track Profit growth
|
Goals |
Questions to ask |
Dashboard views |
|---|---|---|
|
Track the current sales trend |
Is the business growing steadily? |
Sales by month |
|
Catch the seasonality in business |
Did the number of orders change over the months? |
Orders by month |
|
Track the business growth |
How has the sales trend changed from last year? |
Sales | This year vs. Last year |
|
Track Profit growth |
What is the rate of change in profit compared to the previous period? |
Profit |

-
The sales, orders, profit cards tell about the current situation of the company. If the profit value is higher than its previous period value, it shows the company is on the growth track.
-
The current sales trend is given by the Sales by month graph. Festive seasons or sales can result in a spike in the graph. But any unexpected dip in the graph can be a reason to worry and would need further probing.
-
The number of orders over time helps in identifying the seasonality or the changing market trend. This gives insights into when to overstock the inventory as there could be a surging demand or keep the inventory level minimum. It also helps identify the time periods that are best for planning a sale or giving out discounts.
-
The comparison of revenue generated this year versus last year gives a clear picture of how the business has grown. If the value is lower than the previous year, one needs to figure out why and take preventive measures. Drilling down to product level, it gives an idea of how to proceed with the product promotion and analyzes the current strategy.
Product Performance: Detailed View
This dashboard explores the product performance from the sales and customer perspective. Identifying the most revenue-generating products and customers is necessary for planning future strategies. The objective behind the dashboard is to help business in the below goals:
-
Understand customer’s purchasing habits
-
Identify most revenue generating products
-
Inventory management (track products)
-
Design marketing plans
Key Terms:
-
Average Order Value or AOV is the amount of money spent by each customer per transaction. If the customers have more items or more expensive items in their cart, AOV increases.
-
Average Basket Size or ABS measures the number of items sold (quantity of items purchased) per transaction. It supplements AOV by providing the reason behind its increase or decrease.
-
Stock Keeping Unit or SKU is a unique identifier representing each product in an inventory. They are used to distinguish one product from another based on the characteristics. SKUs play a vital role in determining the reorder points, thus helping to optimally stock the inventory.
|
Goals |
Questions to ask |
Dashboard views |
|---|---|---|
|
Understand customer’s purchasing habits |
What is the average amount spent per order by a customer? How is it changing with sales? |
Average Order Value Quantity by sales |
|
Track products |
What is the number of distinct SKUs sold? |
Distinct SKU Sold |
|
Inventory and marketing planning |
Which are the top-selling products and product categories? |
Top selling products by Sales and Volume |

-
A dip in the conversion of high-paying customers can badly affect the overall revenue, making it difficult to track the reasons. This makes AOV or the Average Order Value a better indicator of customer behavior. AOV also helps in product pricing and advertising spend decisions. Often the minimum order needed for free shipping is also set based on AOV value.
-
The total number of SKUs tells how many products the business has, and the distinct SKUs sold gives how many of them are sold. Identifying this is important, as it can help plan the tricks for selling off the left-out products.
-
Identifying the top selling products and product categories by sales are important from a marketing as well as operations perspective. The inventory needs to be stocked with these to avoid a shortage situation, leading to customer dissatisfaction and even losses. The business could identify the traits of the most revenue generating products and understand what went wrong for others.
-
Understanding what sells best in a region helps the business in targeting the right customers. Focussing on the emerging markets rather than the low-performing areas can boost sales and increase the customer base.
Profit Analysis Report
Often businesses are judged over their ability to earn profits. Their expansion plans, easiness of securing loans or investors all depend on their profitability. It also impacts the stock value of the company. This dashboard monitors the profit and the two components of it - sales and cost. It tries to identify the high-cost points so that with further investigation, the factors causing this can be identified and then controlled.With the insights from this dashboard, the business could achieve the below goals:
-
Assess the current financial situation
-
Identify the high-cost, low-revenue points
-
Track the profit trend
-
Identify profitable products
|
Goals |
Questions to ask |
Dashboard views |
|---|---|---|
|
Assess the current financial situation |
Has the business achieved its target profit |
Actual vs. Target Profit |
|
Identify the high-cost, low-revenue points |
How are the sales, cost and profit varying over time? |
Sales, Cost and Profit |
|
Track the profit trend |
How is the monthly profit trend? |
Monthly profit trend |
|
Identify profitable products |
Which are the top-profit generating products? |
Top products by profit |

-
Every business strives to reach its target profit value. By finding the difference between actual profit and the target value, businesses get to analyze the effectiveness of their budget plans and implementation. They could identify what went wrong and what went right and plan better for the next term.
-
To increase profit, one could either increase the revenue or decrease the cost or do both. Analyzing the sales, cost and profit over time helps in identifying the points where cost was higher than the average and revenue was lower. There may be multiple causes which needs to be identified and eliminated.
-
The monthly profit trend shows how the profit changes over time. With this, business can predict future profit and correct the course if profit is taking a steep plunge.
-
One of the major problems E-commerce businesses face is the inability to identify and leverage a profitable product niche. Identifying the top profit-generating products could help in this. Analysing these products on the number of orders, cost, profit per product, region of sales, etc.. would give a clear picture on why they perform better than others in the same category.
Regional Sales Analysis Report

-
Geospatial trends of revenue and profits help understand KPI performance in selected time horizons from the dashboard.
-
Understanding what sells best in a region helps the business in targeting the right customers. Focussing on the emerging markets rather than the low-performing areas can boost sales and increase the customer base.
-
On hovering over each of the states, one can get to know how much revenue, profits and % of total revenue is the state contributing to. Top regions contributing to maximum sales can be seen in detail through the adjacent chart.
-
Although a simple visual, it can give a snapshot overview of geographical sales KPI’s to executives so that appropriate business decisions can be made to improve sales performance.
Conclusion
Revenue and profits are two most important KPIs for any business. These are the key factors involved in all the business decisions. The dashboard gives a detailed view of these measures from product and customer perspective, making it easy for the business to take decisions.