RFM or Recency, frequency, monetary value is a tool of marketing analysis to identify an organization's best customer segment by using certain parameters
A company takes huge efforts in acquiring customers yet the hard part is to retain customers & enhance their satisfaction level.If marketeers would be able to know the customer segment which is more likely to purchase & their spending power, they can align their strategy to focus on best experience for this customer segment.
Let’s take a look at an example. For an e-commerce company, there might be a wide range of customers in terms of age, gender, geography etc. But the company must be having historical purchase data which will include their frequency of purchase, spend per purchase, time spent on app or website & so on. If company was able to leverage these data points to divide customer into various segments on the basis of their likelihood of purchase then it would be easier to utilize resources for offerings to identified customers.It will not only enhance customer experience but also increase the ROI for company by augmenting the impact of each money spent for customer experience.
Fortunately, we have a method which answers the above situation. RFM segmentation is a good way to classify consumer classes for special care.Analysis of RFM (recency, frequency, monetary) is a marketing tool used to quantitatively evaluate which consumers are the best by analysing how recently a consumer has bought (recency), how much they buy (frequency), and how much the customer spends (monetary).RFM research is based on the axiom of marketing that "80 percent of your business comes from 20 percent of your customers."
Direct mailing marketers have used an informal RFM analysis for non-profit organisations for more than 30 years to tailor their mailings to clients who are most likely to make donations.The logic behind RFM was simple: it was more likely for people who donated once to donate again.But with advent of sophisticated techniques, data collection & storage systems it has become easier to analyze the data & do RFM analysis to do segmentation.
This is just a prototype, and as per requirement, much detailing can be done on such visualization.
What is RFM analysis?
| Recency | Frequency | Monetary |
|---|---|---|
| How recently user visited website/app & made a purchase | How frequently the customer interacts & frequency of purchase made per visit | Money spent per purchase might include customer lifetime value |
- Once we get the data of recency (in days), frequency (in number) and monetary (in rupees) we then segregate the customers into separate buckets.
- If our data is clean and uniform we can simply use the percentile method to put them in equal sized buckets (i.e segregate them in various ranges on the basis of their purchase, visit & spend behaviour).
- We use a standard of 3 buckets where customers at large show distinct features. But if the data permits we can make more divisions. Or based on the data trend we can define rules manually to put them in different buckets.
For instance my data has supposedly 60,000 customers with recency varying from 1 day earlier to 3 months earlier. I can segregate them equally with 20,000 customers in each bucket or use data analytics to segregate them in buckets of visited-within-1week, visited-within-1month and visited-after-1month buckets.
Once the different buckets are formed, we then give each bucket a score of 3, 2 or 1 signifying high, medium and low values respectively.
For illustration, suppose there are 8 customers, then a recency score or R score is provided on the basis of their recency. Top 20 percentile is given a score of 1, the next 20 percentile is given a score of 2 & so on upto 5. Top 20 percentile would be the customers whose recency has been high i.e days value is low as shown in table below
| Customer | Recency (Days) | R Score |
|---|---|---|
| A | 2 | 5 |
| B | 41 | 1 |
| C | 3 | 5 |
| D | 45 | 1 |
| E | 23 | 3 |
| F | 24 | 4 |
| G | 11 | 4 |
| H | 29 | 2 |
Similarly scores would be provided for frequency of purchase. Top 20 percentile is given a score of 1, the next 20 percentile is given a score of 2 & so on upto 5. Top 20 percentile would be the customers whose frequency has been high i.e number is high ( because higher number represents higher frequency )
| Customer | Frequency(Number) | F Score |
|---|---|---|
| A | 47 | 5 |
| B | 19 | 2 |
| C | 23 | 3 |
| D | 5 | 1 |
| E | 24 | 3 |
| F | 33 | 4 |
| G | 11 | 2 |
| H | 7 | 1 |
And finally scores would be provided for monetary value of purchase. Top 20 percentile is given a score of 1, the next 20 percentile is given a score of 2 & so on upto 5. Top 20 percentile would be the customers whose spending has been in the maximum 20 percentile range. The higher the money spend the higher percentile range customers would fall into & vis a vis the score would be higher
| Customer | Monetary Value( in $) | M Score |
|---|---|---|
| A | 350 | 3 |
| B | 150 | 2 |
| C | 230 | 2 |
| D | 99 | 1 |
| E | 438 | 5 |
| F | 375 | 4 |
| G | 298 | 3 |
| H | 489 | 5 |
In the last stage an aggregate RFM score would be assigned to each customer on the basis of aggregate R, F & M score by assigning equal weightage to each of them.
| Customer | RFM Score |
|---|---|
| A | 4.33 |
| B | 1.67 |
| C | 3.33 |
| D | 1.00 |
| E | 3.67 |
| F | 4.00 |
| G | 3.00 |
| H | 2.67 |
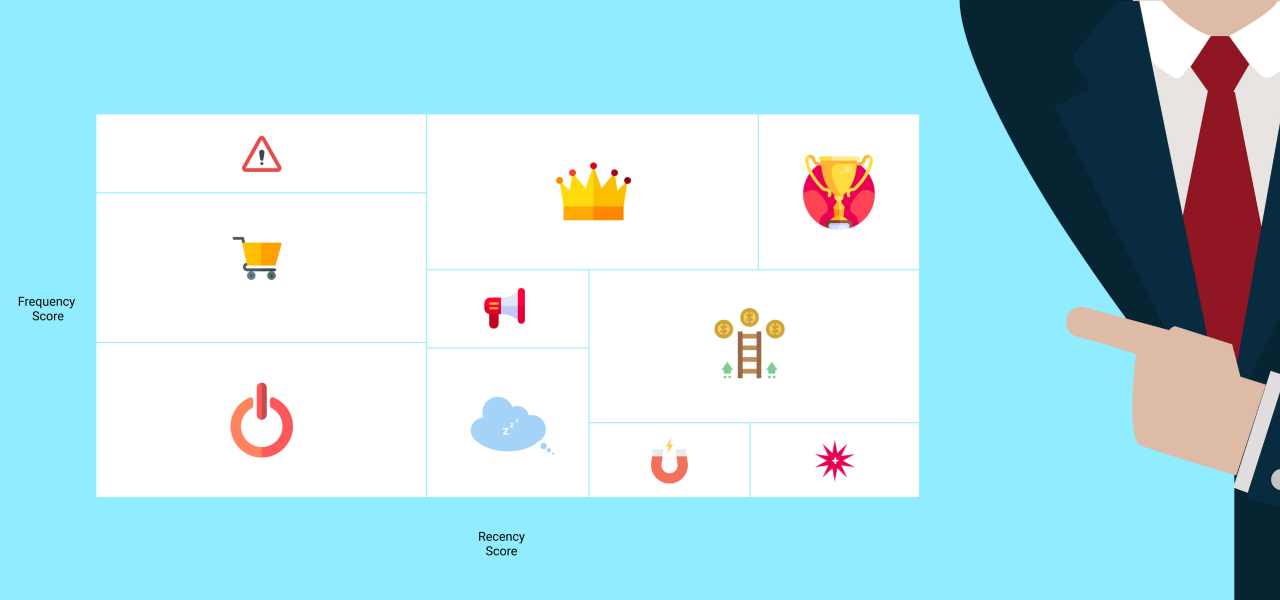
And using this obtained RFM score, customers can be ranked as well as labelled into categories & decision makers would be able to plan their strategy accordingly.
| Label | Characteristics |
|---|---|
| Champions | Ones who have bought recently, do frequent purchase & spend heavily. They also do word of mouth marketing for brands & hence needed to be treated with utmost care. |
| Potential Loyalists | These are high spending customers who need more attention from the company to become loyal to the brand. |
| Recent users | Recent users have started purchasing recently & hence marketing strategy needs to be planned carefully to prevent their drop out. |
| Can’t loose them | This category is a high spending category but prone to risk from competitors & hence need continuous attention. |
| Needs attention | These customers are the ones who are thinking of stopping the usage of the brand which might be due to internal or external factors. Hence, they need very personalized attention & messages to prevent attrition. |
| Loyal customers | This category needs to be offered what they are being offered currently & risk of losing them is minimal. |
| Price sensitive | Price sensitive customers need offers of discount & low prices. They are least loyal & hence discount & sale campaigns should be targeted towards them. |
| About to sleep | These are on the verge of being lost & hence needs high & immediate attention. |
| Hibernating | These are current customers who have not made any purchase in the recent past & need to be induced for shopping else they might be lost forever. |
| Lost customers | This category is very difficult to bring back & minimal efforts should be channeled towards them. Instead companies can understand from their experiences about areas to improve on. |
Advantages of RFM:
- Very effective in directing marketing campaigns: Since, it helps rank customers on three parameters it will help a company knows the customers who are most likely to respond to marketing campaigns thereby maximizing effect of money spent on marketing campaigns
- Affordability: It is a very effective tool which is very economical at the same time.
The moment we get the scores for each customer we can label them into different groups and do one or multiple among following:
- Design targeted marketing campaigns customised for customer category
- Research & generate insights on why a particular group is behaving the way it is
- Over time we can also figure out if customers are moving from one group to another and the positive (or negative) reinforcement behind that. The business can see this data in real time through any visualisation tool and take decisions immediately.
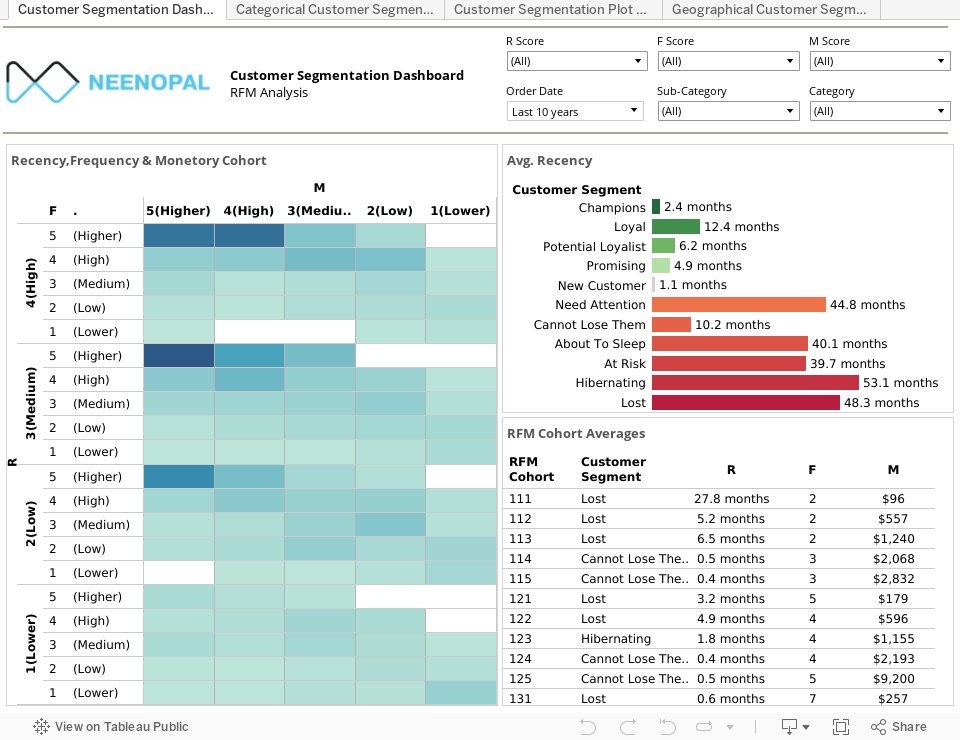
Customer segmentation dashboard:

- Categorisation of customers into high, medium & low categories on the basis of their recency & definition of each category. Using the dashboard manager will be getting real time information about customer purchasing behaviour & segregation will be very easy
- Real time customer cohorts on the basis of recency, frequency & monetary value into categories like champion, loyal, promising etc. It is very useful because a company has different approaches for each customer cohort & by segmenting the company will be knowing the size of cohorts, their feasibility of money & time investment.
- It also gives quantitative specification to each factor. For example, recency might be defined as purchase done within the last 10 months for an organization & it will help not only identify appropriate quantitative figures using historical data analysis but also segregate customers on the basis of deviation from standard quantitative figure obtained.
Categorical customer segmentation dashboard:

- On the left side scatter plot a manager can easily identify & segment customers as champions, loyal, promising, new customers etc. on the basis of their spend & recency. By identifying he can create targeted customised marketing campaigns for customers who have both high purchase & recency to enhance their satisfaction level.
- On the other hand for segments having low frequency or spend, he will have to utilise customer acquisition strategies to increase their spend & recency .Hence, just this simple data visualisation tool will help them plan marketing campaign type, budget & maximize ROI simultaneously meeting other objectives of the organization.
- Similarly on the right side we can see the dashboard with customer purchases in different categories & compare all at once in a very simple user friendly manner.
Plot of customer segmentation:

- In the above dashboard we get a multitude of information. It can be used to easily identify customers who are away from the normal trend of recency, frequency & money. Hence, managers can easily identify the outliers in the customer segment & target them accordingly & simultaneously we can see real time information of each customer individually.
- The left portion shows vertical box plots which uses historical data to identify the mean values for recency, frequency & monetary value. A range is created with upper and lower limits from mean & plots can be used to visualize the customers in different regions of box & beyond box as well. It will give insights on current scenario & extent of customers scattering in different regions
- The right portion gives individual customer patterns in a particular cohort. It will help organizations not only with customized offerings but will also help to understand the pattern of customer attrition.
Geographical Segmentation:

- Perhaps it is one of the most important analytical information which any decision maker can get from overall analysis. The geographical spread of different categories of customer can be easily seen & hence strategies as well as budget planning for marketing activities can be chalked out to meet the objectives.
- The different categories of customers ranging from champions, potential loyalists to lost customers can be visualized for different geographies.
- This will help organizations identify geographies in terms of strategic planning & at the impact of marketing activities in different geographies. The performance of the sales & marketing team in a geography could be also evaluated on the basis of the concentration of customer categories in a region.
Applications:
- Media Strategy: If the RFM analysis is finished, you will have a better understanding of what your users want from your brand and when they are most likely to engage with you based on their actions. To target different segments based on their characteristics, a differentiated media strategy incorporating multiple formats and mediums for varying durations can be developed.
- Messaging Strategy: RFM analysis enables you to develop tailored and personalized communications, which can be used to streamline the different messages you send to a specific customer and continue sending only that form of message, lowering the risk of disappointment or frustration and increasing customer loyalty.
- New Launch Strategy: RFM enables you to identify your most valuable and least valuable customers, and during the launch of a new product, the Champion customer can be engaged in a way that generates high WOM, which positively influences product perception among other customers, resulting in increased recognition and subsequent purchases.
Challenges:
- In this illustration equal weightage has been given to R, F & M but that might not be the case for everywhere. For example in high customer involvement products like cars, money spent by customers is high but frequency of purchase is low & recency of purchase may vary widely. Hence, weightage of monetary value should be high compared to recency & frequency. Similarly weightage varies across the industries on the basis of multitude of factors.
- The ranking might not be a very good reflection of the customer to be targeted. It might happen that a customer is bringing high revenue but he might be only a casual buyer. However, it is probable they will be the ones who will respond most to the marketing campaigns.
Conclusion
RFM will enable the organisations to understand the customers on the basis of their recency of purchase, money spent per basket & frequency of purchase. This will help decision makers to categorize customers into different categories & thereby make investments into marketing accordingly. It will not only save costs but also maximize revenue at the same time enhancing customer satisfaction level.