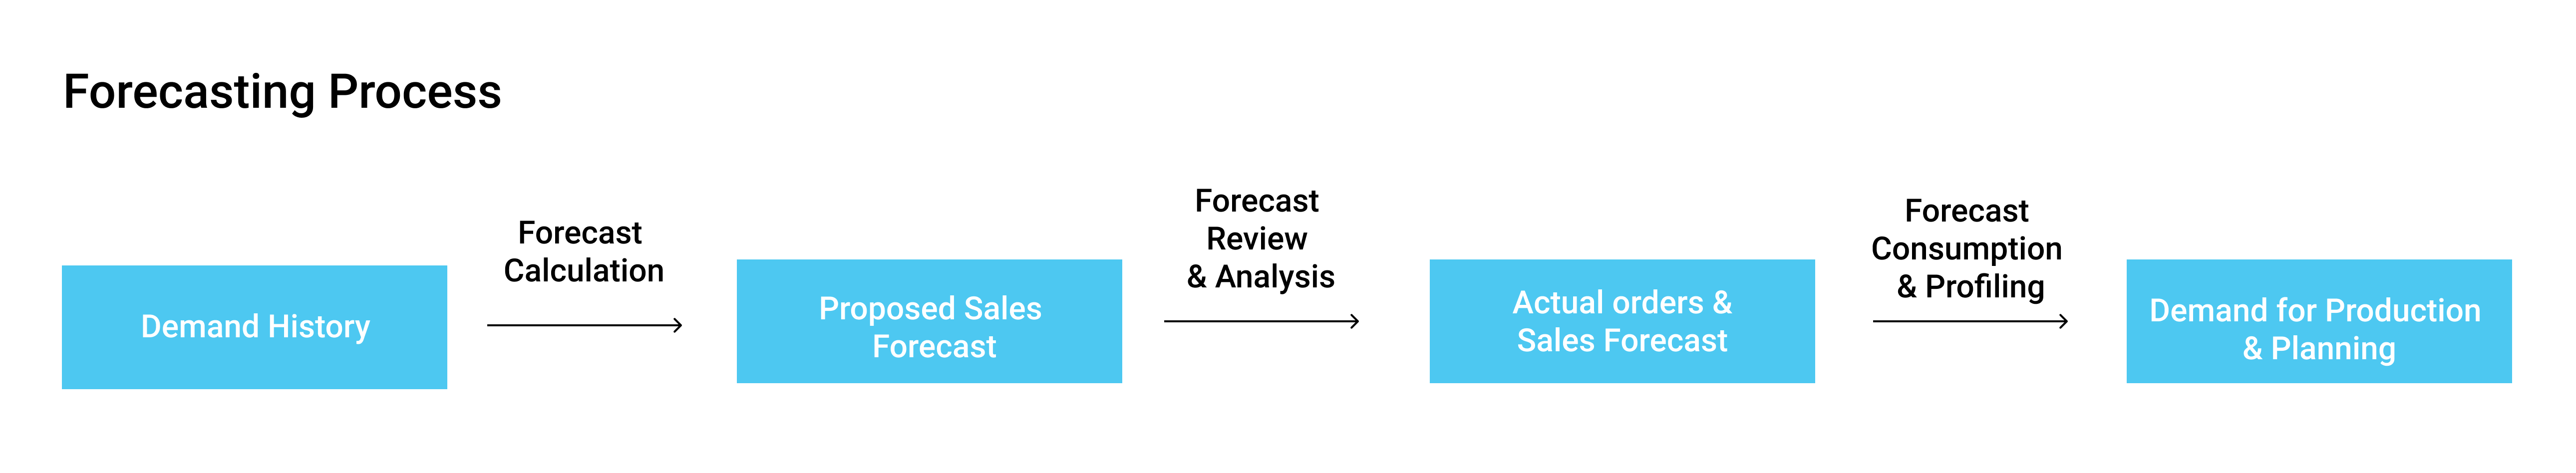
The method of predicting future revenue is sales forecasting. Accurate revenue forecasts enable businesses to make informed business decisions and predict success in the short and long term. Companies will base their predictions on revenue data from the past, comparisons around the market, and economic patterns.
Story of Tom
Tom is regional sales head for a FMCG giant based in New York, looking after baby food category
 He performed exceptionally well in previous role but is facing challenges in current role.He is unable to forecast correctly demand leading to poor manufacturing & inventory planning thereby increasing costs for company & bringing Tom under pressure.
PROBLEMS?

Looking for solutions he found something which solved his nightmares

Solution is-Sales Prediction
But how will it help Aman?? Answer is simple
Sales forecasting can be done using past data like macroeconomic trends, demographics, weather etc. which is available in public domain. Aman needs to collect these data and ask a data analyst to prepare a sales prediction model using these data and he can predict his revenue easily. On obtaining predicted revenue he can easily estimate return on investment & hence decide on sales target,asking manufacturing team’s quantity to produce

Prediction vs Forecast
Logic is what differentiates forecast from prediction.Forecasting is done on the basis of logic instead of just intuition.Participants for whom forecasting is done are not just participants but they are also critic of the work done.User has to evaluate the work, understand the logic behind method & accept the risk associated
Demand forecast vs sales forecast
Sales Forecast-It is a method used to forecast or anticipate future sales by using past data.For example, using previous data of sales in the previous three years alongside multiple factors impacting sales can be used to forecast future sales for next year.
It is a very powerful tool & easy to do across multiple businesses.However downside is it is difficult to implement if there are unrelated product lines & company is operating in diverse geographies.It could result in error & therefore factors need to be considered carefully.
Some of the factors which may lead to error in forecast are changing macroeconomic environment,implementing for a new product line,entry of new players or inorganic growth activities like promotions undertaken by the company.These factors are dynamic in nature & may not be included in historical sales data & using previous sales data for forecasting can lead to poor forecasting & unreliable results.
Advantages of forecasting
- Insights-One of the crucial roles played by forecasting is to provide a starting point for planning by obtaining the expected future value of sales.
- Cost decrease-By forecasting accurately, inventory planning could be done efficiently & hence optimize cost by production,dispatch & quantity of inventory to be hold planned.
- Estimate financial needs-Financial needs can be estimated by knowing the future forecasted business.Working capital & fixed capital could be arranged accordingly thereby maximizing ROI.
- Establish new business-New business can be established by forecasting business in advance,gauze the business potential & plan investment as per the forecasted figure.
However, there are certain disadvantages associated with it and that needs to be evaluated before making any decision.The forecast is never 100% accurate, hence relying completely on it can be catastrophic if forecasting done is far away from accuracy.Therefore it is important to do forecasting keeping in mind certain factors to minimize the error & hence reduce the probability of failure of forecasts.
Effective Forecasting
- Uncertainty scope to be defined-There maybe lot of factors both internal as well as external which can impact the future events. For example an airline company may forecast a certain demand in future, but it can be impacted in future due to external factors like high oil prices, wars or internal factors like operations staff mismanagement,IT system failure. Hence, it is important to broaden the scope of uncertainty around forecasting
- Accept the misfit-Many events won’t fit the criteria of today. For example a technology might be the future of tomorrow but may not fit in today’s imagination & hence can be excluded. But it is important to analyze this misfitness & include if required.
- Identify precursors of inflection-A change usually doesn’t occur in a linear fashion. It follows S curve, i.e starts slowly & quietly, then keeps on increasingly and at a point it explodes thus increasing exponentially before slowing down & cooling of eventually.It is very important to understand the precursors of exploding point or inflection point before it occurs.
- Avoid bias-We may have certain biases & it is critical to keep them away. For instance, there might be a bias that female drives perfume revenue more compared to men. This might not be true in reality & hence bias in a hypothesis should not be clung to.
- Historical data-Historical data is used to predict the future in forecasting, but past events might not be reflected in the future.For example, stock performance of the previous year might not be repeated in the current year & hence forecasting on the basis of past data might lead to catastrophic results.
- Understand when not to make a forecast-It is very important to understand the situations where forecast might not be possible. For example, before COVID-19, Indian economy was poised to be growing towards trillion dollar economy but COVID-19 impacted businesses & economy shrunk making forecasts redundant. It is very important to understand the spectrum of uncertainty & then make decision whether forecasting has to be done or not.
Application
| Application | Type & Data |
|
Sales Forecast |
Company's products’ forecasting for sale 3 years in advance
|
|
Market share forecasts |
Determining company’s share of products 3 in advance for 3 years
|
|
A product's income forecasting |
Computing direct expense of products
|
|
Relative market share forecasting |
Absolute market share expressed as a percentage or in other words sales of a product divided by the sales of the leading product of company.Estimating relative share of product 3 years in advance for different segments |
|
Value of market share forecasting |
Market share value
|
|
Profit and financial forecasts |
Profitability, of product for 3 and more years in advance
|
Decision making with forecasting
- Future prediction-As mentioned earlier it is used to estimate future phenomenon in present time & hence can give the company better edge over its competitors.
- Inventory planning-Since, inventory costs are one of the major costs in value chain.By identifying the future sales a company can plan inventory in most optimized way minimising its cots.
- Manufacturing planning/production planning-Production planning can be aided by forecasting demand & hence a major chunk of cost can be saved on warehousing,raw materials & labour by understanding demand in advance.
- ROI-Combining benefits above,ROI can be maximized by minimizing investment for revenue being generated.
Identifying technique
Multiple methods of forecasting has developed over years. But selection of technique depends upon multiple factors & usage of technique. Identifying the correct technique is very important because of presence of constraint of resources,timeline,objective,accuracy required & availability of data.
Manager & data analyst/scientist need to select right technique to bring required result for the organization.
For example,a particular technique might have been used in the past with great accuracy but the same technique might not be valid at other places because data types required might not be available in different scenarios.
Let’s understand different techniques & how to choose technique with situation requirements. However it is important to go through preliminary steps:
- Mutual discussion between manager & analyst is necessary before going further. They need to identify the objective of prediction. Here accuracy is the key since forecasting needs to be as accurate as possible. Also, if forecast is planned to being taken as benchmark it is important to filter out the effect of marketing & promotional activities. Future forecasting for a company without taking into consideration planned strategic moves & other activities is not a good way to move ahead.
However, say if a company wants to check the impact of undertaking a certain activity on sales then it needs to incorporate more sophisticated technique. Techniques vary in cost, scope & accuracy. Manager needs to weigh in cost & benefits before choosing right technique.
For illustration, suppose a fashion retail giant wants to expand in Texas by opening multiple stores throughout the state, he might opt for a very accurate forecast technique to plan his inventory. However, very accurate model might cost very much, so he will need to identify benefits/cost in terms of money saved from money saved by better inventory planning vs investment made in forecasting model development. After evaluating the benefits vs cost for multiple techniques he can make a decision which technique to choose. - A company always wants to maximize its sales & hence will work on finding factors in its control to maximize the sales.Hence, it is required to make a flowchart of value chain & understand different systems of value chain.
After this, the company can identify systems within its control affecting its target sales.It can make forecasts on those components frequently. - Identifying relevant factors is again a very important aspect. Many recent marketing activities,processing change,value chain restructuring can affect target objectives therefore making it important for managers & analysts to discuss it.
| All cost figures are in thousand dollars |
|---|
| Scenario | Cost to company due to inaccurate forecast | Cost due to investment in forecasting model | Net cost |
|
1 |
20 |
20 |
40 |
|
2 |
15 |
22 |
37 |
|
3 |
10 |
30 |
40 |
As we can see, the cost of inaccuracy decreases & at the same time cost of investing on forecast model increases. Hence, it is important to figure the total cost in multiple scenarios & choose the model for which sum of both cost is minimum.
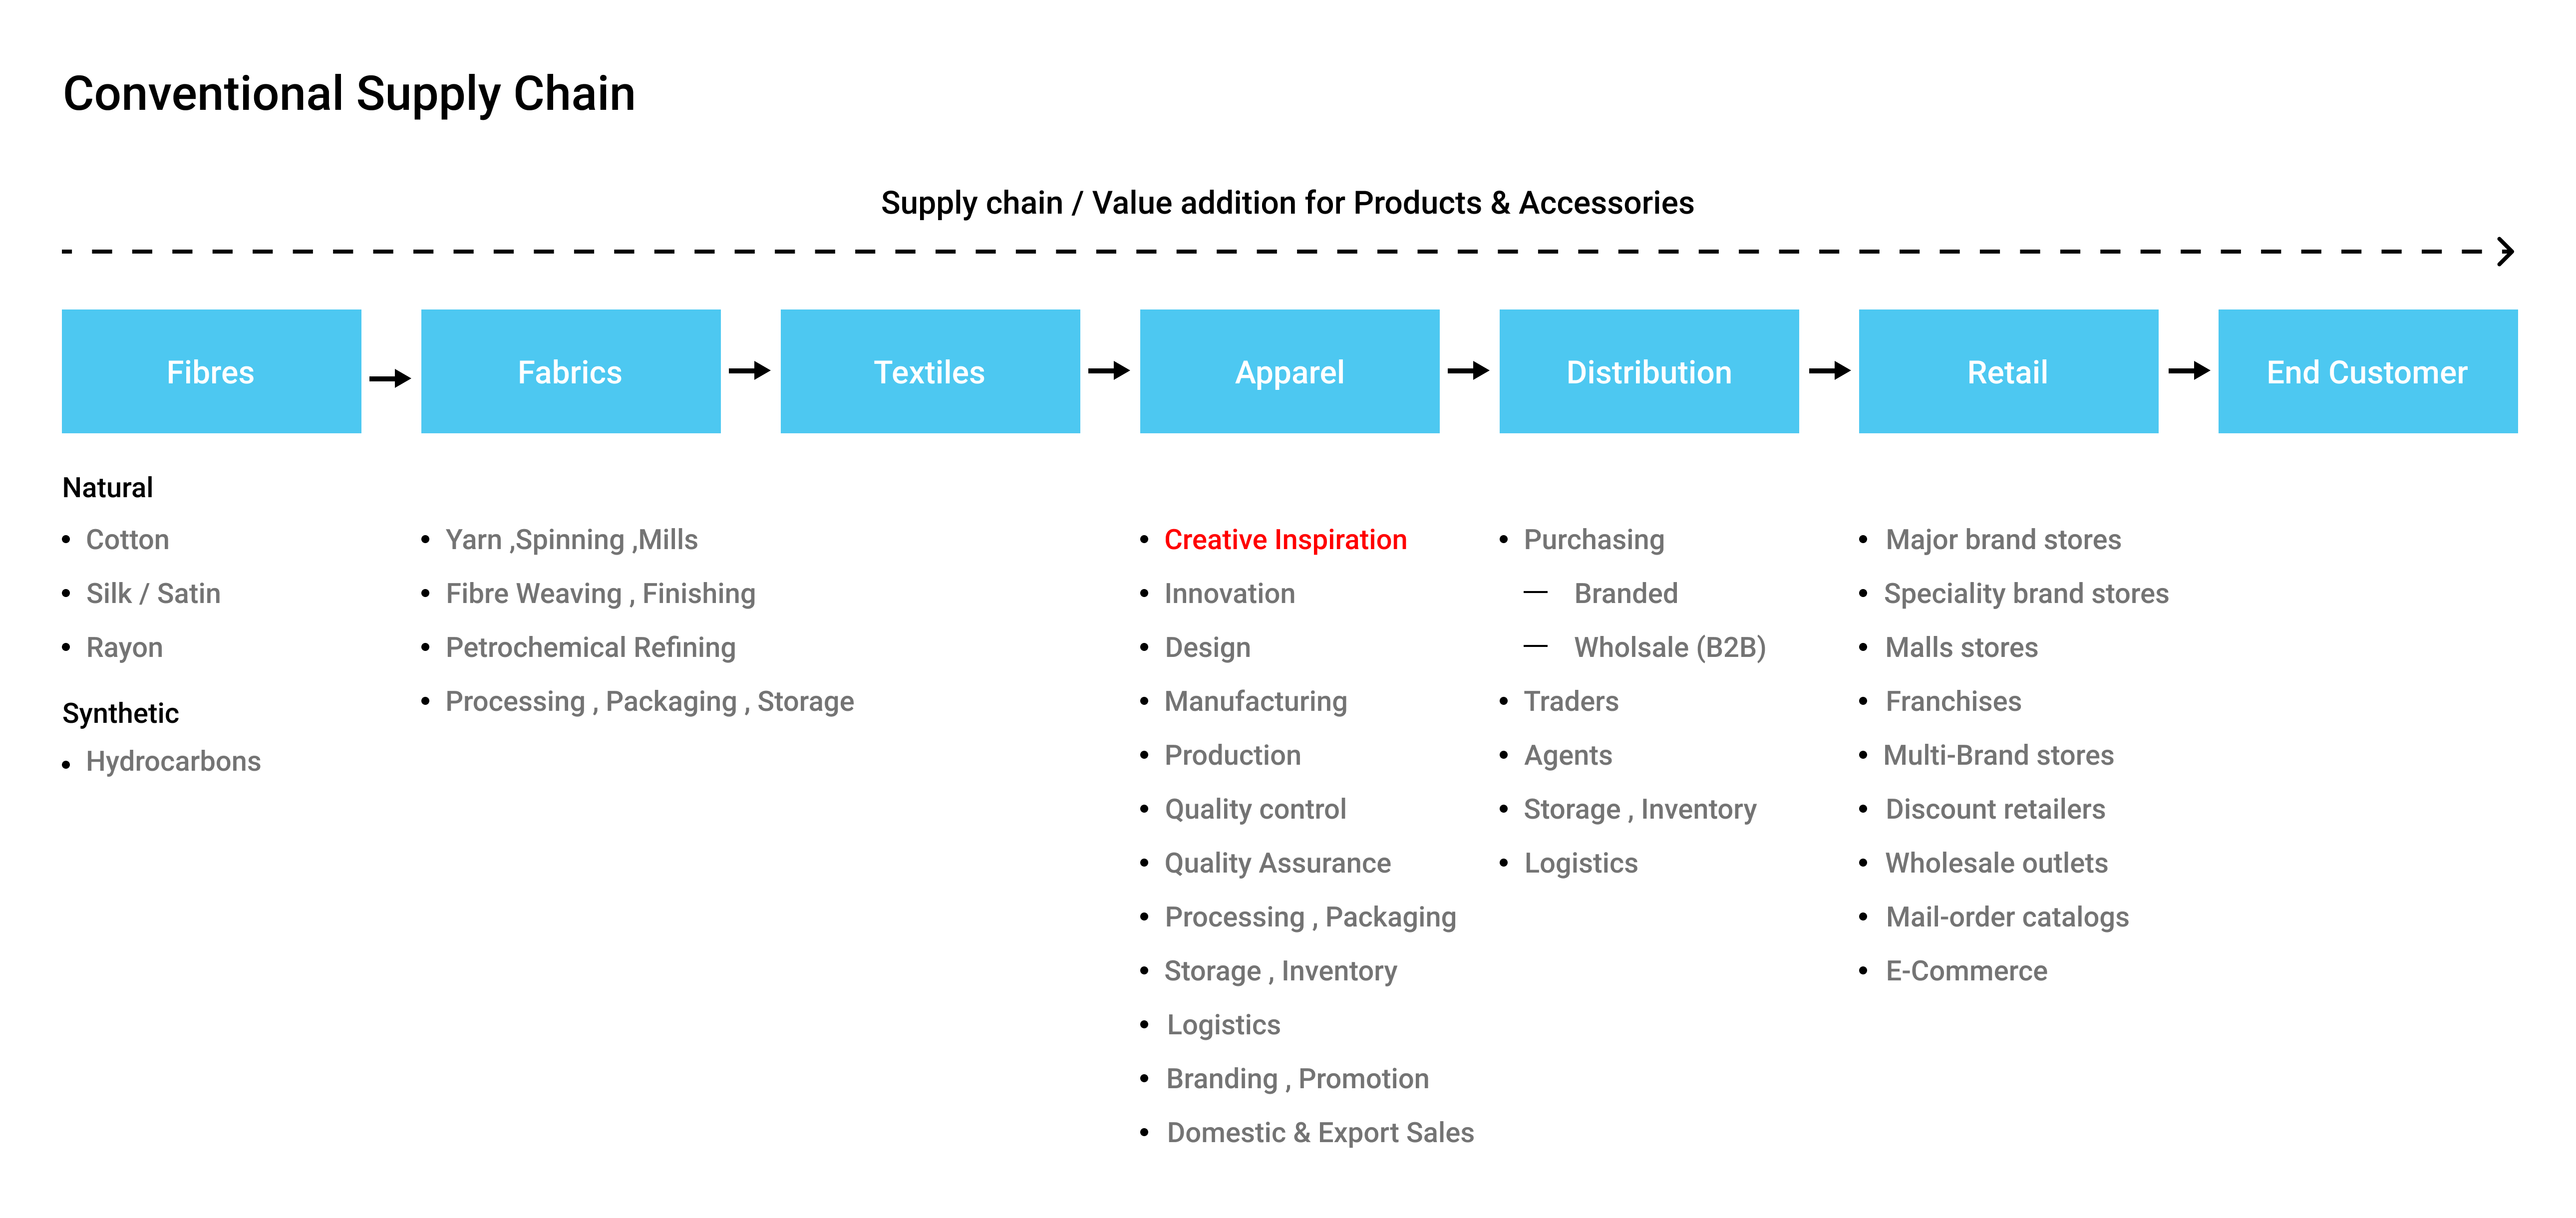
Consider the supply chain of a fashion retailer.The fashion retailer would want to maximize the sales to the end customer but there may be only few factors in the control of the company directly responsible for sales & it needs to identify them & work on it.
There are 3 types of forecasting techniques-qualitative techniques, time series analysis and projection, and causal models.
- Qualitative method takes opinion or feedback into consideration & may or may not include past data for analysis.
- Quantitative entirely on patterns and pattern changes, and thus relies entirely on historical data.
- Casual models are highly refined and specific information about relationships between system elements, and is powerful enough to take special events formally into accounts
These differences implies, same type of forecasting technique is not appropriate for forecasting sales, say, at all stages of the life cycle of a product—for example, a technique that relies on historical data would be redundant in forecasting the future of a totally new product having no history.
Qualitative technique
It is used when the data availability is an issue.It uses human discretion to turn qualitative data into quantitative data by rating,ranking etc.
The methods comes under qualitative technique of forecasting
| Methods | Process | Accuracy |
|
Delphi Method |
It also involves a panel in decision making.This is the technique where a question is asked to a panel member & follow up question depends upon the answer of previous question.The information is made available to all members of panel |
Good |
|
Market Research |
It involves selecting markets & deciding on hypotheses followed by testing.Developing & testing hypotheses is continuously done until required data is obtained. |
Very Good |
|
Panel Consensus |
A group of experts come together to come up to a conclusion.However, group consensus can be driven by multiple factors like social factors, influence of a few members of group etc. & this may lead to poor accuracy |
Bad |
|
Historical Analogy |
This is very commonly used technique to gauze demand by drawing analogy with a similar type of product launched either in target market of company or market with similar features of target market |
Fair |
Qualitative methods are used when data is not available because the product is either new or the market is absolutely new with no historical data available. For example, suppose a new vaccine is launched for immunisation against a new disease, it will be very difficult to predict demand & hence production planning would be difficult to implement.
The only way a company can gather insights is either going to field & ask its representatives to gather data relevant to market or seek a panel of experts who have done research in past about market & understand it very well.
These methods work best for short period forecasts i.e less than 3 months.They are also very costly as well as time consuming methods
Quantitative Methods
There are 2 types of quantitative methods which can be used for demand forecasting
- Time series methods
- Causal methods
Time series methodology
These methods are used when historical data is available & data is structured in historical pattern. The underlying assumption in time series methodologies is that the trends like seasonality, cyclicity will repeat themselves.
| Methods | Process | Accuracy |
|
Moving Average Method |
In this method, average of a chosen n number of periods is taken as forecasted figure.The time period chosen is on the discretion of manager & analyst |
Poor |
|
Exponential Smoothing |
It is similar to the moving average method, with only difference being the recent period values are given more weightage. |
Good |
|
ARIMA(Auto Regressive Integrated Moving Average) |
Requires minimum 30-40 data points & should have minimal outliers.It uses lagged observations for future forecasting. Autoregression is a process of regressing a variable on past values of itself.It works by putting weightage on time series of data |
Good |
|
X-11 |
It applies seasonality adjustment by additive or multiplicative adjustment & creates output dataset based on adjustment of seasonality.The adjustment of seasonality assumes that fluctuations can be measured on time series & can be identified from trends. |
Very Good |
These methods work best for a forecast time period less than 1 year. Minimum 2 years of data is required for forecasting in scenarios where seasonality is present otherwise less than 2 years of data is suffice. For ARIMA minimum 3 years of data is required on the other hand for X11 minimum 3 years of data is needed.
Costing for time series methods are very low compared to qualitative methods
AI & ML in sales forecasting
AI & ML are not just the buzzwords but reality of the 21st century. CRM has traditionally helped companies forecast sales but their record has been filled with patches of inaccuracy. Also, only a quarter of companies use sales forecasting & among these among 86% have experienced positive growth already. The biggest differentiator it pertains not just the ability to improve accuracy and confidence, but at the same time ability to provide insights and recommendations to increase win rates.
In additive seasonal adjustment, each value of a time series is adjusted by adding or subtracting a quantity representing the absolute amount by which the value in that season of the year tends to be below or above normal, estimated from past data.
Multiplicative seasonal adjustment is done by dividing each value of the data of time series by a seasonal index (or a number close to 1.0) which represents the percentage of normal typically observed in a particular season.
Causal Methods
The strategy that assumes that the variable to be predicted has a cause-effect relationship with one or more other independent variables is causal forecasting.
All potential variables that can affect the dependent variable are typically taken into account by causal techniques.
The data needed for such forecasting can therefore range from internal sales data to external data, such as surveys, measures of macroeconomics, product characteristics, social chatter, etc. Causal models are typically regularly updated to ensure that the latest data is integrated into the model.
Some of the methods are:
| Methods | Process | Accuracy |
|
Regression |
A function is calculated in this method using the least square method between the dependent and independent variables that describe the relationship between them.A simple example would be to forecast a company's margin (dependent variable) based on variables such as the cost of sales of products, inventory keeping, etc. |
Very Good |
|
Econometric |
In order to predict future trends, the econometric modelling approach uses economic variables.It depends on the relationship between the economic variables and the internal sales details.CPI, exchange rates, inflation, job rate, etc. are some of the economic variables.Econometric models are a system of interdependent regression equations and it is this type of the model that gives better results compared to ordinary regression in explaining casualties. |
Excellent |
|
Leading Indicator Model |
In order to determine causation between the movement of two time series variables, the leading indicator methodology uses a combination of regression models and willingness to purchase survey results.Economic activity is one of the variables here, and the dependent variable is the other.One of the variables here is economic activity, and the dependent variable is the other one. |
Poor |
|
X-11 |
It applies seasonality adjustment by additive or multiplicative adjustment & creates output dataset based on adjustment of seasonality.The adjustment of seasonality assumes that fluctuations can be measured on time series & can be identified from trends. |
Very Good |
Regression can be done without substantial cost.Economic & lead indicator models however need substantial data from field surveys as wells as economic data which are costly to procure.
These methods are successful in long term to medium term.
Time required for regression varies according to data type,however for leading indicator models & econometric models the time required is at least one month.
Risks & challenges
Many of the time inaccuracies occur not because of faulty algorithms but because of faults of humans.
- Sandbagging-Sales team may under report data fearing job termination or low incentives & this data used in creating models leads to faulty forecasting.
- Parallel datasets-Many times employees maintain two data sets, i.e one for reporting & other data set is the original data.
The reported one is manipulates,undermined or inflated data which can lead to poor forecasting. - Vague Definitions-Vague definitions can undermine efforts taken in market survey, creating algorithms & lead to inaccurate forecasts.
For example, a sales team may come up with a vague definition of turnover time leaving the feeding data by each business unit on a scale of 0-5. Since, choosing point would depend on the discretion of individual business unit manager, the vague definition will result in a non uniform data filling & hence forecast results would vary. - Inaccurate monitoring-It is one of the challenges caused due to either absence of a robust system or lack of willingness to monitor data.At many points data collected is not accurate & it will lead to poor forecasting.
Demand forecast-It is used to forecast demand from the customer side, i.e how much is the customer willing to buy at a particular price for a product with specific features.Using statistics multiple factors like price, seasonality, cannibalization, demography it can be done.
It can help companies plan their inventory, prevent under stocking or overstocking thereby minimize inventory costs while at the same time cater to existing demand.
However there is a major challenge to companies.In this era there is mammoth data available, hence it is critical to identify & crystalize relevant data points to predict correctly,
Is historical data sufficient for forecasting?
With so much sophisticated data & tools available there is a major question for companies to trust the forecast.
NeenOpal uses state of art tools & techniques to provide forecasting services among multiple services to clients. In one situation, a client who is a major player in health & beauty products asked us to create a sales forecast model. Using historical data, team delved into preparing solution.
However, there was one observation-stockouts. The client was facing stockout everyday henceforth the implication was there was huge demand for its products. Using only historical data to forecast would have given only half of solution.Daily stockout implied potential demand was higher.
The observed stock/sales ratio was close to 1,which ideally should have been .90(on the basis of previous experience & expertise).Hence, using only past data would have provided a sales forecast model which would predict undermined future demand.
Hence, this observation was included to guide company to predict potential demand & maintain appropriate inventory stocks to meet potential demand keeping inventory cost minimum.
As already mentioned, for launch of a new product there is unavailability of historical data about product demand or sales. To cope up with this situation replacement product concept is used. Let’s understand this for a client in mobile phone industry.For every new mobile handset launched, there are many features which have been present in old phones.To tackle unavailability of historical data, the product features are identified which can be found in products previously launched by company.Using the sales data or demand data the sales or demand forecast can be identified for newly launched product.
Similarly in fashion retail industry many big players face the challenge of sales forecast before opening a new store in a new city. To solve this, they map the city with a buddy city, or in simple language they identify a city similar to the city where product is launched in terms of demographic mix, population, income indicators and so on. Using historical data of sales of buddy city the forecast for sales of store opened in new city is done.
Let’s understand from another perspective.There was a client who was a tile manufacturer.In tile business, manufacturing units manufacture a large tile of a particular dimension from which various sizes of tiles are carved out.In tile industry, the sales is measured in sum of area of total large tiles of fixed dimension sold from which various size category tiles are carved out.The client was not facing declining sales as per the standard of sum of area of total large sized tiles sold.However, on further deep diving we identified total area of tiles sold remained constant but there was a sharp decline in sale of tiles of large size & for small tiles the sales trend was on rise. Had we gone with standard industry practice the problem would have been difficult to identify.Hence, it is important to have understanding of variables & definitions.Fuzzy drefinitions may lead to a dead end.
These instances can occur in every situation & hence a balcony view is necessary to analyze multiple factors & identify relevant factors to create an appropriate model for forecasting.
Product Lifecycle & Forecasting
Demand as well as sales of a product varies a lot according to the stage of lifecycle the product is into
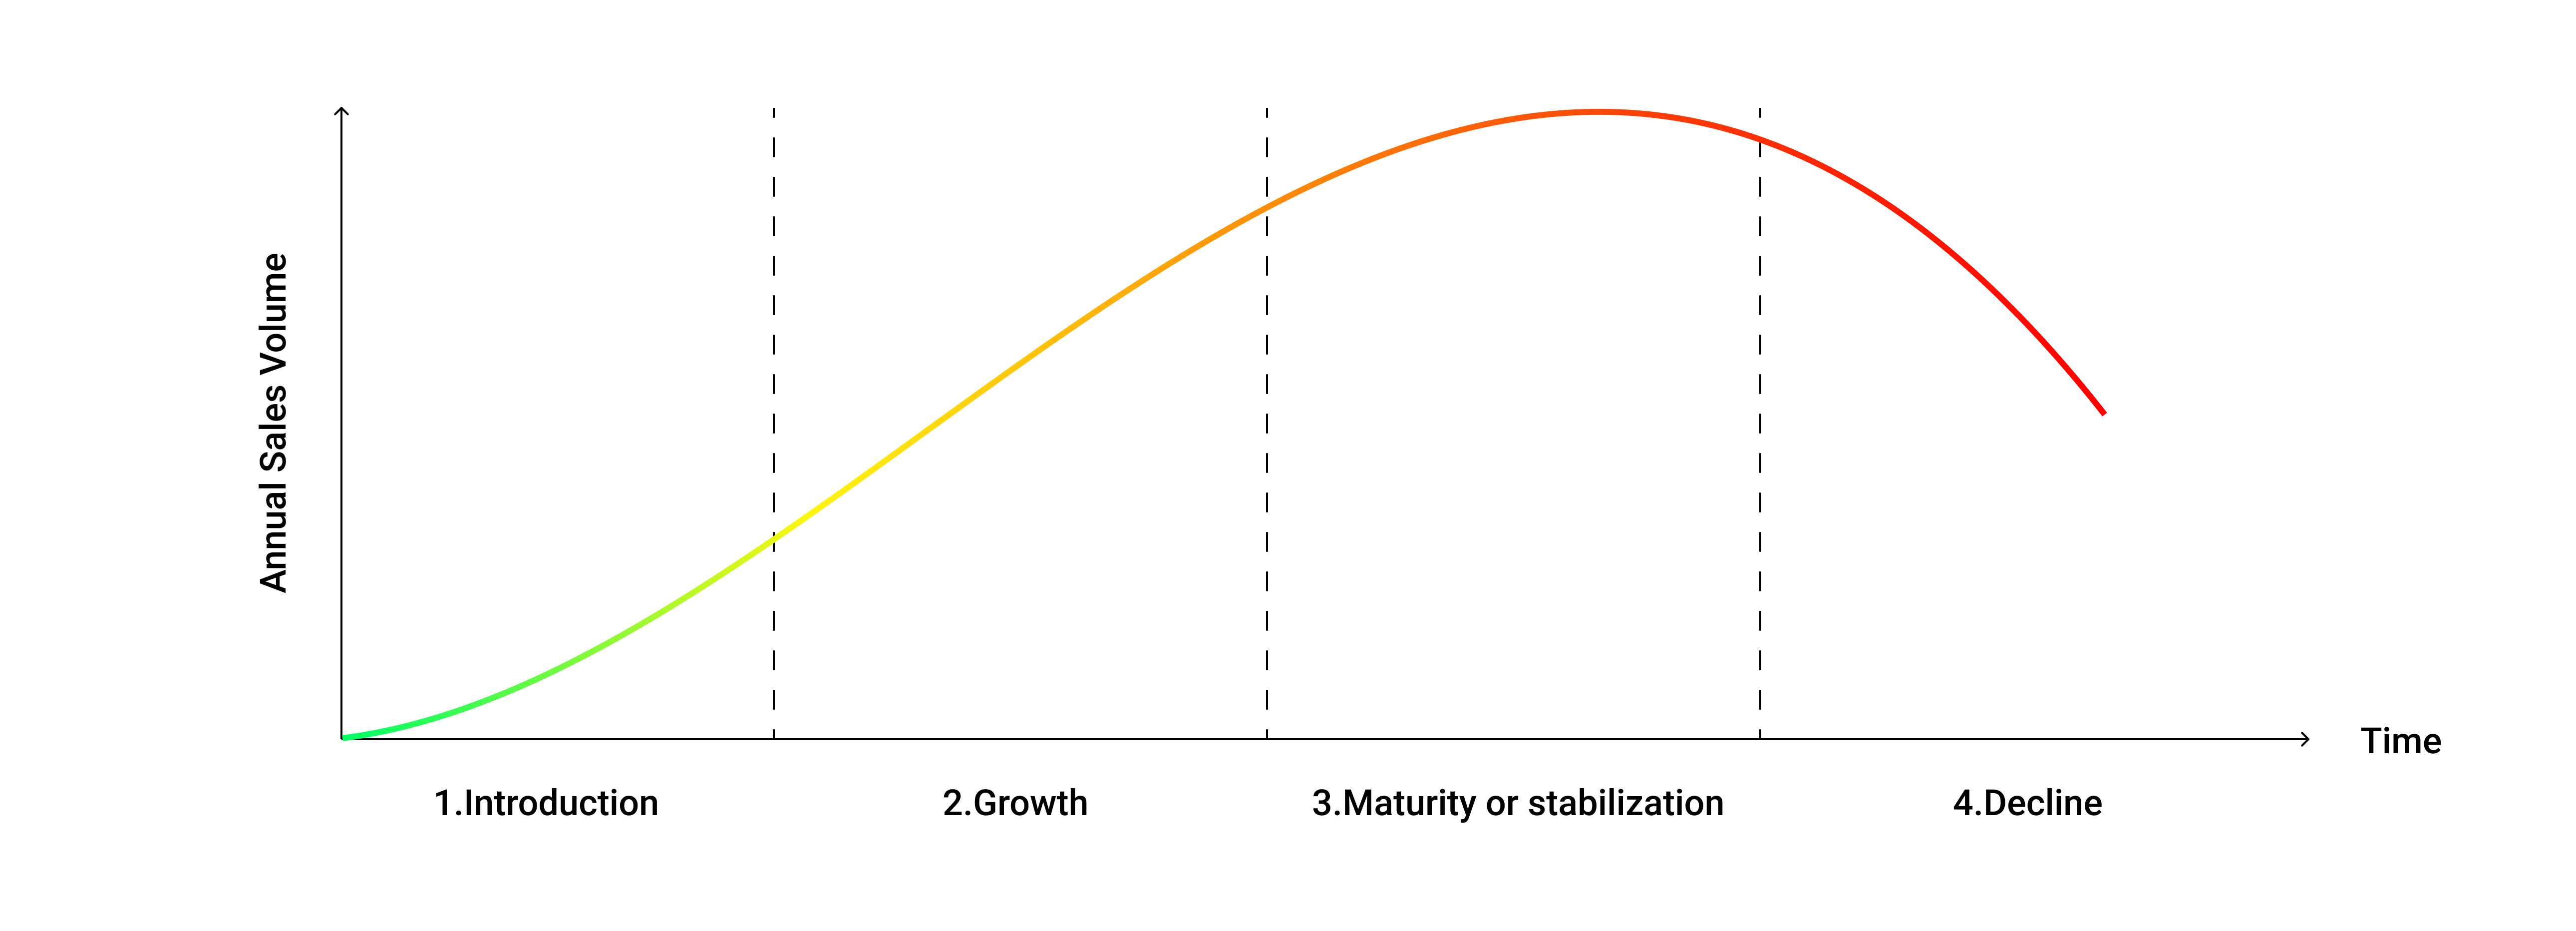
Hence before forecasting it is important to take into consideration the lifecycle of the product.
- Introduction: It is very challenging to predict the demand of a product at the introduction stage.It becomes more difficult once the impact of proportional activities is taken into account for anticipated growth rate. Hence, the strategy as mentioned earlier of using historical data of products with similar features to forecast demand or sales
- Growth: Here it is important to identify growth pattern.For example suppose, linear growth rate of 10% is observed in the past 6 months, then for future forecasting this can be considered with slight deviations.
- Maturity: In this phase, the growth fades away & instead of steady growth gradual sales can be seen. Hence, demand forecast need not be steady growing, rather it needs to be steady in nature.
- Decline: After the product reaches maturity,in the next stage decline is observed in sales & demand. The trend is approximately linear & hence, it has to be taken into account while forecasting.
Conclusion
With data getting more exhaustive & advance of new technologies & tools sales forecasting is the way forward for companies to predict future sales taking into consideration multiple factors of seasonality, macroeconomic conditions.
It is necessary not only for planning resources for manufacturing, inventory planning, resource allocation but also for gaining advantage over competitors. Unreliable forecasting not only costs just time & resources but also jeopardizes chances of future growth & expansion.