
The influence of social media on human lives has been increasing with the pandemic.
With the need to stay connected, social media now has a huge effect on the decision-making process of customers. This has made online presence one of the most critical marketing tools. Successful inbound marketing strategy helps in driving revenues by increasing the sales and organic reach of the company. This dashboard has following three views:
- Overview dashboard: This gives an overview about the current social media presence of the company across various social media platforms.
- Conversion dashboard: It talks about conversion rate and revenue from social media investments.
- Customer Insights: It gives an insight about the new and old customers, their demographics, average order and lifetime value.
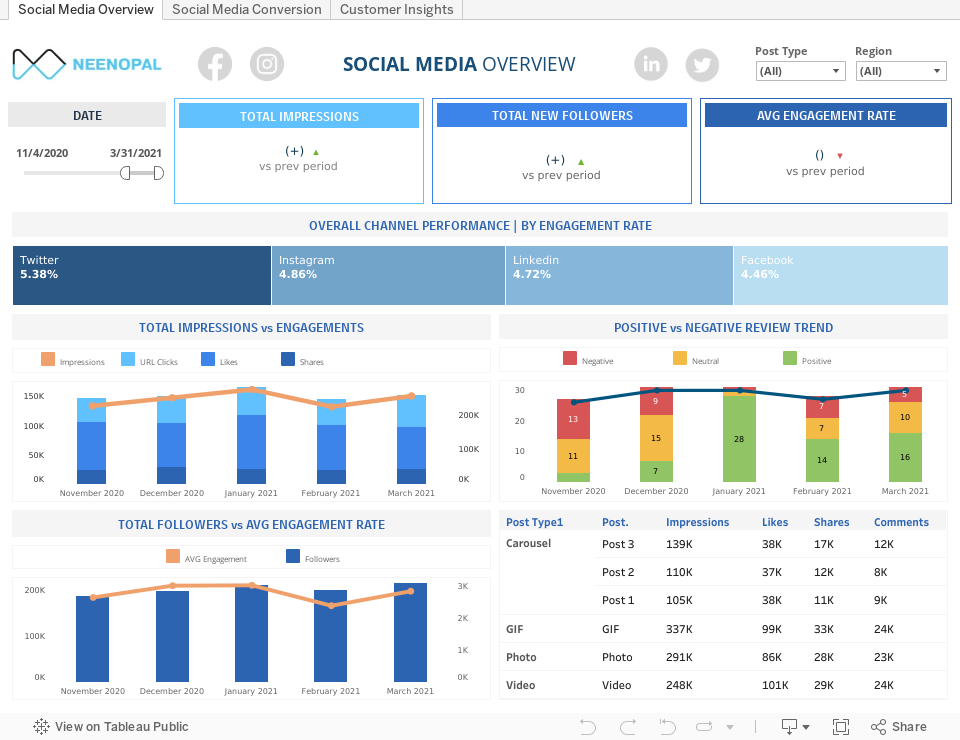
Overview Dashboard
This dashboard is like a performance review of the current social media marketing strategy, assessing where the brand stands in terms of the below goals:
- Spreading brand awareness among people
- Generating new leads
- Effect of Ad campaigns/posts in increasing reach
- Increasing brand engagement that can further lead to conversions
- Brand perception among users
Key Terms:
- Social media engagement accounts for any form of communication between the customer and the page – be it clicks or likes or comments. Higher the engagement, higher the probability of lead conversion.
- Average Engagement rate is a metric used to assess the average number of interactions social media content receives per follower.
- Impressions is a measure that talks about the number of views of the campaigns.
- Whenever the name of the brand is taken in social media, it becomes social mention.
- Follower is the one who has subscribed to the account in order to receive the updates about it.
| Goals | Questions to ask | Dashboard views |
| Spreading brand awareness among people | How many people are curious about the brand now? | Total New followers |
| Effect of campaigns/posts in increasing reach | Which among the posts are more successful in pulling in the audience? | Comparison table of posts |
| Increasing engagement to lead to conversion | Are the posts able to catch user attention? | Total impressions vs Engagements |
| Brand perception among users | What do users have to say about the brand (positive/ negative/ neutral)? | Positive vs Negative Review Trend
|

The dashboard changes its view to represent the data concerned to facebook, instagram, linkedin or twitter as per the user choice.
- Comparison table: Each social media platform has their own type of creative. Twitter is all about tweets whereas Instagram, hashtags. The details about the reach of these posts talks about the effectiveness of the ads in these platforms.
- Total Followers vs Avg Engagement Rate: This graph helps in understanding the engagement rate per follower and lets the user compare the metrics across the four platforms.
- Total impressions vs Engagements: It talks about the degree to which the post could attract users. While the impression speaks only about the number of times a post has been viewed, engagement shows how it has been able to catch user attention.
- Review Trend: With positive mentions, the company may be able to attract more customers to buy the products. Customer grievances often take the form of negative mentions which can help in product development.
Conversions dashboard:
In an ecommerce venture, conversions are the key to the success of the business. When a customer who visits the website makes a purchase, it is called a conversion and increasing the conversion rate is one of the most important goals of the business.

The traditional big band advertising, spending millions of dollars to advertise on TVs, billboards and radio have lost its lustre. Digital advertising has boomed in the past few years.It is more customer centric, targeted, data-driven and has the potential to reach a wide range of customers.
The business spends on digital advertising campaigns across various platforms on the web, expecting a good return. Once a user clicks on the Ad, he gets redirected to the destination page, displaying the necessary information about the products. The number of clicks is a measure that helps to understand how well the audience is responding to the marketing message.
Once the user is on the website, and decides on purchasing the products from the site, it is treated as a conversion. The revenue from the conversions is always compared against the cost spent on advertising to realize the Return on Advertisements. This is a major factor in deciding whether more money needs to be spent on a campaign or the campaign needs to be withdrawn. This also helps in understanding what attracts customers and what doesn’t thus helping in planning the future strategies.
This dashboard tracks how user interest gets converted to transactions and generates revenue. It talks about the below aspects of online marketing:
- How the amount of money spend on Ads can affect conversion
- How the organic and paid channels contribute to conversions
- Comparing campaigns to find the best and worst ones
- Analysing the conversion trend over time
- Performance of various platforms in terms of conversion
Spend Simulator for What – if Analysis:

Key Terms:
- ROAS or Return on Ad spend is the amount of revenue business earns for each dollar spend on advertisements.
- Conversion rate is the number of conversions per visitor. The visits from search engines that get converted to deals makes the organic conversions. The paid conversions show the direct impact of the investments in advertisements in social media.
- Cost per Conversion is the actual cost involved in converting a customer.
| Goals | Questions to ask | Dashboard views | |
| To understand the impact of Ad cost on revenue | How will the conversion rate and revenue change with Ad expenditure? Is the return on Ad good? |
Spend Simulator Revenue Trend |
|
| Comparison of the effectiveness of campaigns | Which campaigns are most effective in bringing revenues? Which campaigns need to be stopped as they are not profitable? |
Campaign summary table | |
| Contribution of organic and paid channels to conversion | Should the business focus more on the organic channel or paid channels? | Paid vs Organic Conversions | |
| Performance of various platforms in terms of conversion | Which social media platform is effective in bringing more conversion? How are the channels performing in terms of conversion? |
Conversions by channel | |
| Change in conversion trend overtime | How has the conversions and cost/conversion changed overtime? |
|

- ROAS answers one of the most fundamental concerns of marketers – the return on the money spent for advertising on a particular channel. The entire budget planning depends on this. The revenue versus ROAS graph gives a comparison between revenue earned and actual return on the investment.
- A summary of the campaign, cost spent on it, clicks, conversions, and revenue from it helps to get an overall view about its success and also helps in comparing various campaigns with each other. Identifying the campaigns that led to maximum revenue realization is important for understanding the preferences of target customers.
- Customers can land on the web page through multiple routes - broadly classified into organic and paid. Measuring these conversions separately is important to decide on which among this should be given more attention in future. The visits from search engines that get converted to deals make the organic conversions and those through paid channels like the advertisements in social media platforms, constitute paid conversions.The sheer scale of user base of search engines like google makes organic traffic a powerful marketing channel.
Customer Insights dashboard
Information about customers helps in formulating the product and pricing strategy. It also helps in building campaigns that could attract the target audience.
- This dashboard helps in analysing customer profiles to achieve the below goals:
- To assess the success of customer acquisition and customer retention strategies
- To understand purchasing habit of the customer
- To understand customer profile in terms of age, gender, location, device used
- To know the lifetime value of customers
Key Terms:
- CLV or Customer Lifetime Value is the total amount of money the customer is expected to spend in the business during their lifetime.
- AOV or Average Order Value is the average amount spent each time a customer places an order.
| Goals | Questions to ask | Dashboard views | |
| To assess the success of customer acquisition and customer retention strategies | How many new customers are acquired in the time period? Over the time period, how has the ratio of repeat customers to new customers changed? |
Total New Customers New vs Returning Customers |
|
| To understand purchasing habit of the customer | How has the AOV changed with revenue over time? | Average Order Value vs Revenue | |
| To understand customer profile in terms of age, gender, location, device used | Which age group or/ and gender category has made the maximum number of purchases. Which region contributes maximum revenue? Which device is used by maximum customers? |
Revenue by User Gender Revenue by User Age Revenue by Location Revenue by device type |
|
| To understand the lifetime value of customers | What is the CLV for the current period? How has it changed with respect to the previous period? |
|

- The New vs Returning customers graph shows the customer acquisition trend over time and also shows the source channel for the same. This helps in comparing the performance of the marketing team over time in attracting customers.
- Customer Lifetime gives the real position of the business in the eyes of the customer. It is an indicator of the brand loyalty and the recurring revenue business can expect from the customers. Higher this number, greater the profits.
- The customer profile based on gender and age helps in deciding the target customers thereby helping in framing strategies to focus exclusively on them. It also helps in identifying those groups which are not interested in our products and could even backtrack the reasons for their lack of interest, further formulating plans and offers to attract them
- Revenue by location also indirectly gives the success of marketing strategies in different locations. A low value could mean the advertisements and other promotional offers in the area are not effective in attracting customers.
Conclusion
Social media can play a huge role in bringing a brand closer to its customers, thereby giving it a competitive advantage over others. Insights from the above analysis can help the business plan the right social media strategy.