One of the great things about Tableau is that you become a fan! It is impressive not just as a BI tool but also great for ad-hoc analysis. It simplifies most complex tasks and a good tableau developer can do most data transformations within the Tableau interface itself.
We have compiled a list of features and tricks that we feel tableau developers are not using enough. Do tell us how many tips you found useful.
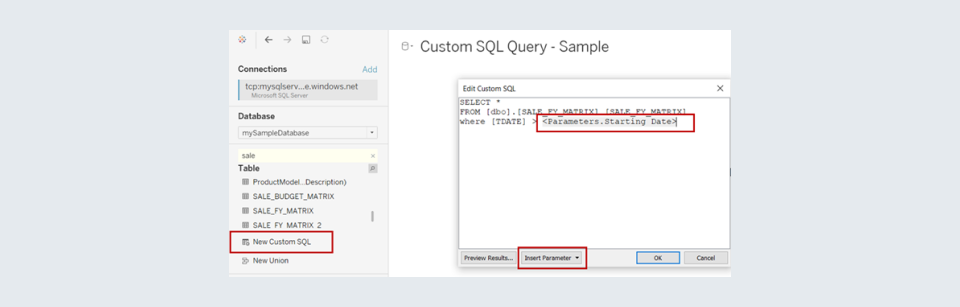
Write Custom SQL Queries In Tableau Using Dynamic Input Parameters
Explainer :
Often, tableau developers need the input table to the dashboard in a particular format - they may want changes such as addition of columns from other tables. There may be complex join conditions on tables which can be done easily in a SQL query as compared to tableau formulas.
Use cases :
What is the use of input parameters in a custom SQL query? Assume you are working on a ‘As on Date Report’ (such as Outstanding Loans Report, Stock on Hand Report). There may be join and filter conditions being done in the SQL query based on the “reference date”. How do we allow the user to view the same report in the tableau interface for custom “reference date” inputs.
Here comes the custom SQL query feature along with date input parameters to the rescue. Users no longer need to make changes in the database - it would have been difficult anyways to get data for all possible “reference dates” in the SQL table.
Other applications of using dynamic parameters in custom SQL queries are Customer Churn or CLTV computations where we may need to give the end user flexibility to select an end date or date range for computations.
Implementation Steps :
- Connect to the SQL database.
- Drop Custom SQL query option to the canvas.
- Write your SQL query (If you are new to this or having difficulty in getting the syntax right, you can drop your table to the canvas and convert it into a custom SQL query to get the basic syntax).

- Now click on the ‘Insert Parameter’ and create a new parameter such as date.
- Use the created Parameter as required in the query (e.g. in join and where conditions).
- Create your report and KPIs using the output of the SQL query.
- Change the date parameter and observe the change in input table data!
- Use the created Parameter as required in the query (e.g. in join and where conditions).
Additional Information :
For a more detailed explanation of custom SQL, please refer to the link here
Display Top N List With Grand Total Of All Elements And Contribution Percentage
Explainer :
When we display top N elements in a chart and view the column total information, we are only able to see the total of top N elements and it is difficult to see the grand total of all elements in the same chart. Also, when we express values as the percentage of the column total, it will only compute the contribution to the top N subtotal and not against grand total.
Use cases :
A common business requirement from tableau dashboards is to display the top N list such as Top 10 Products (or Top 10 Salesperson) by sales and additional information related to the products such as Quantity, Product Description, Profit, etc. In the same chart, we may want to see the total sales of the top 10 items, the total sales of all items, and the percentage contribution of each item.
Sample use case chart :

Implementation Steps :
- Create a parameter where the user can select the value of N for the top N products they want to view on their dashboard.

- Create a Set of products where the condition is top N products (our parameter) as per the sum of sales.

- Drop the set to rows followed by the actual product name as columns in the chart.

- Show both in and out of set products and find the subtotals using the analytics tab to display the total of each set.
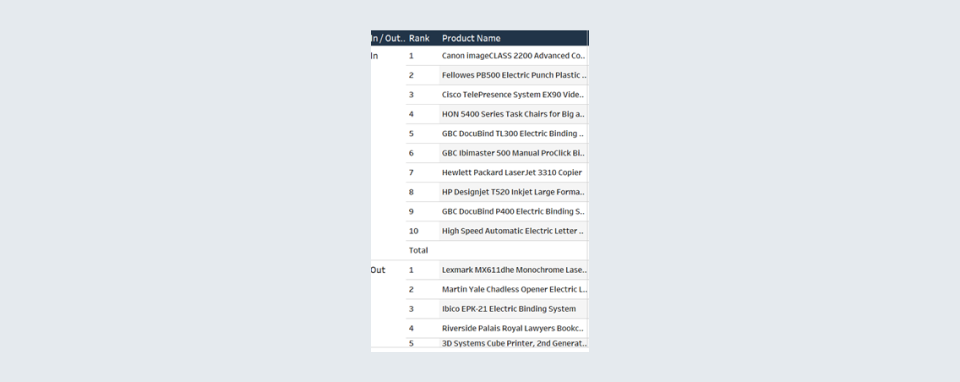
- Similarly, add the grand total row, which will give us the total of both ‘in’ and ‘out’ set in our view.

- The main trick here now is to hide the data in the ‘Out’ set. Right-click on the Out set and select Hide (Remember you should hide the data and not exclude it). The next step would be to uncheck the ‘show header’ for the ‘Set’ column so that the column is not visible to the users.

- To create the % of Grand total, express the Total Sales value as % of the column total. There you go - you have everything you need.
Replace References
Explainer :
A useful feature using which we can redirect tableau from using the existing column to another column and refer to the new values. After the replacement, tableau automatically updates all formulas that were using the previous column to refer to the new column.
Use cases :
While updating an existing data source or replacing it with another data source, it’s very common for our existing calculations to break down. That’s because Tableau is unable to match the new columns with the old ones due to reasons such as changes in column names, spaces, or case changes. This is where replacing reference features comes in handy.
This is very useful when multiple people are handling the same dashboard, or we are trying to make an old dashboard work on the latest data source. Such errors can occur as the column names can be changed or renamed, and the tableau workbooks break because they cannot automatically map to the new column itself.
Replace references are also beneficial when we want to correct or update formulas. For example, assume we have used ‘Gross Sales’ - a direct raw column from the SQL table and built all the formulas in tableau. Now, the business users have requested to use ‘Net Sales’ instead of ‘Gross Sales’ in the entire workbook. We can use ‘replace references’ and make the entire change in two minutes without having to worry about correcting multiple formulas.
Implementation Steps :
- Right-click on the old column.
- Click on replace reference.
- Select the new column name that is supposed to replace it.


How To Prevent Tableau Extract From Locking Your Formulas
Explainer :
Developers working with tableau extracts as input data sources are unable to directly edit the original formulas and only get an option to ‘edit copy’.
While publishing any data used in making the dashboards on Tableau online/server, it is very important to keep in mind the version of data that is being uploaded. One version is the raw data where we have connected tableau to a data source but no calculated columns have been created in Tableau and the second one is where we have made calculated fields.
The problem is that if we create an extract of our data by publishing the second version on tableau servers, our formulas become a new column in the underlying data like any other actual column. Now, when we try to edit these calculated columns in our Tableau workbook, tableau only provides an option to ‘Edit Copy’ of these calculated fields. This is what we are defining as locking of the tableau formulas.
Developers need to update the formula in the copy of the respective column and then use Replace references to use the logic of the new updated column instead of the previous column. This increases the time and complexity for making changes especially when multiple formulas need to be updated. Additionally, developers have experienced difficulties in renaming the new calculated column to the original column name.
Use cases :
Raw extract publishing should be adopted by developers where there can be frequent changes in tableau formulas after development. Another use case is when the data set is very heavy, say 100 million rows and the extract needs to be published before any development can be done.
Implementation Steps :
- Create an extract of the raw data and publish the data source online.
- Connect the tableau workbook to the published raw data extract.
- Develop your tableau dashboard and calculate columns in the dashboard using the raw extract. This way, all the formulas made will be a property of the dashboard and not the extract. You will never get locked out!
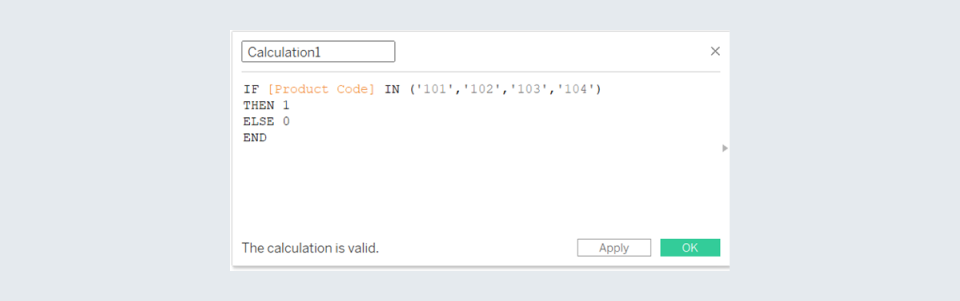
IN Function In Tableau
Explainer :
Finally, no more repeating the same lines in your IF statements, the ‘IN’ function is finally available in tableau. Most of us are already aware of the IN function in SQL and now Tableau has now enabled this function.
Use cases :
Keeps the formula short and crisp when we have a lot of values to check in the IF condition.
Implementation Steps :
The Amazing Date Functions & Features In Tableau
Explainer:
We all have been guilty of using too many steps when we work with dates in Tableau. For example, look at how people compute and handle data transformations:
-
(When the financial year starts in April) Financial year = If month [Sales Date] <4, then year[Sales Date] -1 else year [Sales Date].
-
When we want to compare whether months of two different dates are matching or offset by a certain number of months, we write confusing formulas. The ideal Solution is to use the Datetrunc function - for example, when we want to check whether the Sales date belongs to the previous month then we can write a formula as given below: DATETRUNC(‘month’, [Sales Date]) = DATEADD('month', -1, (DATETRUNC(‘month’, Today() )).
-
Want to check if the financial year of the two date columns is matching (say April-March and not Jan-Dec).
-
Change the default fiscal year starting month from the default properties of the date column.
-
Now use the Datetrunc function or directly check for Years match.
Use cases :
Similar inefficiencies can be observed while writing Sales comparison KPIs across date ranges such as MTD & YTD(YTD stands for Year To Date and MTD stands for Month To Date). Many tableau developers still use today() to define the date comparison metrics, or they use an input date parameter. When today’s date is used as the reference then all MTD values become 0 when the user changes the date range to the previous month.
The ideal situation is to let the user select any date range and automatically update the calculations - metrics such as MTD need to be dynamic based on max date selected. This can be solved by getting the max date in data e.g. max_date = {Max(Sales_date)}. And then define all your YTDs & MTDs based on max_date.
Let us now move to what makes the YTD metric interesting! The YTD calculation depends on the start of a fiscal year. Different countries might have different FY beginnings which can be any month such as January, April,December. etc.
Implementation Steps :
- In order to simplify the YTD metric computations, the first step is to pass the information to tableau what’s the fiscal year in a particular scenario.
- Simply right-click on the data source and click on the Date Properties option in the dropdown (alternatively we can also right-click on the concerned date column from the dimensions pane).

- Next, change the fiscal year start as per the requirement.

Toggle Functionality Using Parameters
Explainer :
A lot of times we need to see our values in different ways in the same view, for example viewing sales with tax and without tax, or we need to see a whole different measure in the same chart like sales or profits or targets and so on. These are the places where the toggle functionality using parameters in Tableau comes in handy.
Use cases :
- Based on user input show all sales values either with tax or without tax in the entire dashboard.
- Allow users to switch between whether they want to view the top 10 products by sales or by profit.
- Allow the user to see the same sales chart by Region or by Channel (extending toggle functionality to Dimensions - we can toggle X axis of charts, we can toggle columns in a tabular chart, etc.).
Implementation Steps :
We’ll see how to do so by toggling our views between sales with and without tax.
- Create a parameter for toggling the views.

- Create a calculated field for the sales value that informs Tableau what to do when one of the above parameters is selected

- Use the new sales field created in step 2 to make your chart and choose the switch between the parameter values to use it as a toggle button.

Rank Preserver
Explainer :
Ranking basically means giving something a position as per some measure value against it. Normally to give ranks in tableau, we make a simple calculated field ‘RANK(SUM([measure value]))’ or ‘INDEX()’ and bring this into view to see the rank of each value against it.
Now, normally when we filter out some rows in tableau, the rank gets recalculated every time as per the new data which is visible in our view and hence it starts again from 1 and goes till n number as per the values. This method is good when we want the rank to get recalculated every time a filter is applied. But, what if we want to see the global rank of a value?
Use cases :
Ranking of Sales staff in the entire organization and the ranking information should be correct even when any filters are applied on the data. Similarly, when we are ranking stores of a company. For example, we have a dataset of all our stores in the world as they are ranked as per the sales value they make. A country filter is now being applied to these stores. Let’s say Store A is located in India and as per the global world rank, it’s in the 5th position but in India, it is in the 1st position. Filtering the stores as per India will give Store A rank 1 in this situation, although its global rank is 5.
Implementation Steps :
In order to avoid the issue and preserve the rank 5, we need to trick Tableau's order of operations. In our situation, the country is a dimension filter which is being applied on the data and rank is a table calculation. The reason why rank gets calculated every time a filter is applied is because as per the order of operation, the dimension filter gets applied first and then table calculations happen. So every time I apply my country filter, the rank gets calculated again as per the stores in the filtered country and it’s sales value.
- We need to make our dimension filter into a table calc filter. To do this, we will simply make a calculated field ‘LOOKUP(MIN([dimension]),0)’ (in this case our dimension is country).
- The next step is to use the above-calculated field as your filters instead of the country filter.
- Now, our rank is always calculated first and then the filter is applied which basically preserves our global rank.
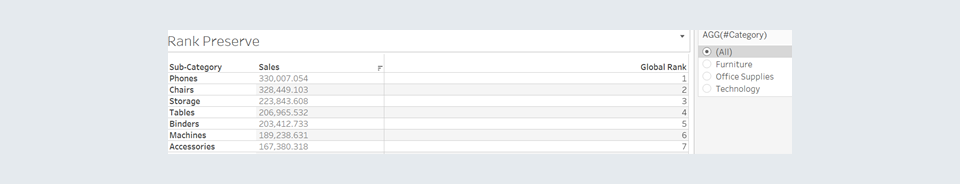
- You can see how the rank does not change in the next image when I apply my table calc filter.

Additional Information :
Refer to this blog by Ken Flerlage to understand Tableau’s Order of Operations in detail - click here.
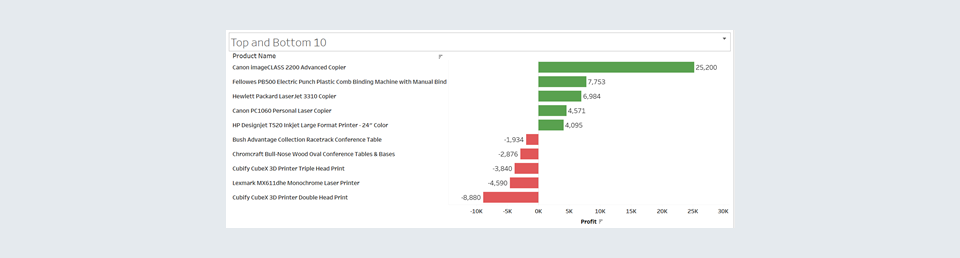
Explainer :
A lot of times, our end users would want to see their top and bottom performers simultaneously in the same chart. Normally, developers are used to displaying only one of the categories at a time in one chart.
Use cases :
Common use cases are to see the best & worst Sales performers, best & worst Stores etc. The broad theme being that the end user wants to focus on the outliers or exceptions and hence getting the top and bottom performers in one chart helps focus on getting the relevant information quickly.
Implementation Steps:
- Create a calculated field ‘Size’ - SIZE() (Size function is used to return the number of rows in a partition).
- Create a calculated field ‘Index’ - INDEX() (This is used to return the index of the current row in the partition).
- Create a calculated field ‘Top/Bottom’ as below. You can change the number to anything. We’re showing only top and bottom 5 products.

- Put your required dimension in rows (Product Name in this case), measure value in rows (profit in this case) and put the above calculated field in the filters card and only select Top and bottom.

- The below view is what you will get at the end, which will show you your top and bottom N products simultaneously.