Online marketing has become a core part of the marketing strategy and it is expected that the new media channels of the day will continue to grow in importance.
Website Analytics helps in understanding the effectiveness of online marketing strategy of the company. Finding the right strategy and tailoring it to suit the company’s needs at the best price is important.
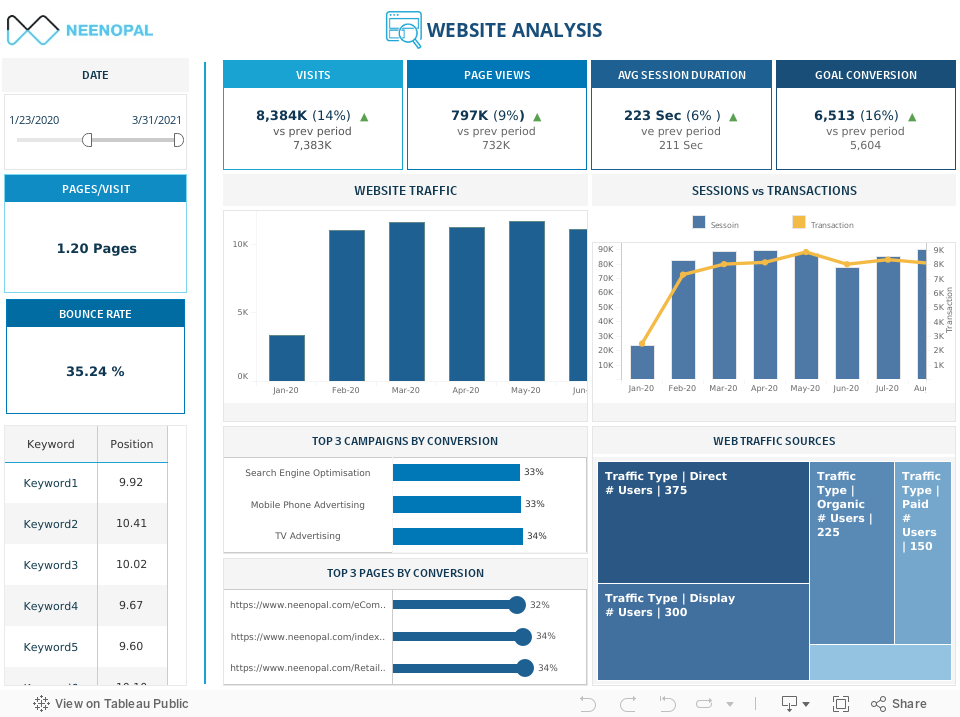
The website analysis dashboard helps business monitor the traffic and talks more about the following core aspects that decides the success of current online marketing strategy:
- Effectiveness of Ad campaigns.
- To discover the sources that generate traffic to website.
- To track the conversion rate against visits over time.
- To know the customer behaviour on website.
- To assess the quality of website.
- To identify strong traffic driving keywords.
Key Terms:
- Whenever an individual arrives at the website, it is considered as a visit. Even when the same person visits again, it will be counted as the “next” visit.
- Page view tells about the interaction of a visitor with the website. It is the number of pages viewed by visitors on the website.
- Goal Conversion happens when visitors of the website complete a goal (pre set task). Goals need to be set by the business prior.
- Average session duration gives the length of the visit of the user and a low value indicates the website could hold the user's attention.
- Pages per visit gives the number of pages viewed during a visit by the user, helps in assessing the content and ease of access of the website. Higher value of this measure shows a higher user engagement with the site.
- Bounce Rate is the percentage of single page site visits. Bounce rate is not just useful for measuring user engagement, it also helps in understanding when problems exist in the website end.
- Traffic to the website can be mainly from four sources - Direct (users who enter URL directly), Organic (via non-paid results on search engines), Paid (via paid search ads), Display (Traffic sent from Display and Video ads).
|
Goals |
Questions to ask |
Dashboard views |
|---|---|---|
|
To discover the sources that generate traffic to website |
Which channel generates maximum traffic to the website and which the least? |
Web Traffic Sources |
|
To identify strong traffic driving keywords |
Which are the top keywords used by target customers? |
Keyword position table |
|
To track the conversion rate against visits over time |
How are visits, transactions and revenue from the latter changing with time? |
Sessions versus Transaction graph |
|
To know the customer behaviour on website To assess the quality of website |
Is the customer happy with the website – design and content? Which are the pages that made maximum conversion? |
Pages/ Visit Avg Session Duration Top 3 pages by conversion |
|
Effectiveness of Ad campaigns |
Which are the top 3 campaigns that had brought the highest conversion? |
Top 3 campaigns by conversion |
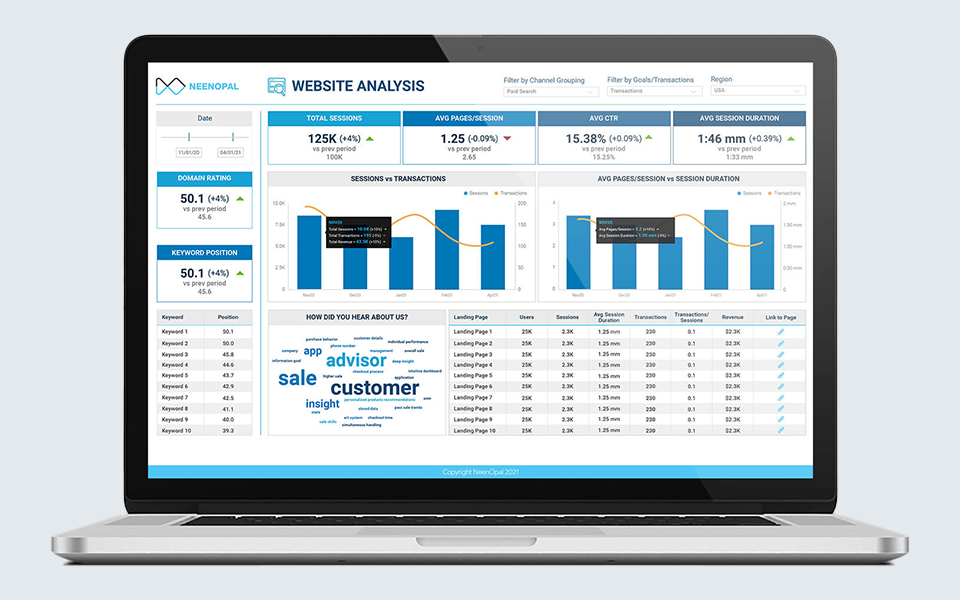
- The Web Traffic Sources tells about the channel sources that have generated the traffic.This could help in deciding which channel needs more focus and how further marketing plans should be.
- Understanding the top keywords and modifying the website content to accommodate them is important to drive organic traffic. Also, customers often skim through the website and decide to stay on it after seeing the keywords they used for the search.
- Traffic to the site is given by the number of visits, i.e., sessions. The session vs transaction graph gives a clear picture on how many sessions get converted to transactions over time.
- Identifying the most effective campaigns is important for designing future campaigns that could attract more conversions.
- An abnormally high bounce rate is considered a warning that people are leaving the website fast and should be an indicator to check the content and design of the website.
KPIs
- Visits & Page Views.
- Average Session Duration.
- Goal Conversion.
- Pages/Visit.
- Bounce Rate.
- Website traffic.
- Sessions vs Transactions.
- Web Traffic Sources.
- Keyword Position.
- Campaign Rating.
Conclusion
Increasing engagement and conversions is the major goal behind websites. The above analysis helps in analysing the past steps taken towards this goal, thus giving the company a clear picture on the areas to focus for future growth.