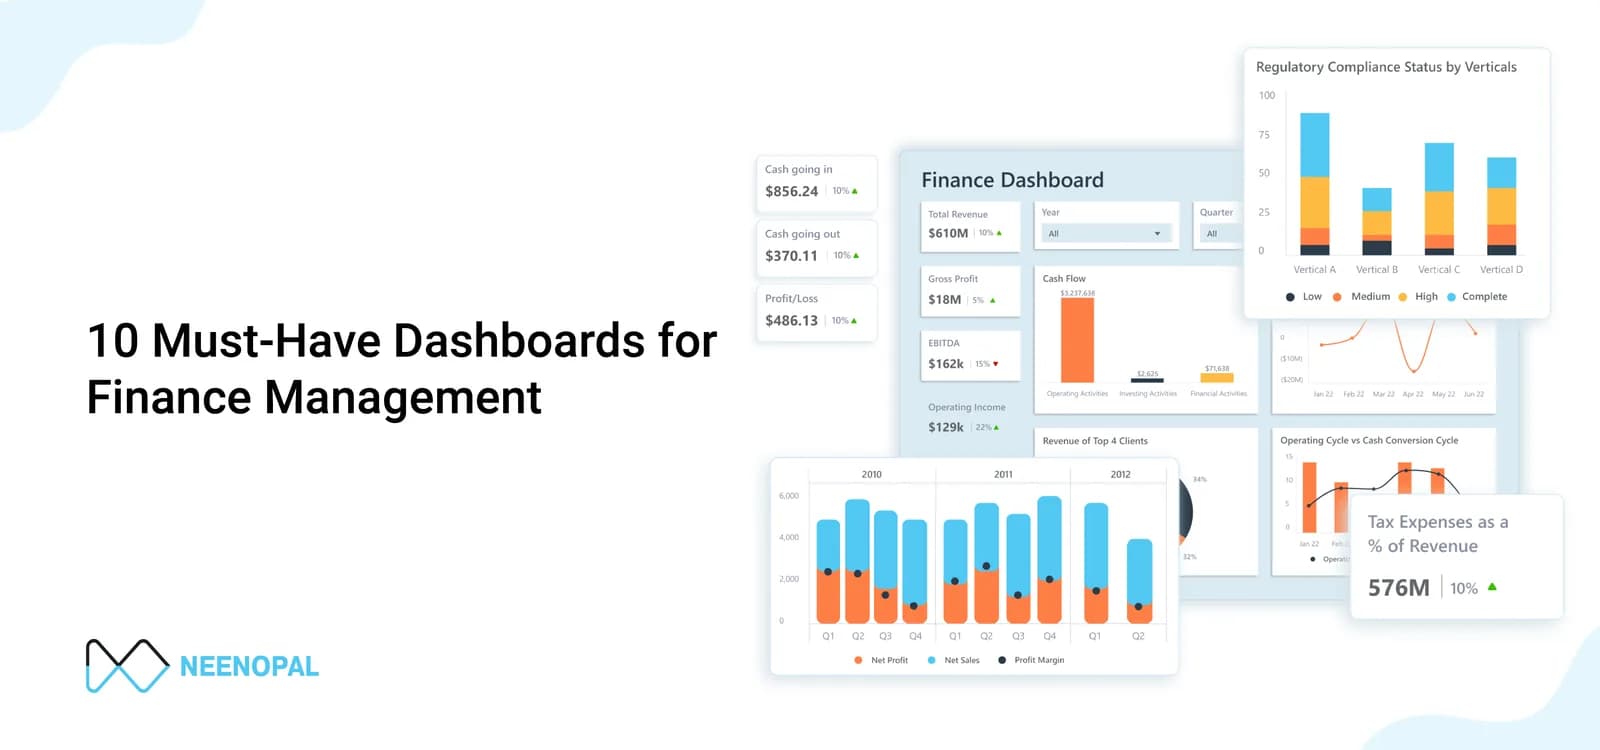
- Checklist
- Business Intelligence
Complete Business Intelligence (BI) Checklist for Successful Implementation: Free Download
Client dashboards are daily decision systems that guide marketing spend, inventory levels and multimillion‑dollar investments. A single mishandled null, silent field rename or row‑count mismatch can undo months of relationship‑building. Under aggressive timelines, quality checks become person‑dependent and data errors slip out of development: a common risk across data visualization and dashboards, regardless of the BI platform used.
What a flawed dashboard can cost

Marketing misspend
An attribution‑logic error in an e‑commerce dashboard shifted ad budget to low‑performing channels and cost an estimated $500 000 in potential revenue in a single quarter. Mission‑critical reporting needs reliable BI dashboards in Power BI or Tableau.

Inventory inefficiencies
Inconsistent demand forecasts in a retailer’s supply‑chain dashboard caused stock‑outs of popular items and overstock of slow movers, cutting annual profitability by roughly $1 million: the cost of not using a modern data visualization tool to its full capability.
Investment mistakes
Inaccurate risk assessments in a financial‑services dashboard masked portfolio vulnerabilities, leading to losses in the tens of millions when market conditions shifted. Even on robust platforms like Tableau and Power BI, the underlying logic has to be right.
Key Sections of the Business Intelligence Checklist
Consulting firms need a repeatable, audit‑ready quality‑assurance framework, not another heroic bug‑fix. The Business‑Intelligence Checklist puts controls for every phase of dashboard development into one template, whether you deploy on Tableau Cloud, Power BI Service or both. Knowing the difference between Power BI and Tableau, or comparing Power BI visualization vs Tableau features, also helps teams pick the right stack. It has four sections:

Managerial Inputs
Establishes the foundation before development begins
- Define project criticality and sign off on the authoritative source of truth
- Document null‑handling rules, KPI logic, and wireframes
- Record scope trade‑offs driven by budget constraints
Data‑Validation Cuts
Heart of the QA process
- Perform row‑count and KPI checks at multiple granularities (totals, time slices, source‑system filters, etc.) to catch discrepancies high‑level totals miss
Pre‑Deployment Build Review
Ensures technical hygiene
- Verify correct tables and field‑naming conventions
- Flag and resolve any ad‑hoc renames
- Maintain consistency for easier long‑term maintenance
Deployment & Governance
Guarantees smooth rollout and ongoing management
- Validate user permissions and Row‑Level Security (RLS)
- Confirm stakeholder communication and update documentation
Who Will Benefit from This Checklist
 Dashboard Developers
 Business Analysts
 Data Engineers
 QA Teams Analytics
 BI Consultants
Conclusion
A robust checklist, granular validation and a culture of shared responsibility significantly improve the accuracy of your dashboards and bring the 99% target within reach. Whether your team uses Power BI Tableau integrations or compares features across Tableau and Power BI, consistent quality checks remain key.
Our clients





















Download Your Free BI Checklist
Fill in your details to get instant access to our comprehensive Business Intelligence checklist.
More free resources
Playbooks, whitepapers and checklists from our BI and data teams.