
Overview
Based in Chicago, the client is a leading integrative healthcare provider offering holistic, patient-centered care across multiple clinics in the Chicagoland area. Their services include chiropractic care, acupuncture, functional medicine, and nutrition counseling, with a strong focus on non-surgical and non-pharmaceutical treatments. As the organization expanded, financial reporting remained largely manual and spread across QuickBooks Online modules, limiting real-time visibility into performance across clinics.
95%
Faster Financial Report Generation
100%
Reduction in Manual Data Extraction
8–12
Hours Saved Per Week
Customer Challenges
While the client had a mature and modern approach to patient care, their financial reporting and analytics processes were largely manual. Critical financial data was housed within QuickBooks Online and spread across multiple modules, limiting visibility and making it difficult to generate timely, consolidated insights across clinics. As the organization continued to grow, leadership needed a more reliable and scalable way to monitor financial performance and support informed decision-making.

Fragmented Financial Data
Financial information was distributed across various QuickBooks modules, preventing a unified view of organizational performance.

Manual Reporting Dependencies
Heavy reliance on manual data exports and transformations increased the risk of errors and inconsistencies in financial reporting.

Limited Real-Time Insight
Leadership lacked continuous visibility into cash flow, profitability, and overall financial health, slowing strategic responses.

Lack of Standardized Dashboards
There was no consistent set of financial dashboards for Profit & Loss, Balance Sheet, Cash Flow, or custom performance metrics.

Scalability Constraints
With multiple clinics and ongoing expansion, existing reporting processes were not designed to handle growing data volumes efficiently.
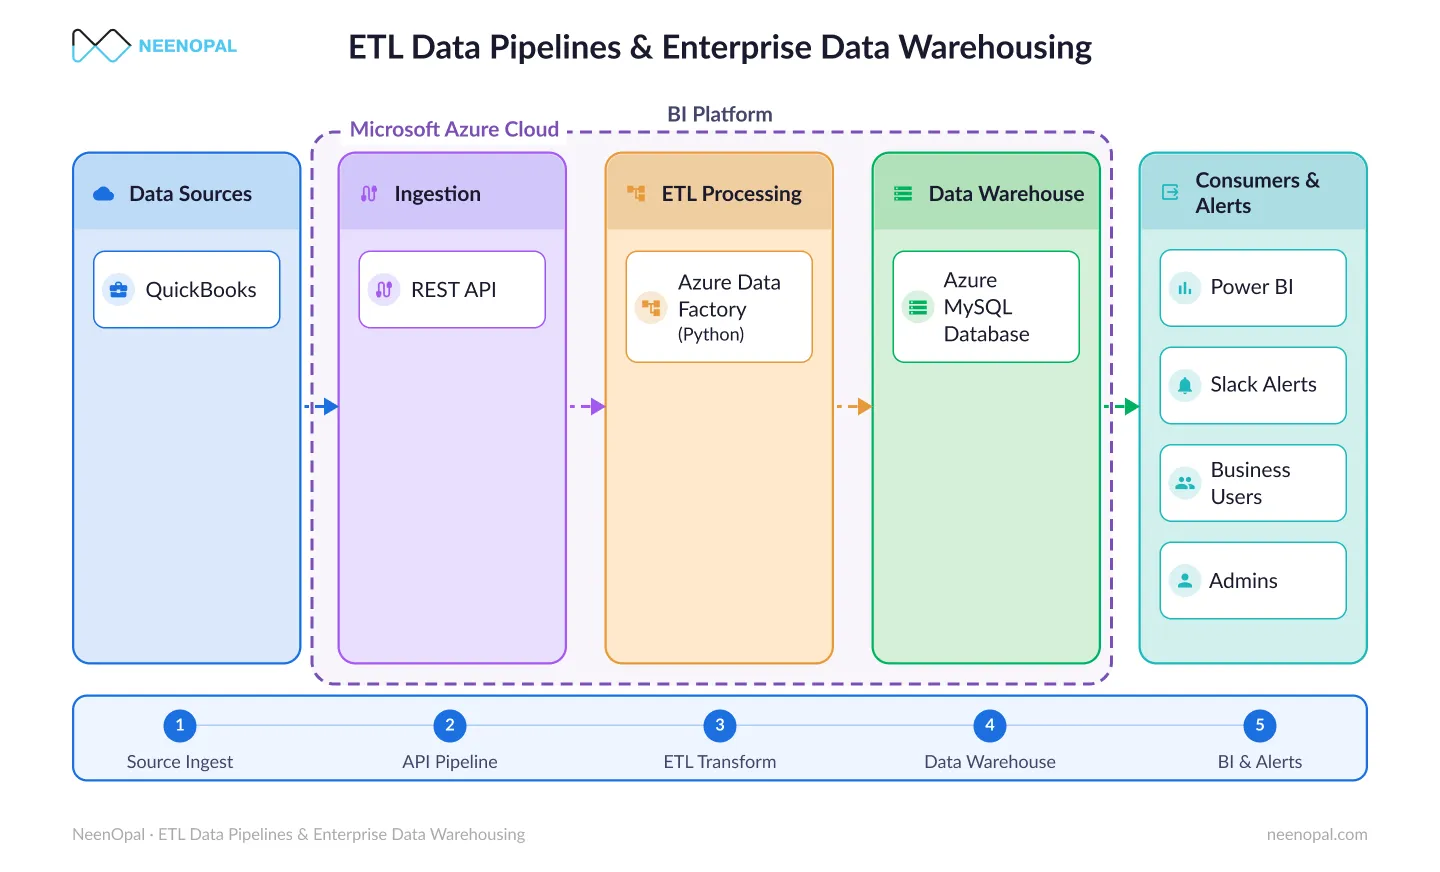
Automated Financial Analytics Architecture
This architecture illustrates how financial data from QuickBooks Online flows through Azure Data Factory into Microsoft Azure SQL Database, and is visualized in Microsoft Power BI to enable automated reporting and real-time financial insights.
Solutions
We designed and implemented an automated, cloud-based data pipeline using the Microsoft Azure ecosystem. The solution prioritized simplicity for business users while ensuring enterprise-grade security, reliability, and scalability.
01.
Automated Data Ingestion
Azure Data Factory was used to securely connect with the QuickBooks API and automatically ingest financial data into the cloud, removing all manual intervention.
02.
Centralized Financial Repository
All financial data was consolidated into an Azure SQL Database, creating a single, secure source of truth across clinics and financial modules.
03.
Operational Monitoring & Alerts
Integrated Slack alerts provided real-time notifications for pipeline failures or delays, enabling quick resolution and ensuring data reliability.
04.
Analytics & Reporting Layer
The curated data was connected to Power BI, where a set of five interactive dashboards was developed. These dashboards presented Profit & Loss, Cash Flow, and other financial metrics through intuitive visuals, replacing spreadsheet-based reporting.
Transform Financial Reporting with Scalable Data Analytics
Get StartedServices


Benefits

Real-Time Financial Visibility
Leadership gained access to always-on dashboards, providing up-to-date insights into profitability and cash flow.

Significant Time Savings
Automating the ETL process reduced manual effort for the finance team, allowing them to focus on analysis and strategic planning.

Improved Data Accuracy
Automated pipelines eliminated manual errors and established a consistent, reliable financial reporting foundation.

Proactive Operations
Slack-based monitoring shifted the organization from reactive troubleshooting to proactive pipeline management.

Scalable Architecture
The Azure-based solution was designed to easily accommodate additional clinics and growing data volumes without rework.
Conclusion
By modernizing their financial data flow and integrating QuickBooks Online with Azure’s analytics ecosystem, the client transformed a manual reporting process into a reliable, scalable, and insight-driven operation. The automated pipeline not only streamlined finance workflows but also delivered clear, visual visibility into the organization’s financial health. With this robust data foundation in place, the client is now well-positioned to support continued growth while staying focused on delivering exceptional, holistic care to their patients.
FAQ
Here are some common questions about automating financial reporting and building scalable analytics solutions using cloud platforms like Microsoft Azure and Microsoft Power BI.
How can healthcare organizations automate financial reporting?
Healthcare organizations can automate financial reporting by integrating accounting platforms like QuickBooks Online with cloud data pipelines using Azure Data Factory and visualization tools such as Microsoft Power BI.
Why is real-time financial visibility important for multi-clinic healthcare providers?
Real-time financial visibility helps leadership track profitability, monitor cash flow, and quickly identify performance trends across clinics, enabling faster operational and strategic decisions.
What are the benefits of centralizing financial data in the cloud?
Centralizing financial data in platforms like Microsoft Azure creates a single source of truth, improves data accuracy, and enables scalable analytics as organizations grow.
How do Power BI dashboards improve financial decision-making?
Interactive dashboards in Microsoft Power BI present key financial metrics such as Profit & Loss, cash flow, and budget comparisons in real time, allowing leaders to make faster, data-driven decisions.
Authors

Contact Us
We’d love to hear from you.
Lets discuss how we can transform your business with AI. Talk to our AI expert team. Lets do AI journey together.