

Overview
Our client, the leading independent promoter of live entertainment in North America, partnered with NeenOpal to transform its data visualization and reporting capabilities. Specializing in comedy, festivals, and music, our client sought to leverage data from its entertainment events to drive strategic decision-making, optimize operations, and enhance client services.
100+
Key Active User Events Tracked
20+
Key Performance Metrics Analyzed
5
Custom Interactive Dashboards
< 1 min
Instant Real-Time Data Refresh
Customer Challenges
Our client encountered significant challenges in managing and analyzing data from its diverse entertainment events. Key issues included:

Data Silos
The client transitioned to Amazon QuickSight and AWS infrastructure to centralize scattered data and gain a unified view of key performance metrics. This shift leveraged AWS's scalability, security, and advanced analytics, enhancing operational efficiency with cutting-edge cloud solutions.

Inconsistent Metrics
Different stakeholders used varied approaches to analyze event performance, leading to inconsistencies in reporting and hindering collaboration across teams.
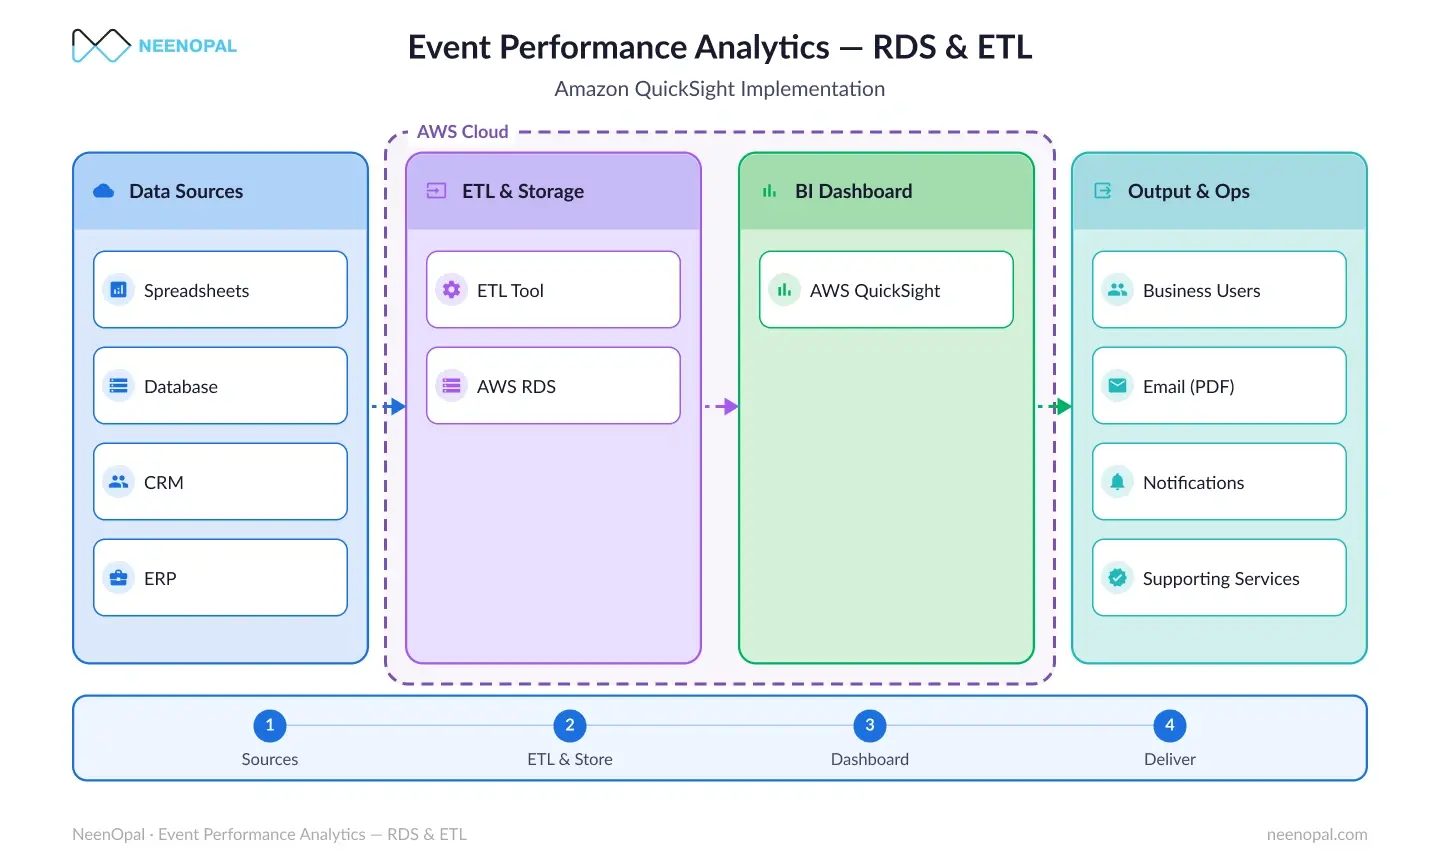
From Event Data to Real-Time Intelligence
Architecture built to unify event, ticketing, and financial data into scalable, analytics-ready dashboards with instant performance insights.
Solutions
To overcome the challenges faced by our client, NeenOpal implemented a robust, end-to-end data management and visualization strategy:
01.
Centralized Data Infrastructure
Amazon RDS with SQL Server was used to consolidate data from multiple sources, ensuring secure, centralized, and scalable data storage.
02.
Streamlined Data Transformation
Custom ETL pipelines were designed to automate the extraction, transformation, and loading of data. Sophisticated logic, including dynamic calculations based on show status (past, ongoing, or future), enabled accurate insights into budgeted and forecasted metrics.
03.
Powerful Business Intelligence Dashboards
A suite of Amazon QuickSight dashboards was developed to meet diverse operational requirements. These dashboards delivered dynamic visualizations, covering profit and loss metrics, artist performance trends, venue analytics, and marketing insights. With real-time updates and interactive controls, stakeholders gained immediate access to actionable insights.
04.
Strategic Use of Color and Layout
A carefully curated color palette was applied to distinguish key metrics, highlight trends, and segment data effectively. This approach ensured clarity, allowing users to easily identify actionable insights. Typography and layout were meticulously optimized for professional readability, enabling a polished presentation that enhanced user engagement and decision-making capabilities. The inclusion of table-like visuals formatted in a Landscape A4 style further catered to the CXO office, facilitating traditional print-based review in meetings.
05.
Interactive Features
Advanced interactive features such as filters, drill-down capabilities, and real-time data updates were integrated, enabling users to explore crucial metrics dynamically. Stakeholders could analyze ticket sales, artist performance, and financial trends with tailored views, providing granular and flexible insights. Additional on-screen controls, including sliders for dynamically adjusting show P&L metrics, further empowered users to interact with data intuitively and extract precise, meaningful information.
06.
Automation for Consistent Delivery
By leveraging the Amazon QuickSight Scheduler, dashboards were automated for timely delivery to designated stakeholders. This ensured consistent access to critical insights without manual intervention, streamlining decision-making processes and enhancing operational efficiency.
07.
Scalability and Efficiency
The serverless, pay-as-you-go approach facilitated seamless scalability, allowing our client to adapt to evolving requirements without the burden of infrastructure management. The dashboards were built to handle growing data loads, providing reliable and efficient insights even as the business scaled operations.
08.
Comprehensive Insights Across Dashboards
The dashboards ranged from daily P&L recaps to show summaries, YTD reviews, and marketing team reports. They provided in-depth insights into key areas like unprofitable shows, artist performance, venue analytics, city-wise trends, and genre segmentation. Users could drill down from high-level overviews to detailed metrics, ensuring a holistic understanding of business performance.
09.
Pixel-Perfect Reports
Reports were designed for pagination, dynamically spreading across multiple A4 pages to meet printing requirements. This ensured the dashboards were not only digitally effective but also practical for offline and physical review.
Ready to turn your event data into real-time, actionable business intelligence?
Book a CallServices


Benefits

Improved Responsiveness
Access to real-time data enabled faster, more informed decision-making, significantly improving the organization’s ability to adapt to emerging trends and market opportunities.

Enhanced Efficiency
Automated workflows and streamlined data processes reduced manual effort, improved accuracy, and minimized delays, ultimately optimizing operational performance.

Unified Reporting
Standardized data handling and visualization methods provided consistency across teams, fostering better collaboration and alignment of strategic goals.
Conclusion
This collaboration streamlined our client's data management and analytical processes, setting a new benchmark for integrating live event data with cloud-based BI tools. NeenOpal's tailored approach has empowered our client to leverage advanced analytics, positioning them as a leader in the live entertainment industry.
Authors


Contact Us
We’d love to hear from you.
Lets discuss how we can transform your business with AI. Talk to our AI expert team. Lets do AI journey together.