

Overview
A U.S.-based market research and consulting firm generating large volumes of survey and analytical data faced growing complexity in managing its analytics environment due to extensive calculations and numerous dashboards. NeenOpal addressed this by implementing an optimized architecture using Amazon QuickSight and a redesigned data pipeline, simplifying the framework while preserving deep research insights.
99.85%
Reduction in Calculated Fields
95.00%
Improvement in Dashboard Performance
96.88%
Reduction in Dashboards
Customer Challenges
The client was developing a highly complex analytics environment constrained by excessive calculated fields and dashboard proliferation intended to present complex research insights across multiple variables and segments. However, the existing approach created several structural, performance, and scalability limitations.

Excessive Calculation Complexity
Due to the structure of the underlying dataset, a very large number of calculated fields were required within the visualization layer to generate the desired analytical outputs. The initial design required approximately 49,200 calculated fields and 66 dashboards, significantly increasing system complexity and quickly reaching the platform limits of Amazon QuickSight, including 200 calculated fields per dataset, 500 per analysis, and a maximum of 50 visuals per sheet with 20 sheets per analysis. Additionally, replicating full analyses and dashboards across multiple workspaces and tenant environments was not feasible at this scale, making it necessary to fundamentally redesign the analytics architecture.

Fragmented Reporting Experience
The analytics environment required numerous dashboard pages to display all insights. This fragmented structure reduced usability and made it difficult for stakeholders to navigate and interpret research findings efficiently.

Dataset Structure Constraints
The original dataset recorded each analytical variable in separate columns. This structure significantly increased the computational load within the visualization layer, as many transformations and calculations had to be performed directly within the dashboard environment.

Performance Bottlenecks
The combination of large datasets and extensive calculation logic created performance challenges, leading to slower dashboard rendering and reduced responsiveness during analysis.

Difficulty Achieving the Intended Dashboard Design
Because of these architectural constraints, the organization struggled to implement a dashboard layout that fully aligned with their intended analytical vision.
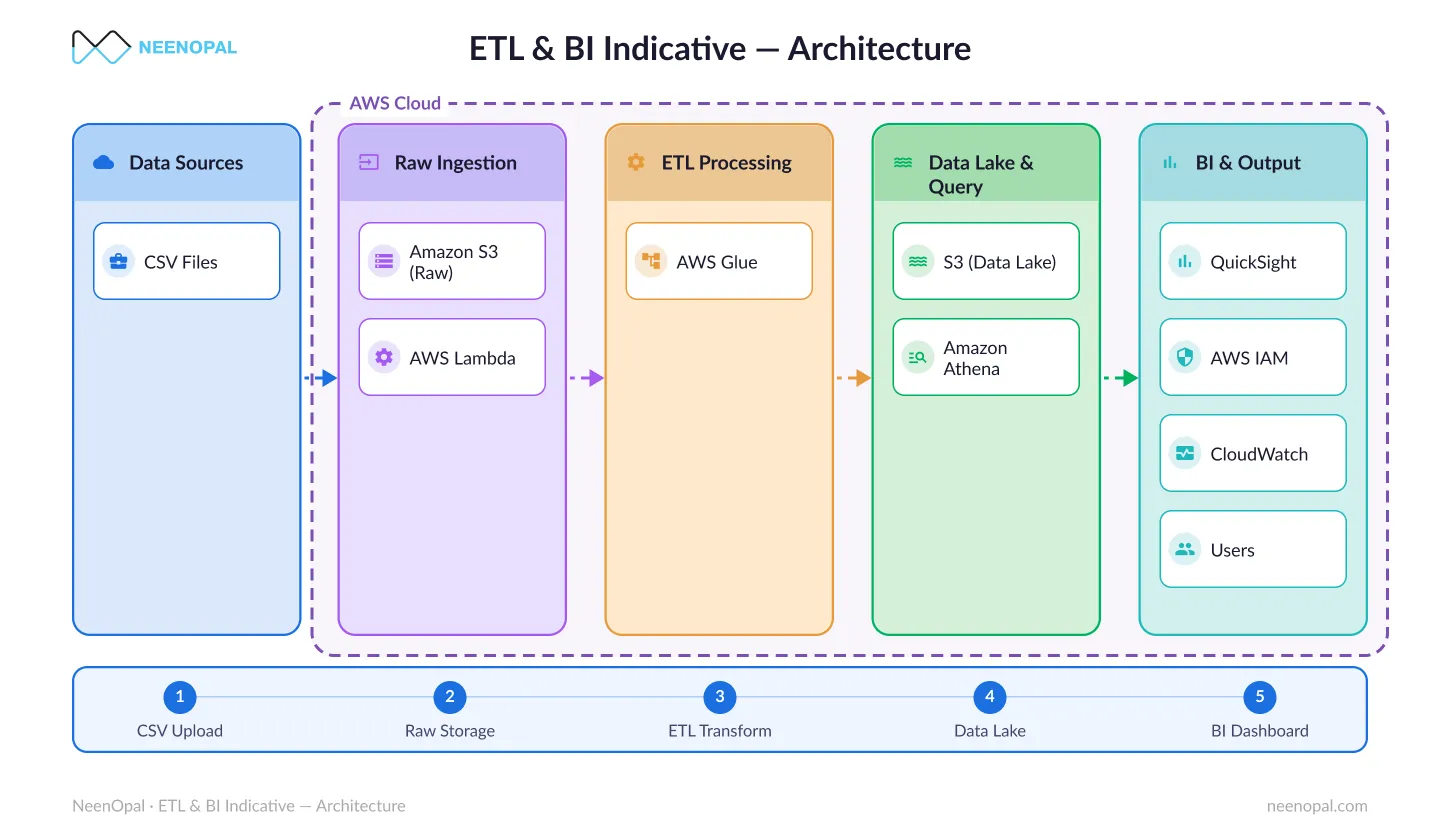
Optimized Analytics Architecture
This architecture shows how NeenOpal streamlined the data pipeline using Apache Spark, Amazon S3, Amazon Athena, and Amazon QuickSight to reduce dashboard complexity and improve performance.
Solutions
NeenOpal designed and implemented a streamlined analytics architecture using AWS QuickSight, focusing on simplifying the data model, optimizing the calculation framework, and redesigning the dashboard structure. The solution introduced a preprocessing pipeline to restructure the dataset before it entered the visualization layer. By shifting transformation logic upstream and implementing a more efficient visualization strategy, the system was able to deliver the same analytical outputs with significantly fewer calculated fields and dashboard pages. This architectural redesign dramatically improved performance, maintainability, and user experience while preserving the analytical depth required for research reporting.
01.
Data Model Optimization using PySpark
The original dataset structure stored each analytical variable in a separate column, which required a significant amount of transformation logic to be implemented within the dashboard layer. To address this issue, NeenOpal implemented a PySpark-based transformation pipeline to restructure the dataset prior to visualization. The data was transposed and reorganized into a more analysis-friendly format, enabling variables to be processed more efficiently within the analytics framework. The processed datasets were then written directly into Amazon S3, creating a scalable and centralized storage layer for the research data. By shifting data restructuring into the preprocessing stage, the solution significantly reduced the computational burden within the dashboard environment.
02.
Scalable Query Layer using Amazon Athena
To enable efficient querying of the transformed datasets, Amazon Athena was implemented as the query engine between Amazon S3 and the visualization layer. This allowed the team to run SQL queries directly on data stored in S3 without additional database infrastructure, creating a cost-efficient and scalable query layer. It also helped work around Amazon QuickSight SPICE and direct S3 datasource limits, enabling faster solution replication across multiple tenant environments while maintaining strong dashboard performance.
03.
High-Density Dashboard Architecture with Interactive Controls
The original dashboard design treated each individual table cell as a separate KPI element within AWS QuickSight. This approach significantly increased both the number of calculated fields and the number of dashboards required to present the insights. NeenOpal redesigned the dashboard architecture by introducing a tabular visualization structure combined with dynamic filter selections and custom QuickSight actions. The tabular layout enabled multiple metrics and analytical variables to be displayed within a single interface. Interactive filters allowed users to dynamically select variables, segments, and research perspectives. In addition, custom dashboard actions were implemented to trigger contextual changes in visualizations based on user selections. This allowed stakeholders to explore multiple analytical scenarios without navigating across numerous dashboard pages. This optimized design consolidated insights into fewer dashboards while significantly improving dashboard responsiveness and overall usability.
Turn complex analytics into simple insights with NeenOpal
Get StartedServices


Benefits

Significant Reduction in Calculation Complexity
Through data model optimization and improved dashboard design, the number of calculated fields required within the analytics environment was reduced by 99.85%, dramatically simplifying dashboard maintenance.

Consolidated Reporting Framework
The redesigned dashboard architecture reduced the number of dashboards required by 96.88%, enabling stakeholders to access research insights through a streamlined and intuitive reporting interface.

Improved Dashboard Performance
By shifting heavy data transformations to PySpark and leveraging Athena for query execution, the solution minimized complex calculations within the visualization layer, resulting in significantly improved dashboard responsiveness.

Enhanced Analytical Usability
The tabular dashboard structure combined with dynamic filters and custom actions allowed users to explore research insights interactively without navigating across multiple dashboard pages.
Conclusion
By redesigning both the data architecture and the visualization framework, NeenOpal transformed a highly complex analytics environment into a streamlined and scalable reporting solution. Through the implementation of PySpark-based data transformations, Amazon S3 storage, Athena-powered querying, and optimized AWS QuickSight dashboards, the solution significantly reduced system complexity while preserving the full analytical capabilities required for research reporting. The final architecture delivered a 99.85% reduction in calculated fields and a 96.88% reduction in dashboards, resulting in improved performance, simplified maintenance, and a more efficient analytics experience for stakeholders.
FAQ
Here are some common questions about simplifying complex analytics environments and optimizing dashboards using Amazon QuickSight and other Amazon Web Services data services.
How can complex analytics dashboards be simplified?
Complex dashboards can be simplified by restructuring the data model, shifting heavy data transformations to preprocessing layers like Apache Spark, and optimizing the visualization layer to reduce excessive calculated fields and dashboard pages.
Why use Amazon Athena in an AWS analytics architecture?
Amazon Athena allows organizations to run SQL queries directly on data stored in Amazon S3, enabling scalable and cost-efficient analytics without managing additional database infrastructure.
What causes performance issues in BI dashboards?
Performance issues often arise from large datasets, inefficient data models, and excessive calculated fields processed within the dashboard layer instead of being handled earlier in the data pipeline.
How can AWS QuickSight dashboard performance be improved?
Performance can be improved by optimizing datasets, reducing calculation logic in the visualization layer, leveraging efficient query services like Amazon Athena, and consolidating dashboards using interactive filters and actions.
Authors

Contact Us
We’d love to hear from you.
Lets discuss how we can transform your business with AI. Talk to our AI expert team. Lets do AI journey together.