
Overview
Our client, a Seattle-based leading firm in employee scheduling software, specializes in shift-based workforce scheduling solutions. Their platform helps businesses streamline scheduling, adapting smoothly to changing demands. With NeenOpal’s expertise, they wanted to consolidate data from multiple sources including Salesforce, Quickbooks into Azure SQL database, offering clear visual insights for smarter decision-making and optimizing workforce scheduling.
12%
Increase in the customer retention rate
80%
Reduction in time for converting data to Insights
~60
Hours/month saved by automating reports
Customer Challenges
As data volume and complexity increased, the organization’s Excel based reporting struggled to keep up, causing inefficiencies and gaps in insights. Here’s an overview of the key issues:

Data Consolidation Issues
Data was distributed across platforms like CRM, accounting tools, and HRMS, creating silos that made it difficult to get a comprehensive view of operations. Consolidating this information in Excel was time-consuming, prone to manual errors, and led to inconsistent and conflicting data across different sources.

Lack of Real-Time Insights
The current system lacked support for real-time data updates from various sources, resulting in outdated, static reports that didn’t capture current business conditions. This gap delayed the identification of operational issues, limiting the organization’s agility in making timely and informed decisions.

Complexity in Data Visualization
Excel’s basic charting capabilities limited the ability to visualize complex data in a way that was meaningful and actionable for stakeholders. Creating interactive dashboards or advanced visualizations, such as drill-downs and heat maps, required extensive manual effort and workarounds, limiting the ability to explore data dynamically. This approach made it difficult to identify trends, patterns, and outliers, leading to suboptimal data-driven strategies and decisions.

Manual Data Handling and Reporting
Routine reporting operations for report production - data collection, cleaning, transforming and creating visuals in excel, required a large amount of manual labor, which took up valuable time and resources. Manual data handling increased the possibility of human error, which led to inaccurate reports and inconsistent insights. The repetitive nature of manual reporting methods hampered the organization's ability to carry out more complex analysis and strategic tasks.

Scalability Challenges
As the organization grew, so did the complexity of data management and reporting, pushing Excel's scalability to its limits. The absence of a scalable data infrastructure limited the organization's ability to extend its analytics capabilities to accommodate new data sources and larger data volumes. The current system's limitations created bottlenecks, preventing the organization from leveraging data as a strategic asset to its full potential.
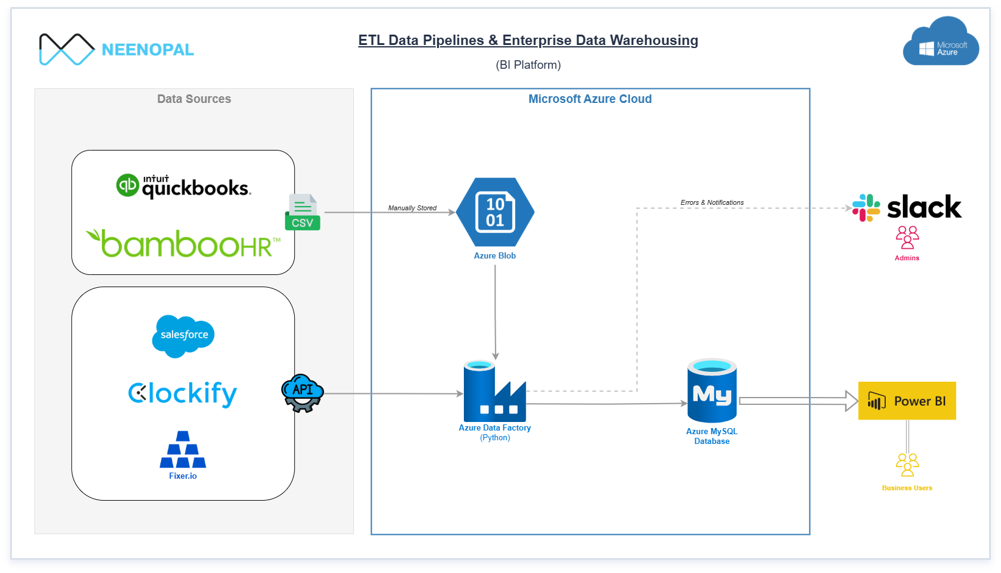
End-to-End Azure Data & Power BI Architecture
A unified Azure data pipeline integrating multiple sources into SQL, transforming data, and delivering real-time insights through interactive Power BI dashboards.
Solutions
NeenOpal aimed to consolidate data from multiple platforms into a single system for better decision-making and insights. Here’s how we built the solution:
01.
Cloud Data Architecture Setup Using Microsoft Azure Cloud Services
A scalable cloud architecture was built using Azure tools - Data Factory, SQL Database, and Power BI. It integrates various data sources - Salesforce, Quickbooks, BambooHR, and Clockify into a unified view, with Azure SQL Database serving as the organization’s single source of truth for accurate, consistent reporting.
02.
Data Integration Using Azure Data Factory
NeenOpal implemented seamless data pipelines with Azure Data Factory, automating data integration from multiple cloud and on-premises sources while eliminating manual collection. The solution supports both real-time data for immediate insights and batch processing for scheduled updates, offering flexible data workflows. Built-in data validation checks ensure that only clean, high-quality data enters the Azure SQL Database, minimizing errors and maintaining data accuracy.
03.
Data Pre-Processing and Transformations
As data enters the central repository, it’s cleansed and transformed to rectify errors, fill missing values, and ensure consistency. Azure SQL Database uses stored procedures for data transformations, applying business rules, currency conversions, KPI (Key Performance Indicator) calculations, and metric aggregation to prepare data for analysis.
04.
Data Enrichment
To enhance the value of the consolidated data, additional data sources, such as currency conversion rates, economic indicators, and market trends, were integrated. This enrichment allows for more comprehensive financial analysis and benchmarking.
05.
Empowering Senior Leadership with Visual Insights Through Power BI Dashboards
Customized Power BI dashboards were created for different roles, including leadership, managers, and analysts, offering each user group specific metrics tailored to their responsibilities. Key metrics covered include sales performance, marketing performance, customer insights, and financial performance. Users can interact with the data through filters and drill-downs to gain deeper insights and quick analysis. Automated reporting and alerts ensure that critical metrics are regularly monitored, keeping stakeholders updated on any significant changes.
Ready to move beyond spreadsheets?
Book a CallServices


Benefits

Scalability and Flexibility
Provide the organization the ability to seamlessly expand and adapt to evolving data requirements, ensuring long-term viability and growth. The solution ensures that as the organization’s data grows, performance remains optimal without the need for hardware upgrades.

Seamless Data Integration
Simplifies and automates the process of integrating and combining data from various sources into a unified central repository. This scalable solution easily adapts to an organization's expanding and evolving data sources.

Empowered Decision-Making
Power BI dashboards serve as decision-making tool, converting complex data sets into actionable business insights, thereby fostering a culture of informed and data-driven decision-making within the organization.

Improved Data Accuracy and Consistency
Eliminate data silos and inconsistencies across multiple spreadsheets by consolidating and organizing data into a single, centralized repository, ensuring accuracy, improving workflows, and reducing redundancy and duplication.

Enhanced Collaboration and Advanced Data Visualization
Power BI offers collaborative features for secure sharing of dashboards and reports. Users can access and interact with data anytime, filtering and drilling down for detailed insights.

Enhanced Reliability and Security
Provides benefits such as high availability and disaster recovery, data security, and compliance ensuring reliability and security. The solution also includes the possibility of incorporating AI into insight generation in the future.
Conclusion
NeenOpal's expertise combined with Microsoft Azure's powerful capabilities transformed fragmented data into meaningful insights for the client. Advanced data pipelines and rigorous pre-processing provided high-quality data for analysis. Power BI dashboards provided senior executives with real-time visual insights, hence improving decision-making. This solution resolved immediate challenges while also providing a scalable framework for future growth, putting the organization on track for long-term success and increased efficiency.
FAQ
Key insights into data consolidation, real-time reporting, and scalable BI infrastructure.
How did Microsoft Azure improve workforce scheduling data management?
Microsoft Azure helped centralize data from Salesforce, QuickBooks, BambooHR, and Clockify into a unified Azure SQL Database. Using Azure Data Factory, automated data pipelines eliminated manual data collection, ensured validation checks, and supported both real-time and batch processing. This created a single source of truth, reduced errors, and significantly improved reporting efficiency and decision-making.
Why was Excel no longer suitable for the company’s reporting needs?
As data volume and complexity grew, Excel-based reporting became time-consuming, error-prone, and difficult to scale. It lacked real-time updates, advanced visualization capabilities, and automated data workflows. The shift to Azure and Power BI enabled scalable infrastructure, interactive dashboards, automation, and faster insight generation.
What measurable business impact did the Azure and Power BI solution deliver?
The implementation delivered a 12% increase in customer retention, reduced the time required to convert data into insights by 80%, and saved approximately 60 hours per month through automated reporting. As a result, leadership gained faster access to reliable insights, enabling quicker decisions while cutting down operational inefficiencies.
Authors


Contact Us
We’d love to hear from you.
Lets discuss how we can transform your business with AI. Talk to our AI expert team. Lets do AI journey together.