
Overview
Our client, a managed technology services provider (MSP), partnered with NeenOpal to replace a fragmented, siloed reporting process with a centralized Power BI dashboard environment. Business-critical data was scattered across multiple disconnected systems, from the CRM and PSA to the service desk, client surveys data, and network monitoring tools, leaving leadership without a single view of sales, customers, operations, or the workforce. NeenOpal designed and delivered a centralized Power BI reporting solution that unifies data from all of these sources into an automated, daily-refreshed analytics layer on AWS. By ingesting each source, staging it in a PostgreSQL warehouse, and modeling it into governed Power BI dashboards across every business function, the team turned manual, spreadsheet-bound reporting into interactive, self-service insight the client can filter and act on in seconds.
8
Business Systems Unified into One Reporting Platform
11
Interactive Dashboards Delivered Across Every Function
360°
Customer View From Pipeline to Health Score
Customer Challenges
Before engaging NeenOpal, the client's data lived in isolation across many best-of-breed platforms, and the absence of a unified layer made it hard to see the full picture of the business or act on it quickly.

Data Siloed Across Eight Disconnected Systems
Sales, service, project, network, and workforce data lived in separate platforms including Salesforce, Autotask, Halo ITSM, SimpleSat, Monday.com, Auvik, Microsoft Teams, and Google Sheets. Because each system reported in isolation, cross-functional analysis was impossible and no single source of truth existed.

Heavy Manual Reporting and Spreadsheets
Reporting depended on manual exports and disconnected spreadsheets, which was slow and error prone. Teams spent time compiling data by hand rather than analyzing it, and business users had little time to work through each system to understand what was happening.

No Centralized Warehouse or Consistent KPIs
The client had no centralized data warehouse and no consistent KPI definitions across systems, so metrics could not be compared reliably from one function to the next. This made confident, data-driven decisions difficult and left performance signals easy to miss.

Evolving Requirements and Reliable Daily Refresh
Integrating data from eight systems while defining KPI logic with stakeholders was a persistent challenge, made harder by frequent requirement changes as the business refined what it needed to measure. Every dashboard also depended on source systems being updated correctly, so keeping the daily refresh accurate required close coordination with the client.
Centralized Power BI Reporting on an AWS Data Layer
Solutions
NeenOpal delivered a centralized Power BI reporting solution that unifies every business system into one governed analytics layer, then built interactive dashboards for each function. The engagement combined a repeatable AWS data pipeline with a suite of role-specific dashboards designed to give every team a clear, current view of performance.
01.
Workforce and Marketing Reporting (HR PTO, Excel and Google Sheets)
The HR PTO Dashboard analyzes employee leave balances, PTO utilization, approvals, and workforce availability drawn from resourcing data. NeenOpal also produced Excel-based marketing expense charts and Closed Won performance charts for business reporting, with these moving toward fully interactive Power BI dashboards as the engagement continues.
02.
Unified AWS Data Pipeline Across Eight Sources
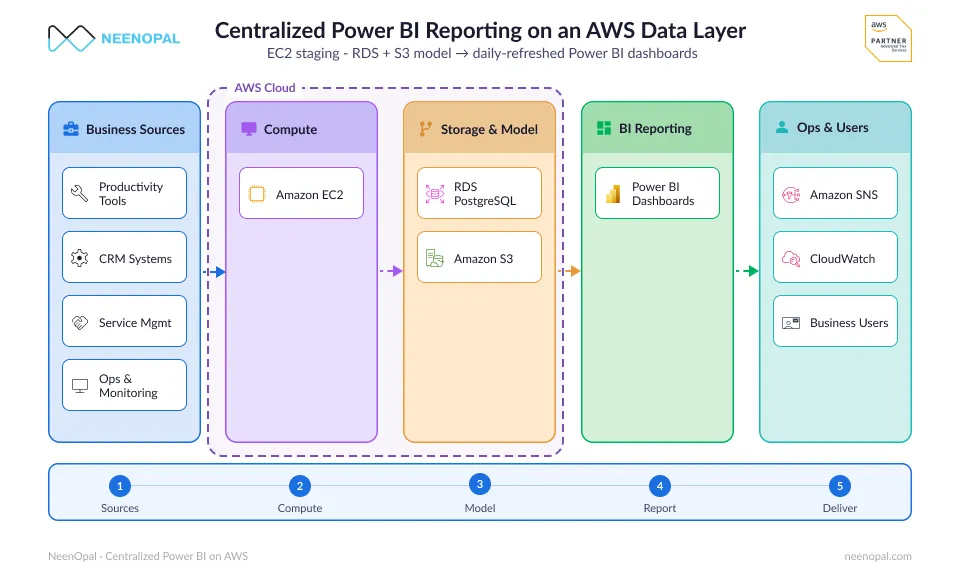
NeenOpal built an AWS-based data pipeline that ingests data from all eight systems, stages it in an RDS PostgreSQL warehouse with S3 storage, runs on EC2 compute, and uses SNS for pipeline notifications. SQL transformations standardized and modeled the data into Power BI tables, and a daily refresh kept every dashboard current without manual re-exports.
03.
Sales Pipeline and Revenue Analytics (Salesforce)
Using Salesforce pipeline data covering opportunities, accounts, leads, contacts, and activities, NeenOpal delivered a full suite of sales dashboards. The Sales Funnel Dashboard visualized the end-to-end pipeline and stage-wise conversion to expose bottlenecks, while the Sales Open Opportunity Dashboard analyzed active opportunities, pipeline value, ownership, and rep performance. The Sales Open Opportunity Trend Dashboard tracked how the pipeline shifted over time, the Sales Closed Opportunity Dashboard measured won and lost deals, revenue realization, and closure performance, and the Quota vs Attainment Dashboard compared sales targets against actual achievement.
04.
Customer Success and Health Scoring (Autotask, Halo ITSM, SimpleSat, Salesforce)
Drawing on Autotask PSA data, Salesforce data, Halo ITSM service-desk activity, SimpleSat CSAT surveys and Google Sheets the team built a Customer Success Dashboard to monitor new engagement, renewals, and customer success metrics. NeenOpal also developed a Customer Health Scoring Dashboard, defining the business logic and scoring models that classify customers into distinct health categories so the client can act on at-risk accounts early.
05.
Microsoft Teams Communications Analytics
NeenOpal is designing and developing the Microsoft Teams Analytics Dashboard, an ongoing workstream that surfaces call quality, user activity, Auto Attendants, Call Queues, PSTN usage, Direct Routing, and wider communication KPIs. This gives the client operational visibility into how efficiently its voice and communications environment performs.
06.
Project Delivery and Network Operations (Monday.com, Auvik)
Using Monday.com data, the Project Management Dashboard monitors project progress, milestones, task ownership, timelines and delivery status. Alongside it, the Auvik Reporting Dashboard turns network monitoring data covering devices, alerts, uptime, and performance into operational and business metrics the client can track at a glance.
Unify Every Business System into One Dashboard
Get in touchServices


Benefits

Automated, Daily-Refreshed Reporting
Automated ingestion and a daily refresh removed the repetitive effort of compiling spreadsheets by hand. Teams now access continuously updated insight instead of reconciling exports, freeing them to focus on decisions rather than data preparation.

Full-Funnel Sales Visibility
The suite of Salesforce dashboards gave the client end-to-end visibility into the pipeline, from open opportunities and trends to closed deals and quota attainment. Leaders could identify bottlenecks, monitor rep performance, and forecast with confidence from one place.

Proactive Customer Success and Health Scoring
By combining PSA, service-desk, and CSAT data, the customer success and health scoring dashboards helped the client classify accounts by health and act on risks early. This shifted customer management from reactive to proactive and supported stronger retention.

Faster, Self-Service Decisions
Interactive cross-filtering let any user drill into performance by date, owner, or business dimension in seconds. Board-ready dashboards and reliable KPI tracking meant leaders could answer their own questions on the spot instead of waiting on manually built reports.

Single Source of Truth Across Eight Systems
Unifying Salesforce, Autotask, Halo ITSM, SimpleSat, Monday.com, Auvik, Microsoft Teams, and Google Sheets into one centralized Power BI environment gave leadership a single, trusted view of the business. Metrics could finally be compared consistently across sales, service, projects, and operations.
Conclusion
With NeenOpal's support, the client transformed a siloed, spreadsheet-bound reporting process into a centralized Power BI reporting solution that unifies eight business systems. By ingesting every source into an AWS pipeline built on EC2, RDS PostgreSQL, S3, and SNS, modeling it with SQL, and delivering interactive dashboards across sales, customer success, operations, communications, and HR, NeenOpal replaced fragmented data with a single, interactive source of truth. The result is faster decisions, consistent KPI tracking, and a scalable analytics foundation that continues to expand across the organization as new reporting needs emerge.
FAQ
Common questions about centralized Power BI dashboards and unifying business systems
What is a centralized Power BI dashboard, and why unify multiple business systems?
A centralized Power BI dashboard consolidates data from many separate systems into one governed, automatically refreshed analytics environment. Organizations unify siloed platforms like a CRM, PSA, service desk, and project tools into it to gain a single source of truth, compare KPIs consistently, and let teams explore performance interactively instead of manually reconciling exports from each system.
How does the AWS data pipeline unify sources like Salesforce, Autotask, and Microsoft Teams?
Data from each system is ingested into an AWS pipeline that stages it in an RDS PostgreSQL warehouse with S3 storage, runs transformations on EC2 compute, and uses SNS for pipeline notifications. SQL then models the combined data into Power BI tables, and a daily refresh keeps every dashboard current, so sales, service, and communications data can be analyzed together in one place.
What is a customer health scoring dashboard?
A customer health scoring dashboard applies business logic and scoring models to signals such as engagement, adoption, support activity, and satisfaction to classify customers into health categories. This helps a managed services provider identify at-risk accounts early and prioritize retention efforts before issues escalate.
Authors




Contact Us
We’d love to hear from you.
Lets discuss how we can transform your business with AI. Talk to our AI expert team. Lets do AI journey together.