

Overview
A leading DEI consultancy was struggling with slow, outdated reporting systems, scattered data sources, and a lack of scalability. Their legacy database caused delays in processing survey data, leading to stale insights and a heavy manual reporting burden. NeenOpal’s Implementation Division stepped in to address these challenges by developing an Inclusive Leadership Index (ILI) dashboard using Tableau and AWS.
98.6%
Data Processing Time Reduction
24 Hours
Reporting Time Improvement
30-40%
Reduction in Infrastructure & Ops Costs
100+
Concurrent Complex Report Generations
70%
Faster Feature Deployment
60%
Less Time on Manual Tasks
Customer Challenges
The client’s legacy systems were unable to keep up with the growing complexity of their Inclusive Leadership Index (ILI) data. Inefficient data flows, slow reporting, and scalability issues made it difficult to deliver timely, actionable insights to their customers:

Integration & Insight Gaps:
Organizations struggled with disjointed data flows, legacy reporting structures, and inefficient integration of survey data from multiple sources. Customers required a unified, real-time solution that combined detailed demographic analyses with a transparent ETL process, enabling quick decision-making and actionable insights.

Data Latency and Stale Insights
The client's previous data infrastructure suffered from significant latency, meaning that newly collected survey data and assessment results were not immediately available for analysis. This delay led to insights that were often outdated by the time they reached decision-makers, hindering agile responses to evolving client needs and market trends.

Manual Reporting Burden
Prior to our intervention, the generation of complex reports on inclusive scores, ratings, and competencies was an arduous, manual process. This required significant human effort to extract, consolidate, and transform data from various disparate sources, leading to high operational costs and a substantial drain on consultant time. The labor-intensive nature of their reporting limited the volume and sophistication of analyses they could offer, directly affecting their service delivery capacity.

Scalability Limitations & Growth Hindrance
The existing infrastructure was inherently rigid and lacked the elasticity required to scale with the client's rapidly expanding global operations and increasing data volumes. This limitation manifested in frequent system slowdowns and an inability to onboard new clients or integrate additional data sources without extensive, costly, and time-consuming manual interventions. This bottleneck actively impeded their strategic growth initiatives and competitive positioning.
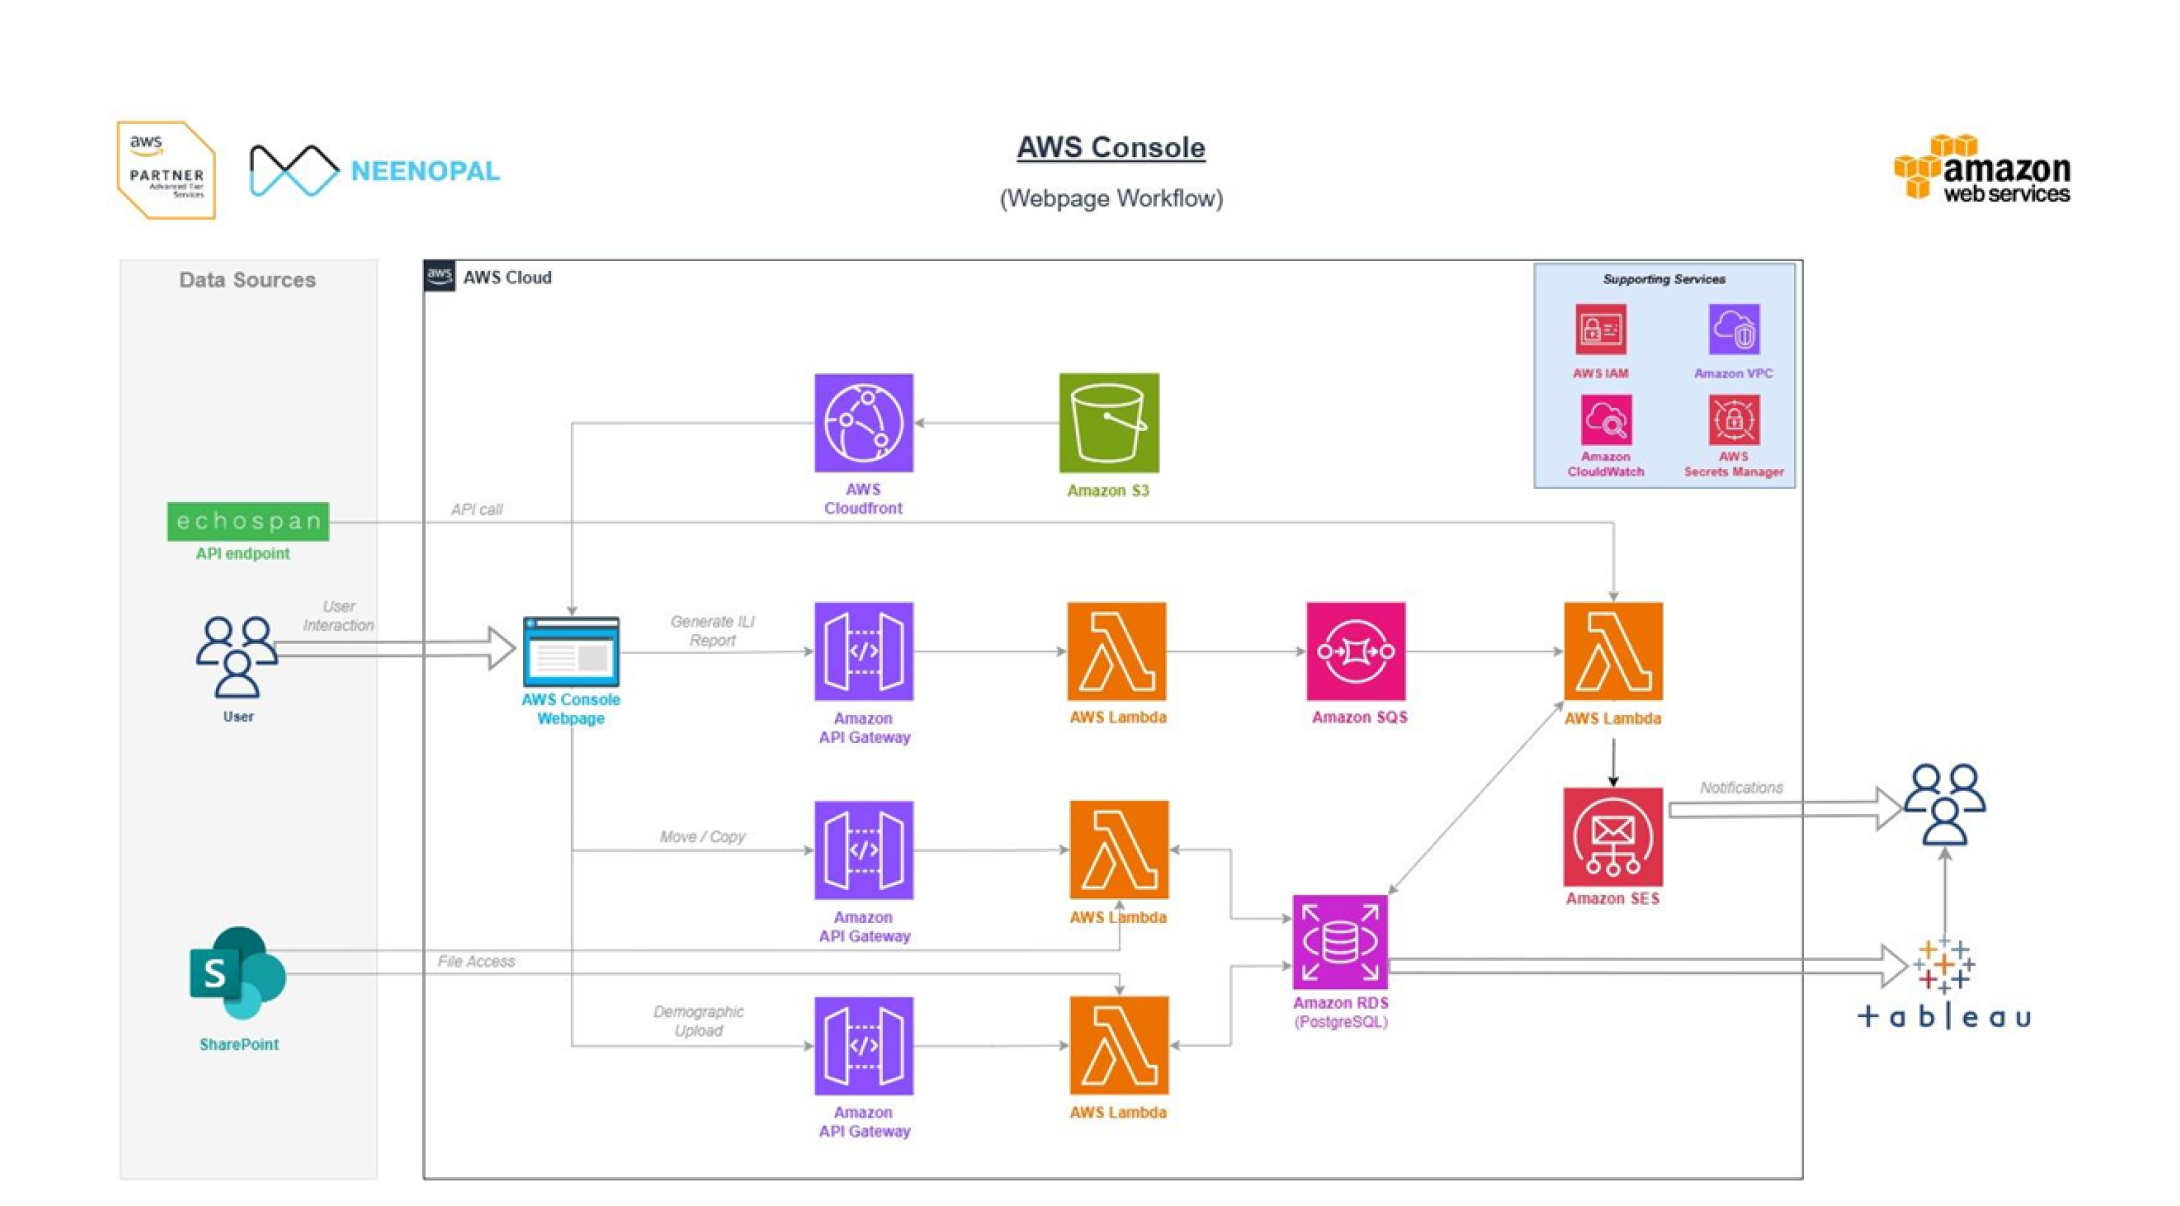
Scalable Analytics & Dashboard Architecture
A cloud-based framework leveraging AWS Lambda and Tableau to automate data processing and deliver scalable, real-time insights through interactive dashboards.
Solutions
To overcome these challenges, NeenOpal implemented a robust, cloud-based data infrastructure designed for scalability, automation, and real-time insights. The solution combined advanced AWS services with Tableau integration to create a seamless reporting and analytics ecosystem.
01.
Database Migration with Blue-Green Deployment
We meticulously planned and executed a zero-downtime migration of the client's outdated database to a modern, high-performance AWS RDS (Relational Database Service) instance. By employing a blue-green deployment strategy, we created an identical "green" environment on AWS while the "blue" legacy system continued to operate. This approach allowed us to test the new database and applications in a live environment without disrupting ongoing operations. Additionally, we implemented robust data validation and reconciliation processes to ensure 100% data integrity, minimizing the risk of corruption or service interruptions and ensuring smooth business continuity.
02.
Scalable Data Pipelines on AWS
We developed robust automated data pipelines leveraging AWS Lambda to handle large volumes of complex survey data efficiently. These pipelines seamlessly ingested raw data from multiple external survey APIs and the ILI assessment platform. We established a scalable data lake architecture to store raw and processed datasets, offering a flexible and cost-effective foundation for current and future analytics needs. Using serverless ETL (Extract, Transform, Load) processes with Lambda, we cleaned, transformed, and enriched the disparate datasets into a unified, analysis-ready format, ensuring the data was accurate, consistent, and easily accessible across all systems.
03.
Advanced Reporting & Analytics Platform
We designed and implemented a reporting layer to generate multi-dimensional reports with deep analytical insights. These included breakdowns of inclusive scores by demographics, organizational units, and leadership levels, along with benchmarking against industry standards and historical data. Competency mapping reports highlighted strengths and improvement areas at both the individual and team levels. We integrated the processed data with Tableau to enable interactive dashboards and visualizations. Finally, we equipped the client’s team with self-service analytics tools and practical training, empowering them to perform ad-hoc analysis and build custom reports without depending on manual support.
Turn Complex Data into Scalable, Actionable Insights with Tableau and AWS Expertise
Talk to an ExpertServices


Benefits

Unprecedented Data Accessibility
Transformed fragmented data into a unified, accessible resource, providing a single source of truth for all client and survey data.

Real-time Data Insights
Enabled the client to move from delayed, batch reporting to real-time, actionable insights, empowering their consultants to provide immediate value to clients.

Enhanced Client Reporting
Elevated the quality and depth of client reports, offering sophisticated analyses of scores, ratings, and competencies previously overlooked.

Operational Efficiency
Drastically reduced manual effort in data handling and report generation, freeing up valuable resources for strategic initiatives.

Future-Proof Scalability
Established a highly scalable and flexible data infrastructure capable of supporting the client's aggressive growth plans and future service expansions.
Conclusion
The client solution seamlessly combines advanced data visualization with a robust AWS-based data pipeline. It enables dynamic, real-time reporting on inclusive leadership while ensuring high data quality and efficient operations. This integrated setup helps organizations use data effectively for continuous improvement and strategic planning.
FAQ
Find answers to common questions about building a scalable analytics dashboard with AWS and Tableau.
What challenge was the client facing?
The client struggled with manual reporting processes and limited scalability in delivering DEI analytics insights.
What solution did NeenOpal implement?
NeenOpal built a scalable dashboard solution using AWS Lambda for automated data processing and Tableau for interactive reporting.
What were the key outcomes?
The solution improved reporting efficiency, enhanced data accuracy, and enabled scalable, real-time insights for better decision-making.
Authors


Contact Us
We’d love to hear from you.
Lets discuss how we can transform your business with AI. Talk to our AI expert team. Lets do AI journey together.