

Overview
Our client, a leading solar energy company in the USA, uses advanced technology to improve efficiency and decision-making. After being acquired by a parent company using Tableau, they needed to migrate all reports from Power BI to Tableau. They also faced challenges in tracking the usage and adoption of both new and existing dashboards and needed a solution to monitor these metrics effectively.
80+
Dashboards migrated from Power BI to Tableau
80%
Quicker delivery time of the dashboards
95%
Increment in the overall usage adoption
Customer Challenges
The challenges appeared mostly during the transition of their reporting from Power BI to Tableau following the acquisition by a parent company that relied extensively on Tableau. Additionally, several critical issues emerged that required immediate resolution:

Migration from PowerBI to Tableau
The client needed to migrate over 80 dashboards from Power BI to Tableau within a tight deadline but lacked in-house expertise to handle the process efficiently. This transition was further complicated by inconsistencies in KPIs and non-standardized dashboard designs, which undermined trust in internal reporting and made it difficult to deliver accurate insights.

Track Adoption and Usage of Dashboards
The lack of a centralized system for monitoring dashboard usage and adoption resulted in inefficiencies. The client struggled to monitor real-time consumption, identify inactive users whose licenses should be revoked to save money, and determine which dashboards were published in specific projects. Navigating the huge number of dashboards across several projects further increased the issue.

Security and Access Threats
The client encountered difficulties in managing and assigning permissions within Tableau Cloud, raising concerns about potential data leaks and privacy violations. These issues posed significant risks, including exposing sensitive information, leading to compliance breaches, and increasing the likelihood of data tampering or loss.
Solutions
To address the challenges, NeenOpal utilized its expertise in both Power BI and Tableau to ensure a smooth transition and optimize the client's reporting structure. By focusing on streamlining dashboards, improving adoption tracking, and enhancing security, we delivered comprehensive solutions tailored to meet their specific needs.
01.
Streamlining dashboards from Power BI to Tableau
NeenOpal’s certified Power BI and Tableau consultants successfully migrated over 80 dashboards from Power BI to Tableau. To ensure a seamless and efficient transition without any reporting downtime, we developed a step-by-step migration checklist. We worked closely with stakeholders to align on KPI definitions, ensuring consistency across all dashboards, and incorporated an info button to clearly define each KPI. Additionally, we created a standardized design template and checklist to maintain uniformity in the dashboards' design and layout.
02.
Created Administrative Views from Admin Insights Data
We used Admin Insights data sources to build Tableau dashboards for tracking workbook and user activity details. These dashboards played a crucial role in identifying underutilized dashboards, strategizing ways to increase their adoption, and pinpointing unused Tableau licenses to optimize costs effectively. Additionally, we developed a user-friendly landing page using the site content data source, enhancing navigation capabilities across the dashboard environment for users. Key metrics tracked included the most visited dashboard in the last 90 days, least used dashboard in the last 90 days, and users' last login date.
03.
Resolving Security and Access Threats
To enhance security for Tableau Cloud dashboards, we implemented multi-factor authentication (MFA) and strict access controls. We organized dashboards into a hierarchical project structure by department (e.g., UAT → Marketing → Marketing Spend Dashboard). Specific user groups were assigned access to these projects, ensuring appropriate permissions. For dashboards used across multiple departments, we structured projects accordingly (e.g., UAT → Enterprise → Sales Incentive Dashboard) and employed Row-Level Security (RLS) to limit unauthorized access. The dashboards were tracked using administrative views to spot any unauthorized access.
Power BI to Tableau Migration Services by NeenOpal for Modern, Scalable Enterprise Reporting
Start MigrationDashboard Demos
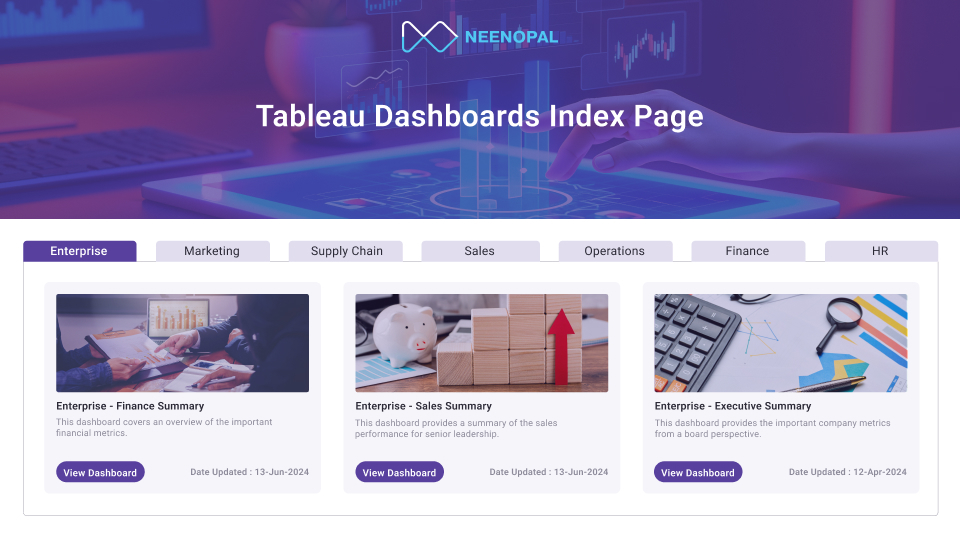
Data & Analytics Landing Page
The landing page is designed to provide the solar company with quick access to vital data and analytics. A user-friendly interface allows for seamless navigation and effective decision-making. It provides:
- Organized dashboard categories and folders for structured navigation.
- Clear item names and descriptions for quick understanding.
- A “Date Updated” field to highlight the most recent data.
- A “Go to Report” button for instant access to detailed reports.
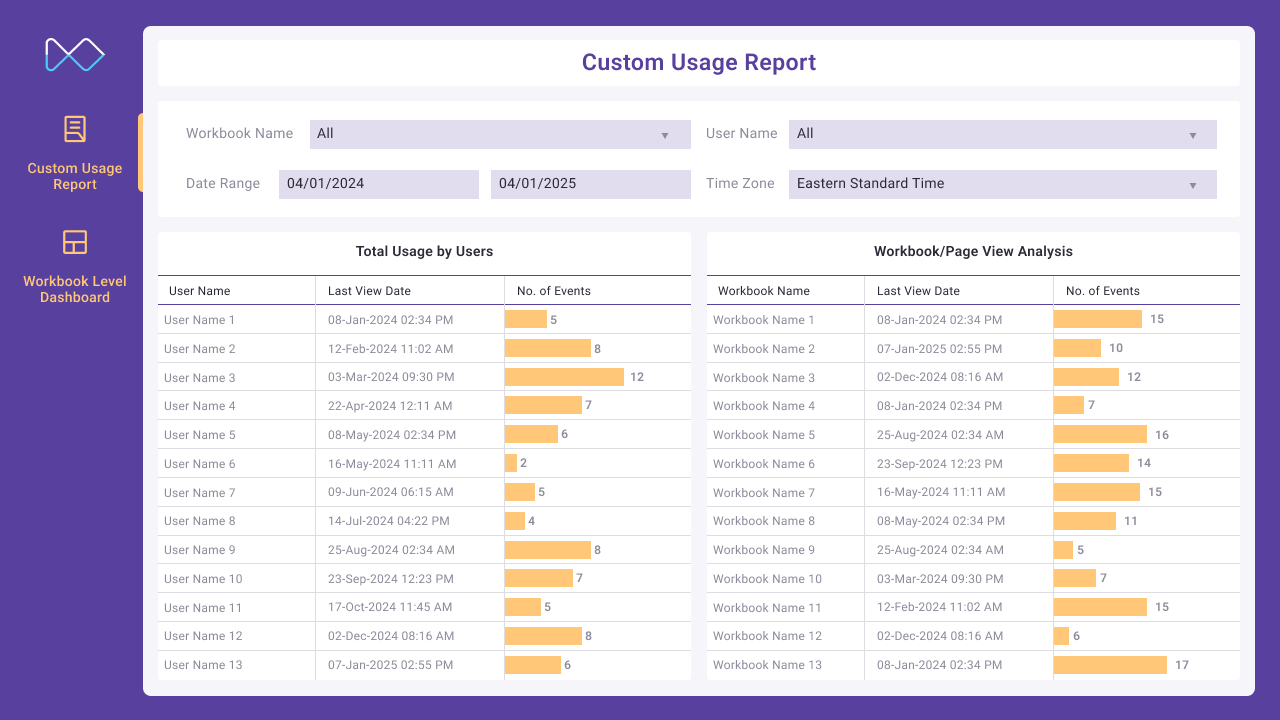
Custom Usage Report
The Custom Usage Report provides multiple administrative views using admin insights data to monitor dashboard activity effectively. Key features includes:
- Tracking the most used and least used dashboards for better resource allocation.
- Monitoring users' last login dates to identify activity patterns.
- Identifying dormant users to optimize licensing and reduce costs.
- Offering a centralized view of dashboard activity levels for administrative efficiency.
- Enabling data-driven decisions to improve overall dashboard utilization.
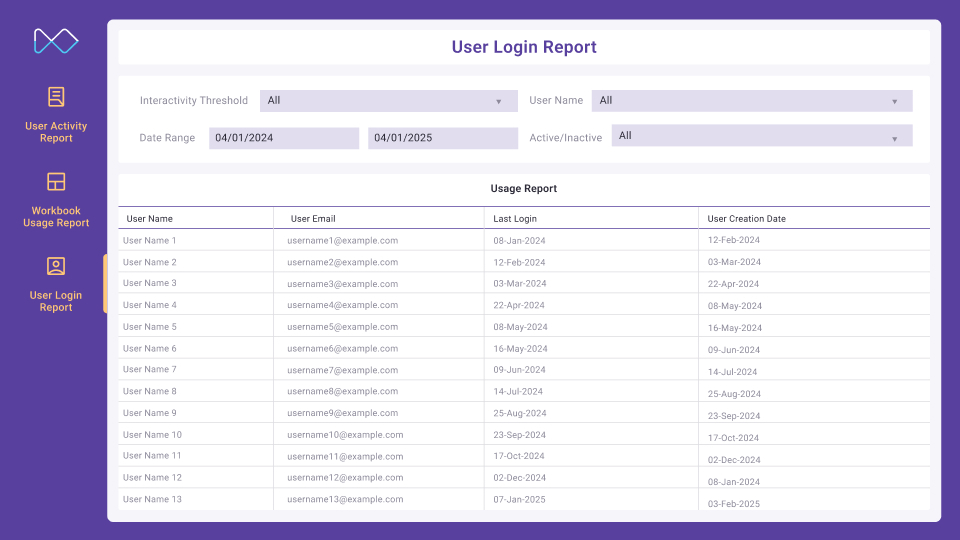
Workbook Level Report
The Workbook Report provides a further deep dive into the usage of each workbook. It offers a simplified view of dashboard activity by user. Key features includes:
- Tracking the most used and least used dashboards for analysing usage patterns.
- Monitoring users' last login dates to identify activity patterns.
- Identifying dormant users to optimize licensing and reduce costs.
- Identifying if users actually find the reports useful in data analysis modifications are needed.
- Centralized view of the dashboards present by department in the organisation for complete transparency.
Services


Benefits

Centralized Dashboard Access
The creation of a landing page simplified the navigation of over 100 dashboards for various departments. This page acted as an entry point for users in Tableau Cloud, offering them seamless access to their specific dashboards. It served as a central hub, displaying all dashboards on one screen with flexible access.

Multiple Admin Views & Usage Report
Created multiple administrative views using admin insights data to track dashboard activity levels, which significantly boosted user adoption by 95%. Key metrics tracked included the most used dashboard, least used dashboard, and users' last login dates. It also helped in reducing licensing costs after identifying dormant users.

Power BI to Tableau Migration
The implementation of a detailed migration checklist streamlined the process, reducing turnaround time by 80%. This method enabled a faster, more efficient transfer from Power BI to Tableau, reducing disruptions and allowing the client to instantly benefit from the new reporting platform.

Security & Access
Enhanced security measures and stricter access controls, played a crucial role in safeguarding sensitive data. These improvements helped to avoid data leaks and unauthorized access, protecting the integrity of the information while also assuring compliance with privacy standards and providing a secure environment for users.
Conclusion
We supported a leading US solar energy company in migrating over 80 dashboards from Power BI to Tableau and optimizing Tableau operations. Our efforts included creating administrative views and a comprehensive KT process, resulting in a 95% increase in usage adoption. Optimization strategies reduced turnaround time by 80%, streamlining data visualization and enabling faster, more informed decision-making in the renewable energy sector.
FAQ
Frequently Asked Questions on How We Optimize Solar Reporting with Power BI to Tableau Migration
How did NeenOpal ensure a smooth Power BI to Tableau migration?
NeenOpal created a detailed, step-by-step migration checklist and standardized dashboard templates to maintain consistency. The team aligned KPI definitions with stakeholders, validated metrics, and executed the migration with zero reporting downtime, ensuring a seamless transition.
How many dashboards were migrated and within what timeframe?
Over 80 dashboards were successfully migrated from Power BI to Tableau, with turnaround time reduced by 80% through optimized processes and automation.
How were KPI inconsistencies and trust issues in reporting resolved?
NeenOpal worked closely with business stakeholders to define standardized KPIs and added info buttons within dashboards to clearly document metric definitions, improving transparency and trust in analytics.
Authors


Contact Us
We’d love to hear from you.
Lets discuss how we can transform your business with AI. Talk to our AI expert team. Lets do AI journey together.