


Overview
A leading dental industry media company partnered with NeenOpal to build a centralized marketing intelligence infrastructure from the ground up. With audience data, campaign performance, CRM activity, webinar engagement, and learning platform metrics scattered across more than a dozen disconnected systems, the client lacked a unified view of marketing performance and customer engagement. NeenOpal designed and delivered a fully automated, cloud-native data platform that ingests data from 20+ marketing, CRM, and engagement platforms into Google BigQuery enabling reliable, weekly-refreshed reporting and cross-platform analytics from a single source of truth.
- 20+
- Disconnected Platforms Unified into a Centralized Intelligence Layer
- 100%
- Weekly Pipeline Automation Coverage Across Integrated Platforms
Customer Challenges
The client operated across a wide range of marketing and CRM platforms, each generating valuable data in isolation. Without a unified data layer, cross-platform analysis was impossible, and reporting relied heavily on manual exports and disconnected spreadsheets.

Fragmented Data Across 20+ Platforms
Campaign performance, CRM records, email engagement, webinar registrations, LMS completions, and form submissions lived across separate platforms including Facebook Ads, HubSpot, Mailchimp, Dotdigital, Zoom, YouTube, Google Ads, LinkedIn, Jotform, SurveyMonkey, SendGrid, and a Moodle-based LMS - making unified reporting and attribution extremely difficult.

No Centralized Reporting Infrastructure
The client had no centralized warehouse, no ETL pipelines, and no staging architecture. Every report required manual effort, and cross-platform metrics could not be reliably combined or compared.

API Complexity and Platform Limitations
Each platform exposed data differently, some through native connectors, others through undocumented or inconsistent HTTP APIs. Several platforms introduced additional complexity through API limits, OAuth issues, and unreliable pagination behavior.

CRM Scale and Data Integrity
The HubSpot environment contained over hundreds of thousands of activity records across calls, emails, meetings, tasks, notes, and SMS requiring carefully designed backfills, date-range splits, and deduplication logic to ensure accurate ingestion at scale.

Nested LMS API Workloads
The Moodle-based LMS required deeply nested API execution patterns (courses → enrolled users → completion status per user). This workload exceeded practical limits of low-code orchestration alone and required a cloud-native compute approach.
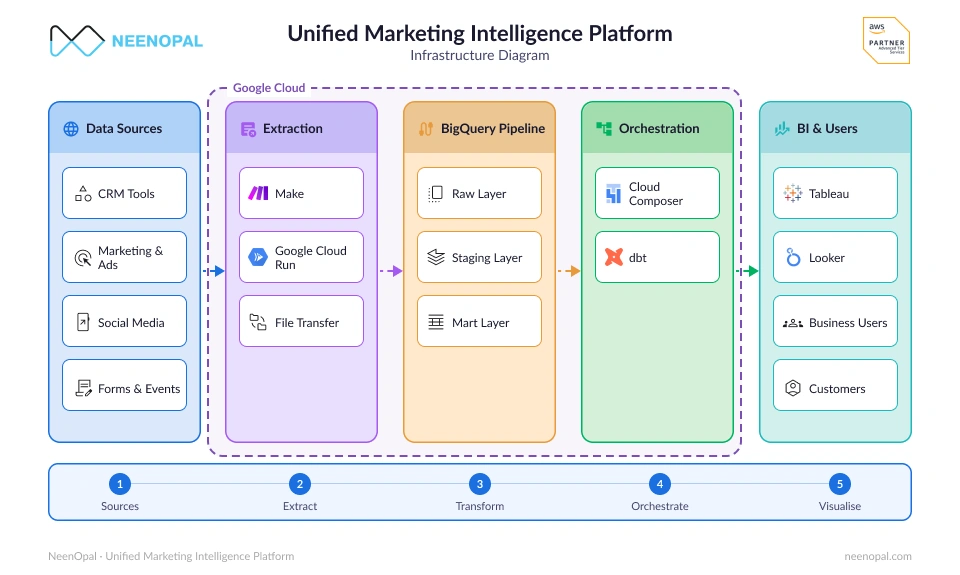
Unified Marketing Intelligence Platform Infrastructure
A cloud-native pipeline that pulls data from 20+ disconnected platforms into one weekly-refreshed BigQuery warehouse for cross-platform reporting.
Solutions
NeenOpal designed a layered, cloud-native marketing intelligence architecture using Make.com for orchestration, Google Cloud Run for complex workloads, and Google BigQuery as the centralized warehouse with a consistent raw → staging → mart architecture applied across all platforms.
Make.com Orchestration Across 20+ Platforms
For the majority of platforms, NeenOpal implemented Make.com scenarios using native and HTTP modules to orchestrate automated weekly ingestion. Raw JSON payloads are stored directly in BigQuery, while staging views handle parsing, type casting, deduplication, and business transformations.
Cloud Run for Complex Nested APIs
For the LMS integration, NeenOpal implemented a Python-based Google Cloud Run service to manage nested API execution, pagination, progressive inserts, BigQuery deduplication checks, and timeout handling. This eliminated excessive Make.com credit consumption while maintaining scalability and reliability.
HubSpot CRM
NeenOpal built end-to-end ingestion pipelines across all major HubSpot objects including Contacts, Companies, Deals, Calls, Emails, Meetings, Tasks, Notes, and SMS along with association tables linking CRM entities together for downstream analytics.
SCD Type 2 for Deal Stage Tracking
To preserve historical CRM state changes, NeenOpal implemented Slowly Changing Dimension Type 2 (SCD2) logic for deal stage tracking. This maintained a complete audit history of every deal movement using valid_from, valid_to, and is_current logic.
Consistent Raw → Staging → Mart Architecture
Every platform follows the same three-layer design: Raw tables retain immutable JSON payloads Staging views standardize, deduplicate, and transform source data Mart views combine platforms into reporting-ready business datasets
Platform-Specific Engineering Solutions
Several complex engineering challenges had to be addressed across the platform ecosystem, including: HubSpot 10k record API limitations Zoom Events broken pagination behavior YouTube Analytics OAuth account mismatches Deeply nested Moodle LMS API execution patterns LinkedIn Ads native analytics limitations Multi-account Google Ads ingestion complexity Inconsistent JSON payload structures across platforms
Services
 Google BigQuery
 HubSpot
 Google Analytics 4
Benefits

Unified marketing intelligence across 20+ platforms
Consolidated data from more than 20 marketing, CRM, webinar, and engagement platforms into a single source of truth. This enabled teams to analyze performance and customer interactions holistically instead of working with isolated datasets.

Fully automated reporting workflows
Eliminated manual exports and repetitive reporting activities through automated ingestion and transformation pipelines. Weekly data refreshes ensured stakeholders always had access to timely and reliable insights.

Centralized BigQuery Warehouse Replacing Fragmented Spreadsheets
Replaced scattered spreadsheets and disconnected reports with a centralized Google BigQuery warehouse. This provided a scalable foundation for consistent data management and simplified access to business metrics.

Scalable Raw → Staging → Mart Architecture for Reliable Analytics
Implemented a structured multi-layer architecture that separates raw ingestion, transformations, and reporting datasets. This improved data quality, maintainability, and ensured analytics remained reliable as data volumes grew.

Complete CRM History with SCD Type 2 Deal Tracking
Introduced SCD Type 2 logic to preserve every change in deal stages and maintain a full historical record. This enabled accurate trend analysis and complete visibility into the customer lifecycle.

Cross-Platform Attribution and Engagement Visibility
Connected campaign, CRM, webinar, email, and learning platform data to provide end-to-end visibility into customer engagement. Teams could better understand how interactions across channels contributed to marketing outcomes.

Foundation Established for Future Expansion and Advanced Analytics
Built a cloud-native and extensible data platform capable of supporting additional integrations and evolving business requirements. The architecture provides a strong foundation for advanced analytics, attribution models, and AI-driven insights.
Conclusion
With NeenOpal’s support, the client successfully transformed a fragmented, manual reporting ecosystem into a centralized, automated marketing intelligence platform. By combining Make.com orchestration, Google Cloud Run, and BigQuery into a unified architecture, NeenOpal delivered a scalable, production-grade analytics foundation that enables reliable cross-platform reporting and data-driven marketing decisions.
Authors


Case studies
Related case studies
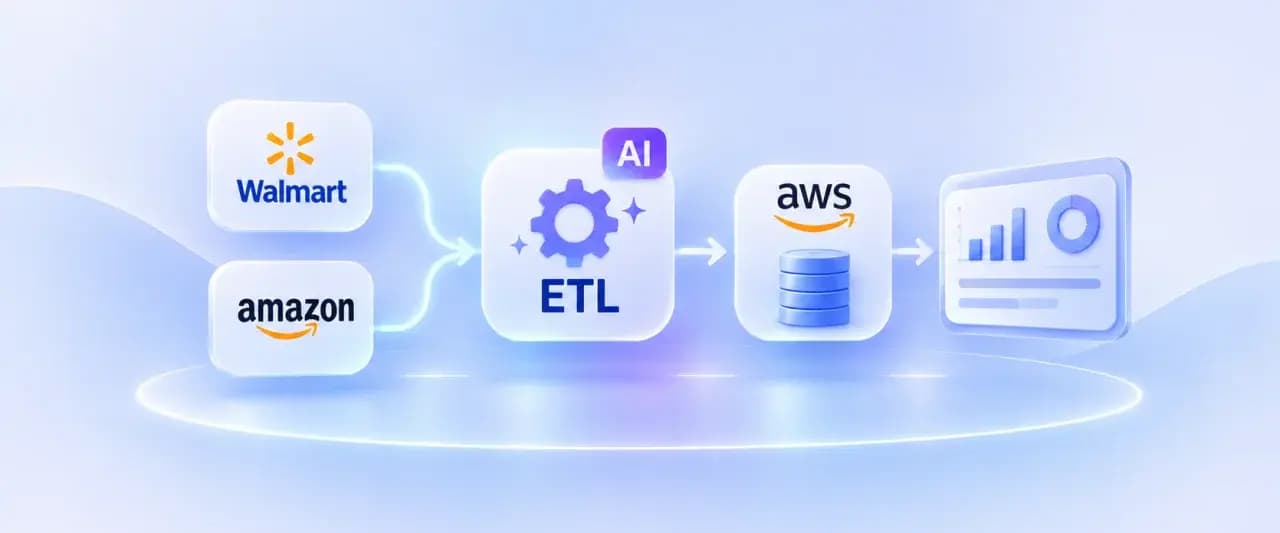
AI-Augmented ETL for Automating Multi-Portal Retail Reporting on AWS
A consumer beauty and personal care brand needed to bring its Walmart and Amazon supplier and performance data into a single AWS RDS PostgreSQL database. Walmart's data was split across a standard supplier API and three separate reporting portals (Retail Link, Scintilla, and Supplier One), each with its own authentication, file formats, and update cadence. NeenOpal designed a hybrid ETL platform with two ingestion paths running in parallel: an orchestrated API pipeline for the data Walmart exposes directly, and an AI-driven report retrieval pipeline for the data that fell outside the scope of the client's existing API access. Both paths converge on a shared Glue transformation layer, a common S3 staging area, and a single PostgreSQL database, with a separate one-time Spark job bringing in Amazon Vendor Central's historical data. The result is a single, config-driven system rather than a set of one-off integrations.
Read case study
Tableau Dashboard Development for a US Insurance Organization: 4 Data Sources Unified
Our client, an insurance organization with field teams spread across every US state, partnered with NeenOpal to replace a manual, spreadsheet-driven reporting process with a consolidated Tableau dashboard environment governed by row-level security. Operational data lived in four separate systems covering Airtable, Salesforce, Google Analytics 4, and Google Search Console, and bringing them together meant exporting and stitching the data by hand, which left leadership without a single reliable view of performance. NeenOpal consolidated all four sources into an Azure SQL Server layer, reviewed and corrected the data quality issues that surfaced along the way, and delivered three Tableau dashboards across seven screens that refresh automatically every day. Row-level security was implemented across all fifty states and the independent districts, driven by an entitlement model the client maintains through a single Google Sheet, so every representative sees the states they are responsible for and nothing more.
Read case study
Unifying Multi-Region Sales Pipeline Analytics with Power BI and Power Query
Our client, a global healthcare company with commercial operations across Africa and Western Europe, partnered with NeenOpal to build a unified sales pipeline dashboard spanning more than six regional teams across two continents. Pipeline data was managed in isolation by each region, reported in inconsistent formats, and pulled from different systems including Salesforce and SAP, leaving leadership without a consolidated view of opportunities, orders, and revenue. NeenOpal designed and delivered a centralized sales pipeline dashboard in Power BI, powered by an automated Excel and Power Query ETL layer, that standardizes data from every region into one live view. The solution tracks each opportunity from lead to shipped order, benchmarks performance against multiple internal targets, forecasts revenue from existing customers, and lets non-technical users refresh the entire report in one to two clicks.
Read case study
How a Global Agricultural Equipment Manufacturer Built a Trusted Web Analytics Platform with GA4, Snowflake, and Power BI
Our client is a leading manufacturer of agricultural and industrial equipment operating across international markets, with a B2B sales model distributed through an authorised dealer and reseller network. The client's website serves as a primary discovery and research channel for prospects and distributors, where meaningful conversion actions centre on product brochure and playbook downloads rather than direct online transactions. Despite access to Google Analytics 4, the client had no reliable mechanism to trust or act on its own web data, with sampled GA4 reporting, undefined conversion events, and the absence of a structured data pipeline meaning internal stakeholders were making website and content decisions without confidence in the underlying numbers. NeenOpal partnered with the client to rebuild the analytics data foundation from the ground up, engineering a modern pipeline from GA4 through BigQuery into a multi-layer Snowflake data warehouse, and delivering a suite of Power BI dashboards that provided trusted, unsampled website intelligence for the first time.
Read case study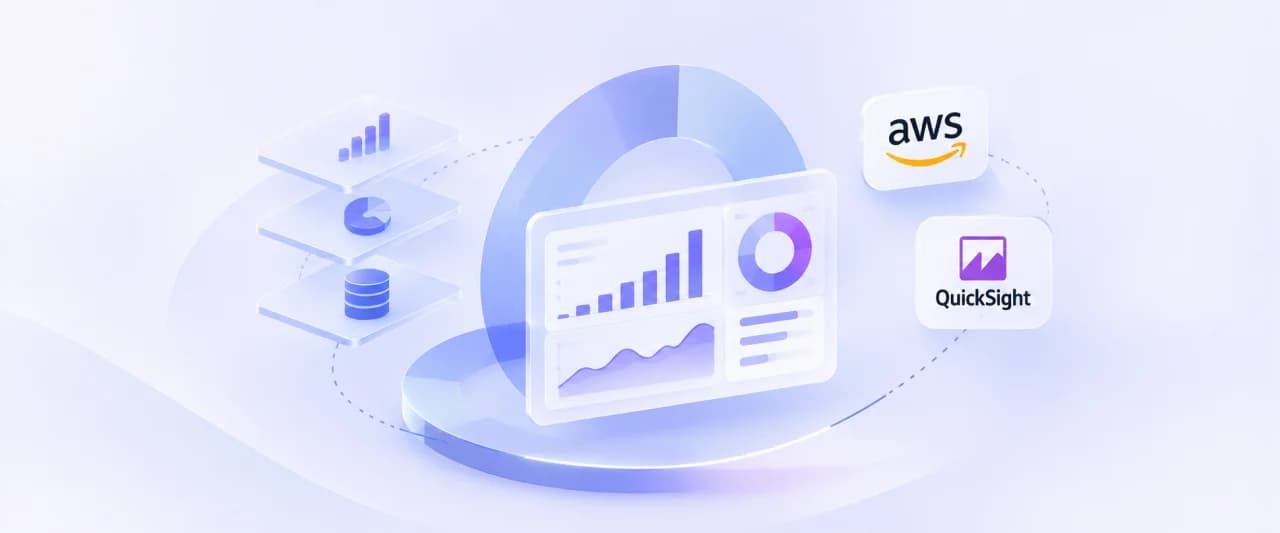
Simplifying High-Complexity Analytics with AWS QuickSight and AWS Data Services
A U.S.-based market research and consulting firm generating large volumes of survey and analytical data faced growing complexity in managing its analytics environment due to extensive calculations and numerous dashboards. NeenOpal addressed this by implementing an optimized architecture using Amazon QuickSight and a redesigned data pipeline, simplifying the framework while preserving deep research insights.
Read case study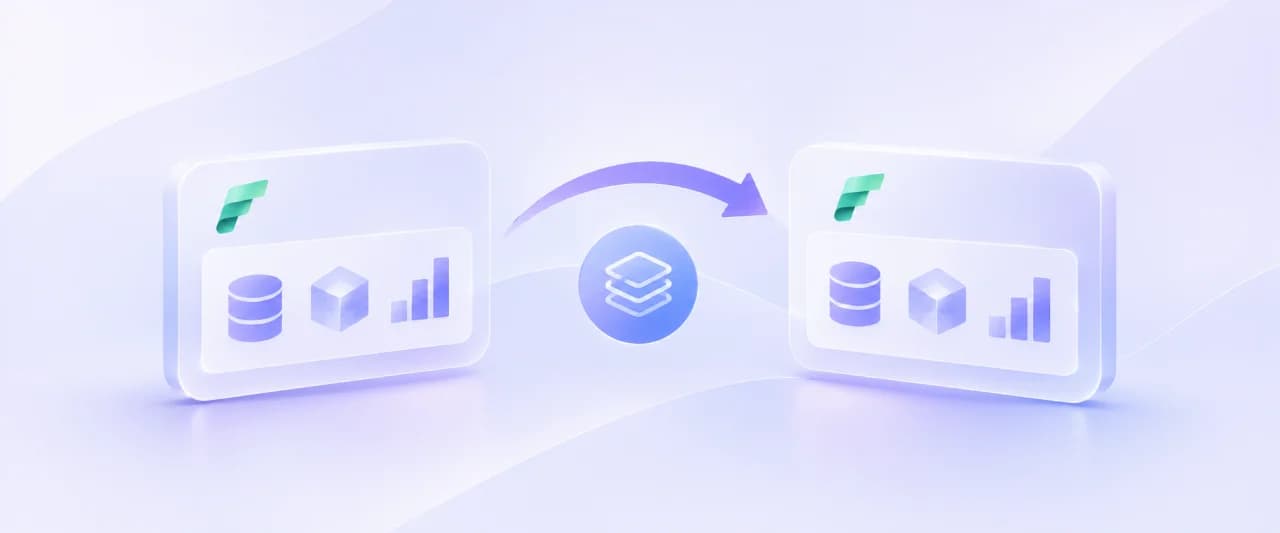
Cross-Tenant Semantic Model Migration
Replicating a semantic model across Microsoft Fabric tenants was a major roadblock for our Edtech client. Since semantic models are tightly coupled to their tenant, workspace, and Lakehouse, migration became highly complex, especially when advanced DAX logic and metadata had to be preserved. To overcome this, we built a reusable solution using .bim files and a Fabric Notebook. This approach automated the process and enabled seamless transfer of the model from Lakehouse A in Tenant A to Lakehouse B in Tenant B.
Read case study