
To end it I will be covering how to check the logs in “Cloud Watch” in case the Glue Job fails. For those who are unfamiliar with Amazon CloudWatch, Amazon CloudWatch is a service that monitors your Amazon Web Services (AWS) resources and the applications you run on AWS in real-time. To learn more, you can visit the official documentation at:
https://docs.aws.amazon.com/AmazonCloudWatch/latest/monitoring/WhatIsCloudWatch.html.
An approach to identify the cause of ETL failure and resolving it
I will be using ‘Cloud Watch’ logs to find the cause for the Glue Job failure. Glue Job failure can occur due to several reasons such as data discrepancy, a change in the structure of the source table, the logic for implementation is wrong etc. Error resolving is not particularly easy here because the logs generated for a job can run in pages. One must know how to navigate through these logs and get to the source of the error causing the problem. I will be explaining a way to solve these issues. Before diving into it I must warn you that the approach I have shown here may not help to resolve bugs in all types of Jobs, but it can be considered as a strategy to identify the cause for the problem.
Steps to resold ETL failures
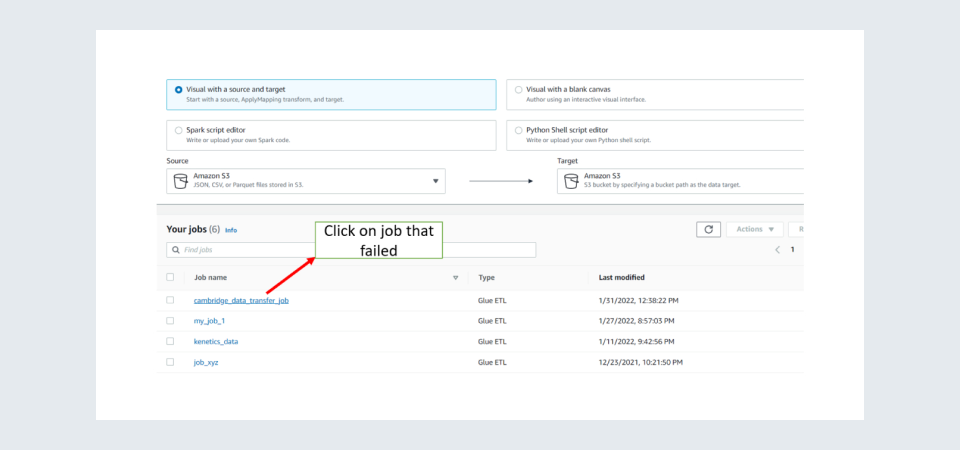
Step 1: In the Glue Studio go to the Job that has failed.
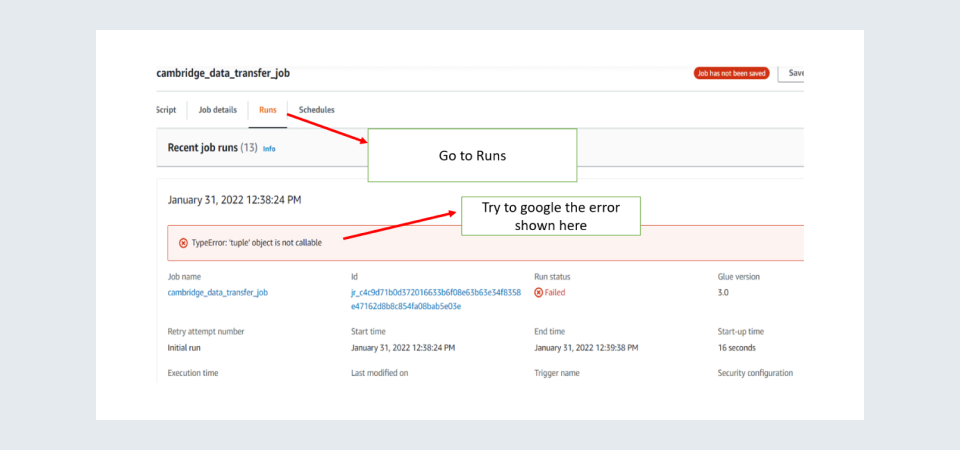
Step 2: Go to Runs for the Job and try to make sense of the error shown at the top. You can also google it to make more sense of it.
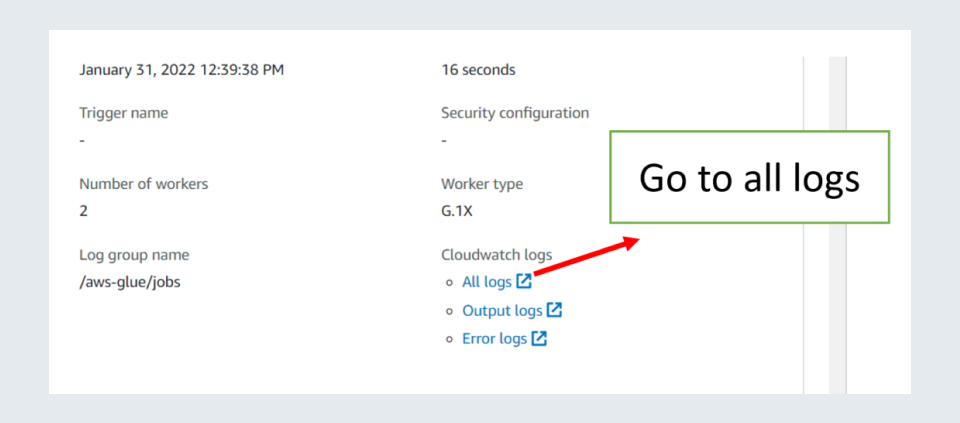
Step 3: If you want to find out in which line the error has occurred you need to go to cloud watch logs. So, scroll down and go to ‘All logs’ in ‘Cloudwatch logs’. A word of caution does not go to output logs or error logs as they are difficult to interpret.
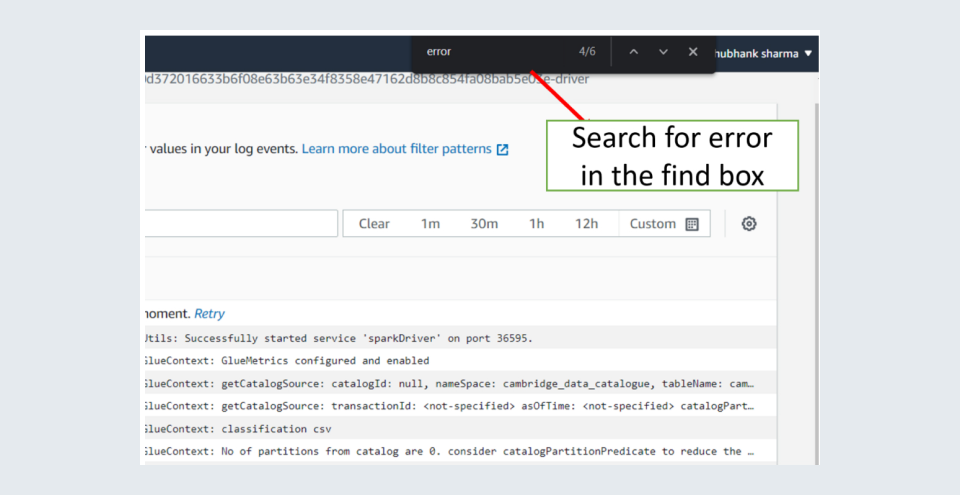
Step 4: Once you are in all logs use the ctrl+f shortcut to activate find in the page or if you use Mac Book the alternative would be Cmd + f. In the find, box search for error and navigate through all results.
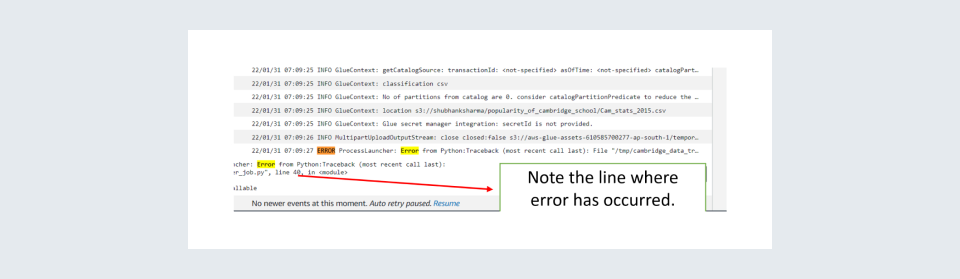
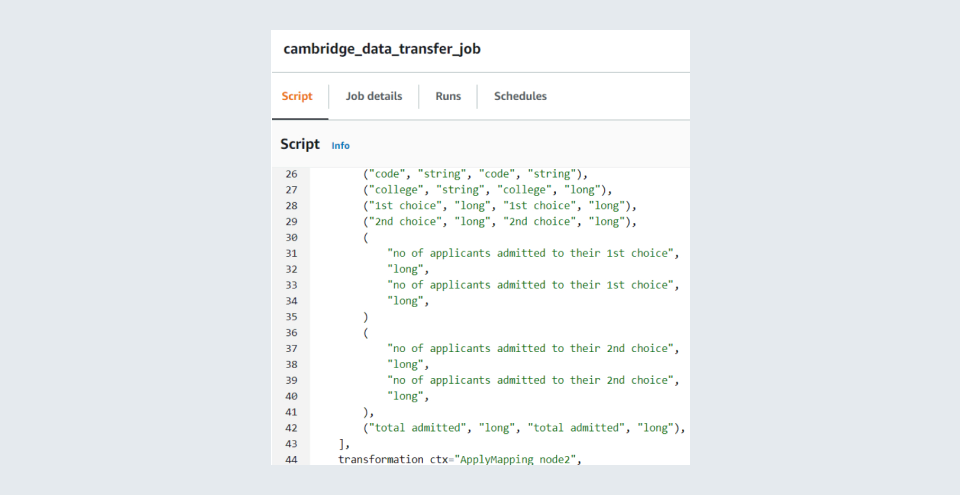
Step 5: Go back to the script of that Job and then to that line and look for the cause of the error. Google and stack overflow results may give you more hints on the cause of error like in my case there was a comma missing in line 35. Correct the cause for the error and then rerun the Job to check everything is working fine.
Step 6: If there still exists an error, try repeating the process. If you are not still able to find solutions try posting the problem in StackOverflow or some other blogs that help in resolving errors.
The key point to remember is how you find the line number where the error has occurred using pages of logs. After that, there are several resources to find solutions. You can also post in this blog for resolution.