
What is an outlier?
In a random sampling from a population, an outlier is defined as an observation that deviates abnormally from the standard data. In simple words, an outlier is used to define those data values which are far away from the general values in a dataset. An outlier can be broken down into out-of-line data.
For example, let us consider a row of data [10,15,22,330,30,45,60]. In this dataset, we can easily conclude that 330 is way off from the rest of the values in the dataset, thus 330 is an outlier. It was easy to figure out the outlier in such a small dataset, but when the dataset is huge, we need various methods to determine whether a certain value is an outlier or necessary information.
Types of outliers
There are three types of outliers
- Global Outliers
- Collective Outliers
- Contextual Outliers
1) Global Outliers
The data point or points whose values are far outside everything else in the dataset are global outliers. Suppose we look at a taxi service company’s number of rides every day. The rides suddenly dropped to zero due to the pandemic-induced lockdown. This sudden decrease in the number is a global outlier for the taxi company.
2) Contextual/Conditional Outliers
Contextual outliers are those values of data points that deviate quite a lot from the rest of the data points that are in the same context, however, in a different context, it may not be an outlier at all. For example, a sudden surge in orders for an e-commerce site at night can be a contextual outlier.
3) Collective Outliers
Some data points collectively as a whole deviates from the dataset. These data points individually may not be a global or contextual outlier, but they behave as outliers when aggregated together. For example, closing all shops in a neighborhood is a collective outlier as individual shops keep on opening and closing, but all shops together never close down; hence, this scenario will be considered a collective outlier.
Why do we need to treat outliers?
Outliers can lead to vague or misleading predictions while using machine learning models. Specific models like linear regression, logistic regression, and support vector machines are susceptible to outliers. Outliers decrease the mathematical power of these models, and thus the output of the models becomes unreliable. However, outliers are highly subjective to the dataset. Some outliers may portray extreme changes in the data as well.
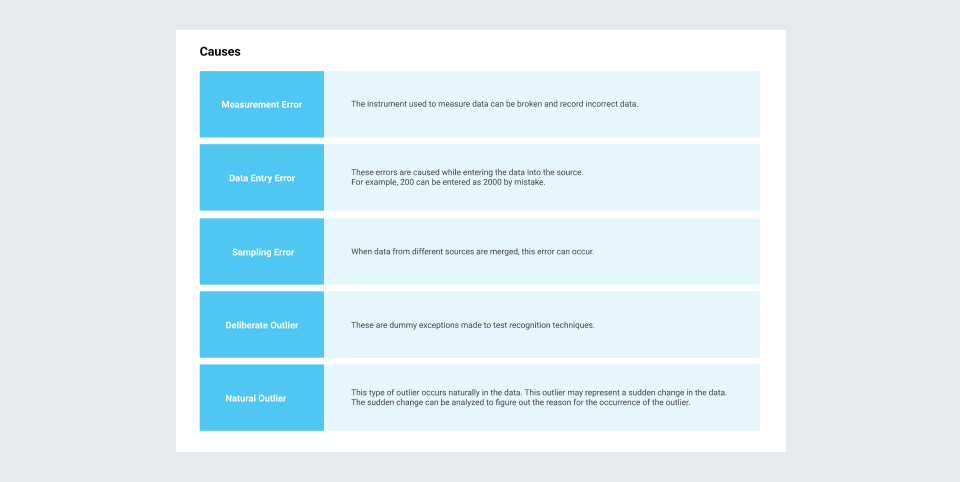
Causes for the presence of outliers
Visual Detection
- Box plots are a simple way to visualize data through quantiles and detect outliers. IQR(Interquartile Range) is the basic mathematics behind boxplots. The top and bottom whiskers can be understood as the boundaries of data, and any data lying outside it will be an outlier.
import matplotlib.pyplot as plt
df=[10,15,22,330,30,45,60]
plt.boxplot(df, );
plt.title("Box Plot to detect Outliers")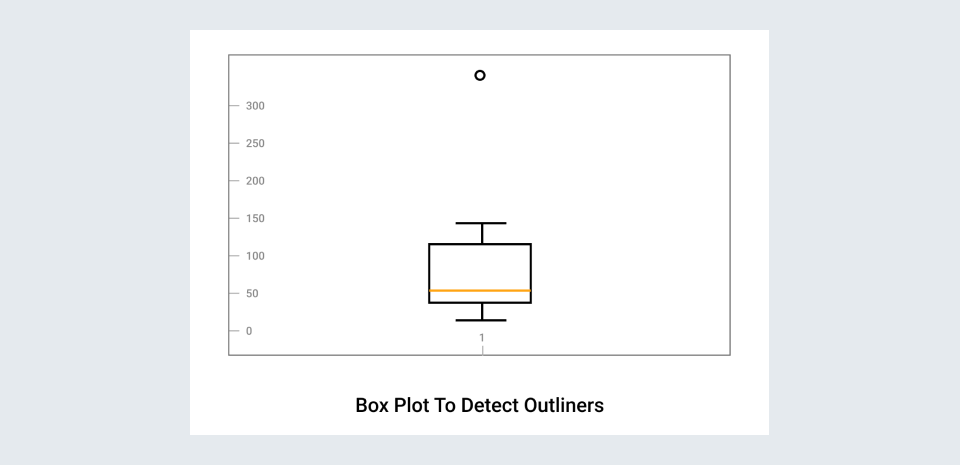
- Scatter Plots are also a simple yet intuitive way to visualize outliers. Scatter plots are used to show the relationship between two variables in graphical form. Scatter plots usually have a pattern, and those data points not following the pattern are considered outliers.
Statistical detection
Removing and modifying the outliers using statistical detection techniques is a widely followed method. Some of these techniques are:
- Z-Score
- Density-based spatial clustering
- Regression Analysis
- Proximity-based clustering
- IQR Scores
What are Missing values?
In a dataset, we often see the presence of empty cells, rows, and columns, also referred to as Missing values. They make the dataset inconsistent and unable to work on. Many machine learning algorithms return an error if parsed with a dataset containing null values. Detecting and treating missing values is essential while analyzing and formulating data for any purpose.
Detecting missing values
There are several ways to detect missing values in Python. isnull() function is widely used for the same purpose.
dataframe.isnull().values.any() allows us to find whether we have any null values in the dataframe.
dataframe.isnull().sum() this function displays the total number of null values in each column.
Remedies to the outliers and missing values
What should be done with the outlier and missing values then? Drop them? Replace them with another value? This entirely depends on the kind of data we are dealing with. There are various methods to treat null values and outliers, and after a deep analysis of the data present, one can estimate the way to be used for treating the null values.
- Deleting missing values
This is not a good practice as it can lose valuable insights from the data. A good chunk of data can be lost if one drops the rows containing null values.
- Imputation methods
Replacing or predicting the data in the stead of the missing values or outliers present is referred to as imputing the data. Various imputation methods are followed to treat the outliers and missing values. Some of these are:
- Filling in zero : The easiest way to treat null values is to fill the missing values as zero or replace the outliers with a zero. It would not be the best method.
- Filling in with a number : One can fill all the null values with a single number by using .fillna() function. For example, if we want to replace every null value with 125.
df['column_name'].fillna(125, inplace=True)- Filling with median value : Simply replace all null values with the median value of the column. One major disadvantage of this method is it does not account for the covariance between the data features i.e it considers each entry independently and can cause data leakage.
#Replacing using median
median = df['column_name'].median()
df['column_name'].fillna(median, inplace=True)- Filling with the mean : Replacing the missing value or the outlier with the net mean of the data or a moving average of previous n-data cells is also a widely followed method and is helpful in time series data.
- Interpolation : Using the .interpolate function is a powerful way to fill missing values. This technique takes the above and below values of a missing value and calculates the mean to fill in place of the missing value.
- Using some other algorithms for predicting the values (linear regression, KNN, Naive Bayes, Random Forest) : Using some machine learning based algorithms like K- Nearest Neighbours, Naive Bayes, Decision Trees and Random Forests can help in predicting values without compromising with the data dependence on the other categorical variables. Some of these can be trivial to implement in Python but they are the best methods to replace and predict the missing values or outliers in the dataset.
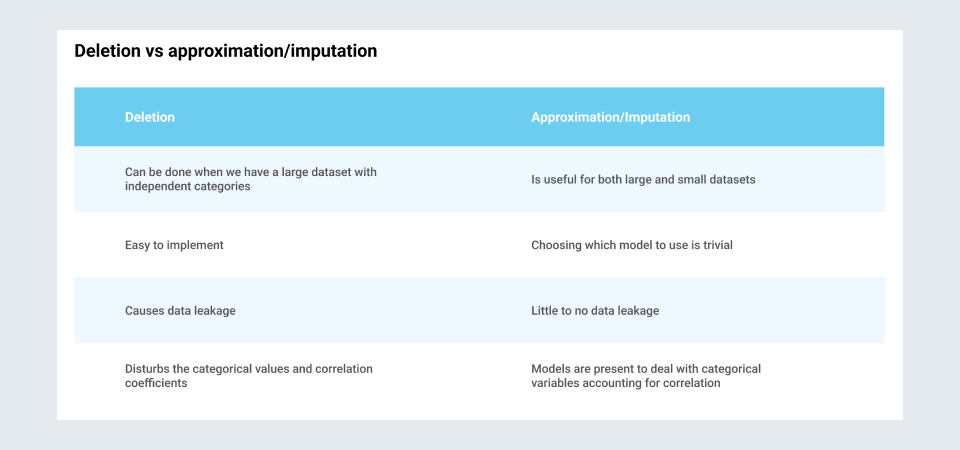
Deletion vs approximation/imputation
Conclusion
Treating missing values and outliers is an essential step of data cleansing and preparation and should be one of the first operations done on a dataset. Only after these steps are administered is the data considered usable to build models and take insights from. Only after the data is treated of the outliers and the missing values and other deformities,it is taken to the next step of the data analysis cycle i.e data pre-processing.