
Ever wanted to see your Tableau Cloud environment work seamlessly for both administrators and end-users, offering valuable insights into usage and performance?
The Custom Admin Dashboards can help you achieve just that. This tailored solution provides businesses with a user-friendly interface to gain insights into user activity, dashboard performance, and license management—all in one centralized location. It simplifies navigation, optimizes resource allocation, and helps streamline auditing processes by tracking both active and inactive users and providing visibility into dashboard usage.
Importantly, this setup includes two distinct dashboards:
- Tableau Dashboards Index Page – A standalone dashboard that serves as a centralized hub for navigating all dashboards within the organization.
- Custom Usage Dashboard – A multi-page dashboard containing detailed reports on user activity, workbook usage, and login data.
Why Custom Admin Dashboards?
Traditionally, Tableau provides an out-of-the-box Admin Insights Starter dashboard, which offers a high-level overview of key metrics such as user activity, dashboard usage, and overall engagement. While informative, it lacks a user-friendly interface and strong visual appeal, making it difficult for users to explore insights quickly and intuitively.
Moreover, one major limitation is the inability to view and navigate all available dashboards from a single location. Users don’t have an easy way to explore or open dashboards directly through the Tableau Admin Insights report.
The Custom Admin Dashboards addresses these gaps by offering a clean, interactive, and intuitive layout. Not only does it consolidate essential usage metrics and user data, but it also provides direct links to each dashboard, making navigation effortless and improving accessibility for both Tableau administrators and end users.
What We Achieved
- Active Tableau dashboard users increased from 45% to 85%.
- Streamlined license costs, reducing by 18% by proactively removing underutilized users.
- Leadership usage of the dashboard, including cross-domain usage, grew by 30%, enabling more data-driven strategic decisions.
Key Features
The Custom Admin Dashboards are designed to make Tableau Cloud navigation, monitoring, and management significantly more intuitive and actionable.
Our solution is split into two main dashboards, each with a unique purpose:
1. Tableau Dashboard Index Page
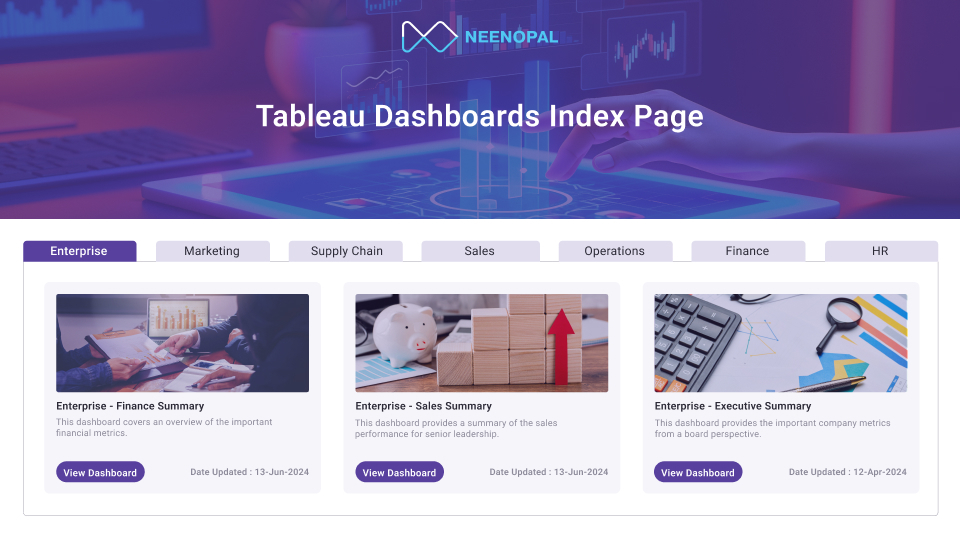
This dedicated dashboard functions as a central hub for all published dashboards in the Tableau Cloud environment.
- Clean, categorized layout of dashboards by department, team, or business function
- Clear item names and descriptions for a better understanding of each report
- “Go to Report” buttons allow one-click access to specific dashboards.
- “Date Updated” field flags dashboards that haven’t been refreshed recently
- Interactive filters for easy browsing by department or business unit
- Helps drive Tableau adoption and reduces admin overhead by simplifying discovery
- Description helps to have a context for the report and its content.
2. Custom Usage Dashboard
This dashboard consists of three interrelated custom views, all powered by Tableau Admin Insights data:
a. User Activity Report

This screen provides an administrative view powered by Tableau’s Admin Insights data, helping admins monitor dashboard usage patterns and optimize user engagement.
- Identify the most and least used dashboards to prioritize improvements.
- Track users' last login dates to understand activity levels.
- Detect dormant users to optimize license allocation and reduce costs.
- Gain centralized visibility into dashboard activity across the organization.
- Enable data-driven decisions to improve adoption and usage.
b. Workbook Usage Report

This deep-dive custom view breaks down dashboard activity by workbook and by user, enabling detailed insights into usage at a granular level.
- Analyze workbook usage trends by individual users to understand engagement.
- Spot patterns in active vs. inactive users to guide content cleanup and optimization efforts.
- Understand how frequently each report is being used to identify high-value content.
- Evaluate report effectiveness in aiding data analysis and decision-making.
- View dashboards categorized by department for full transparency across the organization.
- Uses Fixed LOD (Level of Detail) expressions to display only the latest workbook names for cleaner analysis.
- Filters item types to show only views, excluding data sources and workbooks, for a more focused usage view.
- Displays detailed workbook and view-level information, including the number of access events per item.
c. User Login Report
This Tableau admin view monitors user login activity and helps identify inactive users, offering insights to improve adoption and streamline license management.
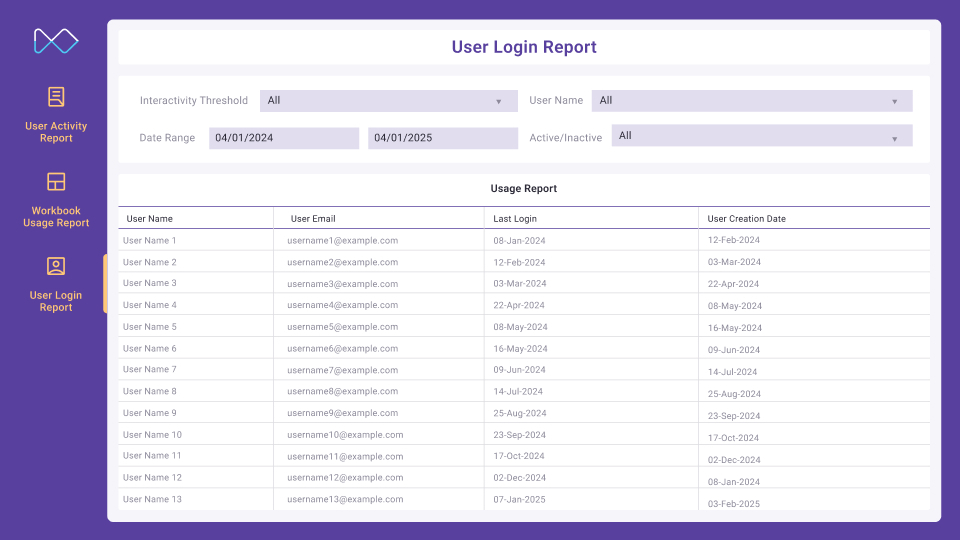
- Tracks user login activity to monitor engagement across the platform.
- Shows each user's last login date along with their account creation date.
- Users who have never logged in are clearly marked with a "Never" label.
- For example, some users (like Jason Gillard) may have accounts but have never accessed the system.
- Includes a customizable inactivity threshold (e.g., 30, 60, or 90 days) to flag inactive users.
- Based on this threshold, users are automatically labeled as Active or Inactive.
- Helps identify and approach users who haven't logged in, allowing admins to check if they’re facing access issues or no longer need access.
Conclusion
The Custom Admin Dashboards provide a game-changing approach to managing Tableau Cloud environments, offering enhanced visibility and control over user and dashboard activity. Here’s why it stands out:
- Centralized Access and Insights: It consolidates user and dashboard activity into a single interface, making it easier for Tableau administrators to monitor usage and engage with users effectively.
- Intuitive Navigation: Unlike the standard Admin Insights dashboard, the Custom Usage Report provides a user-friendly, interactive design with direct links to custom views, facilitating seamless exploration.
- Optimized Decision-Making and Cost Efficiency: By analyzing dashboard usage, user engagement, and login activity, Tableau admins can make data-driven decisions to optimize resources, improve Tableau adoption, and allocate licenses more effectively. Additionally, tracking inactive users helps optimize license management, reducing costs by identifying unnecessary accounts and ensuring better resource allocation.
- Granular Visibility: The report breaks down usage data to provide insights at various levels, including dashboard, workbook, and individual user levels. This allows for detailed analysis and identification of trends, such as dormant users or underutilized dashboards.
- Easy Implementation: Setting up the Custom Usage Report is straightforward and has a step-by-step process, enabling businesses to quickly deploy it in their Tableau Cloud environment and start reaping the benefits of enhanced data visibility.
Overall, this solution is invaluable for any Tableau administrator aiming to boost efficiency, cut costs, and empower users through actionable custom insights and well-designed custom views.
Ready to unlock the full potential of your Tableau environment?
Discover how our team at NeenOpal can help you design tailored admin views that align with your business goals, boost adoption, and improve decision-making across teams. Contact us today to explore how we can elevate your Tableau strategy.