
What is Spatial Analytics?
Spatial analytics is the process of analyzing geographic data and examining the relationships, patterns, and trends of the data to gain insights and make meaningful decisions. It involves gathering, analyzing, and visualizing location-based data to reveal information about a specific area or region. For example, spatial analytics can be used to determine the best location for a business by analyzing demographic data such as population density, income levels, and transportation options.
This document is created with the intention of understanding the different use cases which you can solve using Spatial Analytics.
Use Case 01
Problem Statement :
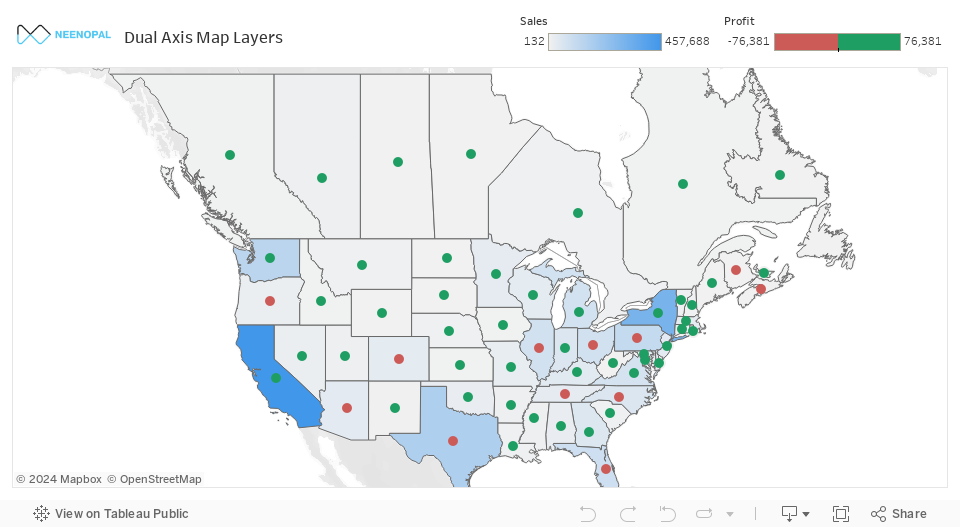
Suppose you have country, sales, and profit data available with you and you wish to accommodate all three in a single chart with a context of data visualization and storytelling as well as catch the viewer’s attention with context to the graph.
Solution :
- The same can be achieved by using the concept of dual axis with maps.
- Dual axes are helpful in analyzing two measures with different scales. To add a measure as a dual axis, drag the field to the right side of the view and drop it when you see a black dashed line appear. You can also right-click (control-click on Mac) the measure on the Columns or Rows shelf and select Dual Axis.
Output :
Comments :
The above chart covers all the points it helps us with data visualization as well as storytelling since, from a glance, we can find out which areas are in profit and which areas are in loss.
Read More About Dual Axis and How to implement the same in Tableau.
Use Case 02
Problem Statement :
- Suppose you have data available at multiple layers and again you wish to perform data visualization and data storytelling.
- Here we have a dummy situation that protests are happening in the country (or world) regarding any policy and you wish to analyze the data.
Code to generate data :
import csv from geopy.geocoders
    import Nominatim

    # define lists for respective data
    states = ["Karnataka", "Kerala", "Maharashtra", "Uttar Pradesh", "Madhya Pradesh", "Tamil Nadu", "Rajasthan", "Gujarat", "Delhi", "Haryana"]
    districts = ["Bengaluru", "Chennai", "Mumbai", "Lucknow", "Bhopal", "Hyderabad", "Jaipur", "Ahmedabad", "New Delhi", "Gurugram"]
    streets = ["Nagarbhavi road", "Sector 10", "Poddar Road", "Matunga West", "St Marys Road", "Cantonment", "Lane 2","Maruti Nagar", "Gokhle Marg", "Shastri Nagar"]
    no_of_protest = [50, 60, 70, 80, 90, 100, 110, 120, 130, 140]

    # list for latitude and longitude
    latitudes = []
    longitudes = []

    # obtain latitude and longitude of all states, districts, and streets
    for i in range(len(districts)):
    geolocator = Nominatim(user_agent="my_app")
    location = geolocator.geocode(districts[i])
    latitudes.append(location.latitude)
    longitudes.append(location.longitude)

    # define lists to store properties of protest data
    state = []
    district = []
    street = []
    no_of_protest1 = []
    latitude = []
    longitude = []

    # use nested for loop to access properties of the data set
    for i in range(len(states)):
      for j in range(len(districts)):
        for k in range(len(streets)):
          state.append(states[i])
          district.append(districts[j])
          street.append(streets[k])
          no_of_protest1.append(no_of_protest[k])
          latitude.append(latitudes[j])
          longitude.append(longitudes[j])

    # save dataset as csv file
    csvFile = open("dataset.csv", 'w', newline='')
    writer = csv.writer(csvFile)

    # write the headers
    writer.writerow(["State", "District", "Street", "No. of Protest", "Latitude", "Longitude"])

    # write data
    for i in range(len(state)):
    writer.writerow([state[i], district[i], street[i], no_of_protest1[i], latitude[i], longitude[i]])

    # close the file
    csvFile.close()
Solution :
- The above problem statement can be solved using map layers.
- Multiple map layers, simply put – is a feature that allows you to overlay multiple geographical information in your maps
Output :

Comments and advantages :
- We are able to district-wise areas most affected by protests.
- We can see state wise most affected by protests
- Even if the data is available at a country level, we are visualized at that layer as well.
- By just seeing the visuals, we can understand which areas of states are most affected and take necessary actions without any complex analysis.
Note : If your data is geographical dimension, then Tableau automatically generates latitudes and longitudes in the backend for you (In case you feel that data is showing too many nulls, one can use the code above provided, which uses geopy). For the United States, Tableau usually shows correct results.
Read More about Map Layers and it's Implementation in Tableau.
Use Case 03
Problem Statement :
Suppose you are working for an aviation client, and you want to make a route of flights that originate from Delhi so that they can monitor the flight's delay in real time.
Code to generate data :
import numpy as np
    import pandas as pd
    import csv

    data = {
        'Des_Airport':['Delhi', 'Mumbai', 'Chennai', 'Kolkata', 'Hyderabad'],
        'Org_Airport':['Mumbai', 'Delhi', 'Kolkata', 'Hyderabad', 'Chennai'],
        'Des_Lat':[28.6622, 19.0832, 13.0846, 22.5683, 17.4300],
        'Des_Log':[77.2261, 72.8750, 80.2791, 88.3803, 78.4700],
        'Org_Lat':[19.0832, 28.6622, 22.5683, 17.4300, 13.0846],
        'Org_Log':[72.8750, 77.2261, 88.3803, 78.4700, 80.2791]
    }

    # create pandas dataframe from dictionary
    df = pd.DataFrame(data)

    # export dataframe to csv
    df.to_csv('fictional_dataset.csv', index=False)
Solution :
This can be achieved using advanced spatial functions:
- MAKEPOINT([Org Lat],[Org Log])
- MAKELINE([Origin Point],[Destination Point])
Output :

Comments :
This map shows us that dark red flights are delayed and light red flights are on time, this can be used to create a real-time solution that can be integrated, and later, seeing which flights are delayed, we can send information to the user.
List of spatial functions and their syntax in Tableau.
Use Case 04
Problem Statement :
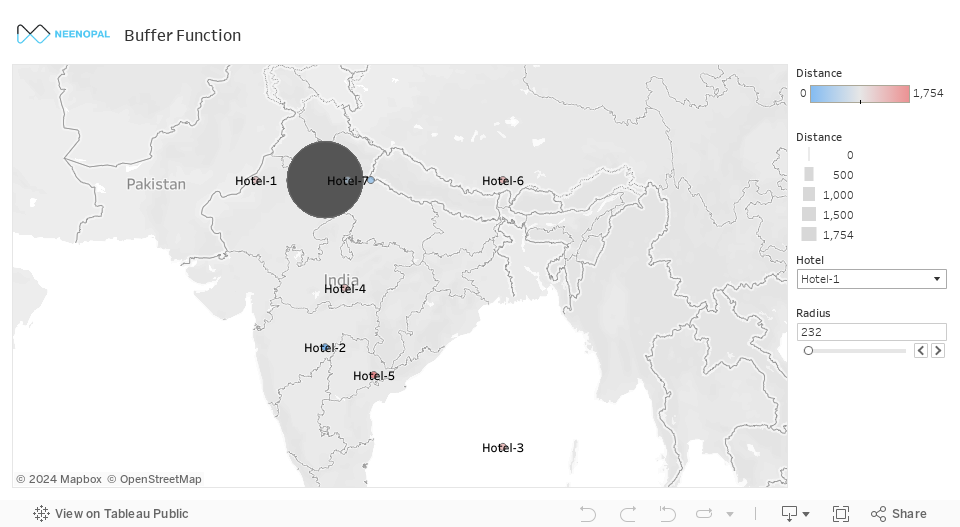
Suppose your is an investment company which hotel should they acquire, and you, as a data analyst, with due discussion from the business manager, came up with a logic that you may choose those hotels which have the maximum number of heritage sites nearby(Say 500 KM (just random number)).
Solution :
We can achieve the same using advanced spatial functions like buffer, make a point, and distance.
Output :
- So if hotel-2 is selected, we are able to see three heritage sites near it.
- Similarly, we can compare the hotel with the maximum number of heritage sites near it.
Comments :
- This chart is highly useful since we can customize the logic by having added a parameter that will help us select the distance we need.
- This can be integrated with map layers as well.
Read More about Buffer in Tableau.
Use Case 05
Problem Statement :
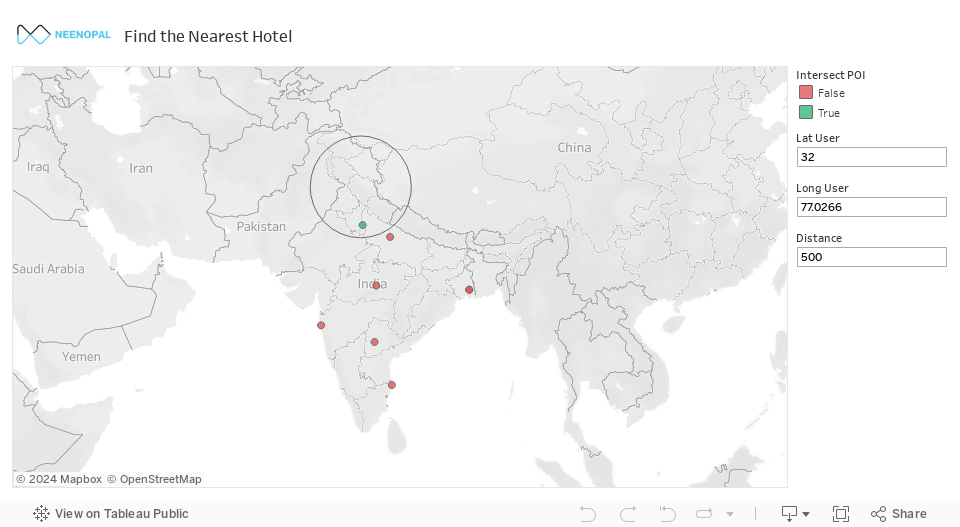
Suppose you are creating an application and you are asked to implement a feature that asks the latitudes and longitude of a person and asks the distance range up to which they want a hotel and then suggest the same. This feature is very common and mostly seen in all famous apps. Can we achieve the same using Tableau?
Solution :
The same can be achieved using advanced Tableau spatial functions i.e. makepoint, intersect, and buffer.
Output :
I entered my lat and long and told me to show the hotels which are at a distance of 500 km for my place two hotels were there coming in blue.
Comments :
- This is a real-time use case where you can create many different use cases for the same.
- All aspects here are covered to create a dynamic solution.
More about Tableau spatial functions and their use case.
Links to learn more about implementing Maps (advanced) in Tableau.