
What is GeoLift?
Developed by Meta, GeoLift is a complete solution for carrying out lift analysis at a geo-level, using the latest developments in Synthetic Control Methods. By using several Power Calculators, this package allows you to execute a data-driven market selection for a geo-test. In addition to that, GeoLift provides simple inference and plotting capabilities for analyzing test findings.
"Geolift is an open-source end-to-end solution that makes it easier for your analytical team to run robust geo-experiments across your marketing channels. GeoLift uses the latest developments in geo-experimentation to identify optimal areas to run your experiment in, ensuring that your results are accurate and unbiased, and because it is open-source, GeoLift is flexible and transparent and can be customized to fit your needs. Understanding the true incremental value of your marketing with GeoLift can help you calibrate your existing reporting models like attribution or marketing mix models, allocate budget across channels more effectively, and make better business decisions. GeoLift is a resilient lift measurement solution for the changing ads landscape, designed with now in mind. - Meta"
Why Lift Analysis?
Lift analysis is a technique for determining how a campaign affects a key indicator. You may track variations in metrics like engagement, impressions, conversions, clicks, etc.
The percentage rise or decrease in each metric for users who were recipients of a campaign, against a control group, i.e, a group that was not presented with the campaign, is termed as lift.
In simpler terms, lift analysis compares users who receive a campaign versus users who do not receive the campaign in order to determine which group is better off, thereby learning the effectiveness and impact of the campaign.
How to use Lift Analysis to your advantage?
Determining the lift by making use of a control group is the only way to ascertain the true impact of an ad campaign. Lift analysis is a game-changer and can help businesses to:
- Figure out whether their ad campaign is causing short-term spikes in engagement or long-term increases in loyalty and app usage
- Attribute revenue directly to marketing strategies
- Save time and prevent them from running campaigns in places with high click rates but low sales.
- Track repeat conversions rather than just one-time conversions
Let us suppose that you have an Online Shopping App, and run a push notification campaign to offer new customers 10% off their first order made on the app, for the next 7 days.
You choose two location combinations in your consumer base, making them the A/B groups while considering the rest of the locations as the control group. The control group doesn’t receive the 10% off offer notification, while the A/B groups get 2 different variants of the same offer.
Variant A :
10% Off Your First Order for the Next 7 days! Are you new here? Use the code 10%OFF! at checkout for 10% off your first order. Thank you for giving us a shot!
Variant B :
Now all days are saving days! Avail of this offer within the next 7 days and enjoy the cost-saving benefits with 10% Off Your First Order.
Now, after the test period of 7 days, the results that you get are:
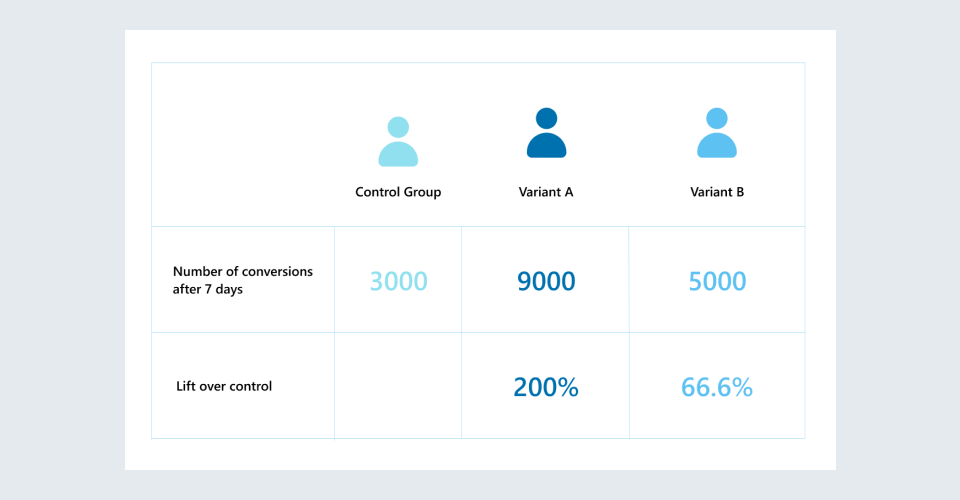
Here, the number of conversions refers to the number of customers who availed of the offer within 7 days. We see that Variant A performs exceptionally well, causing a lift of 200% over the control group. However, Variant B causes a lift of only 66.6%, which is inconsequential as compared to that of Variant A’s. Therefore, upon observing the results, you would make the wise decision of continuing with Variant A of the push notification campaign and dropping the other one.
Before going any further, let us delve into and understand some important jargon:
- Statistical Significance: The notion that a result from data acquired by testing or experimentation is not likely to occur arbitrarily or by chance, but is instead likely to be due to a specific cause is known as statistical significance.
- Minimum Detectable Effect (MDE): The minimum detectable effect refers to the minimum relative gain over the baseline that you are willing to detect in the test, which you would identify as an observation of a certain degree of statistical significance.
- Average Estimated Treatment Effect (ATE): It is a measure that is used to calculate the difference between the average of the outputs of the test group and the control group, thereby comparing the level of contrast between the both of them.
What does GeoLift do?
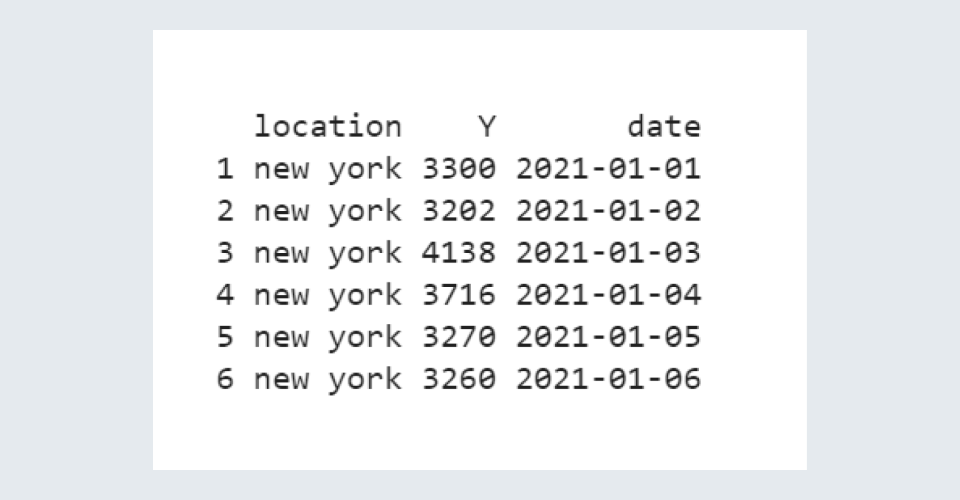
To understand the working of the GeoLift, let us consider the ‘GeoLift_Pretest’ dataset included in the GeoLift package, which includes the simulated data of 40 cities in the USA, across a period of 90 days.
The GeoLift_Pretest dataset consists of three variables:
- location (city)
- Y (total number of conversions each day per location)
- date (in “yyyy-mm-dd” format)
The GeoLift is capable of performing the following tasks:
- Handle Data Preprocessing
Upon feeding the dataset into the GeoDataRead() function, it:
- Assesses the dataset
- Handles locations with missing data by figuring out the best method of imputation for that case
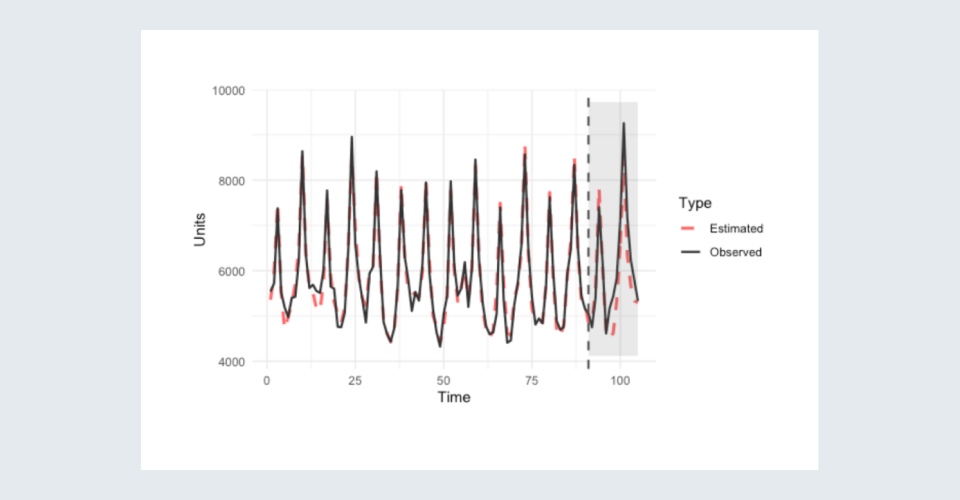
- and transforms the dates in the Date column to timestamps
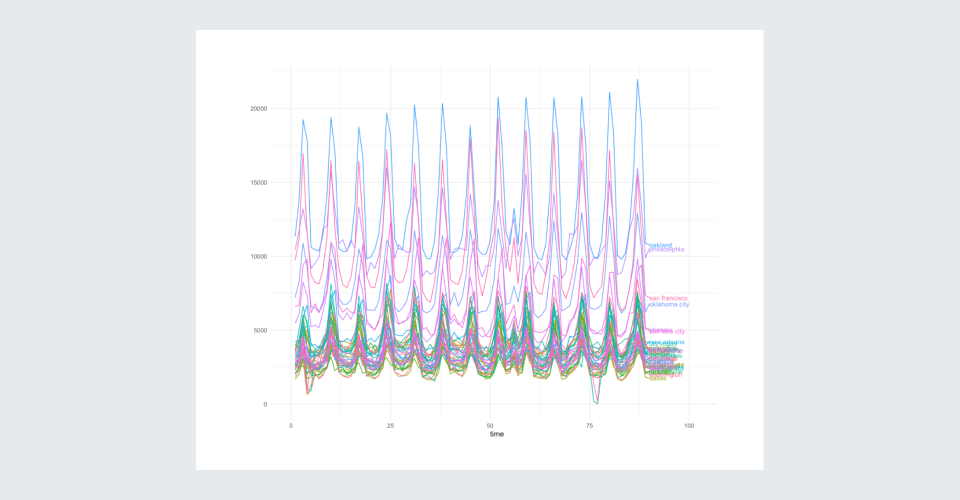
After being processed, the time series would look something like this, indicating a similar pattern being shared across most locations:
Carrying out Power Analysis
Power Analysis refers to a rigorous and comprehensive statistical analysis to extract important information from the data, which brings us one step closer to a successful test. It helps us find key parameters like:
- The optimum number of test locations
To find out the optimum number of locations, in which running our test would yield the best results, we use the NumberLocations() functions in the GeoLift package. It runs by simulating a massive number of tests and evaluating their outcomes.
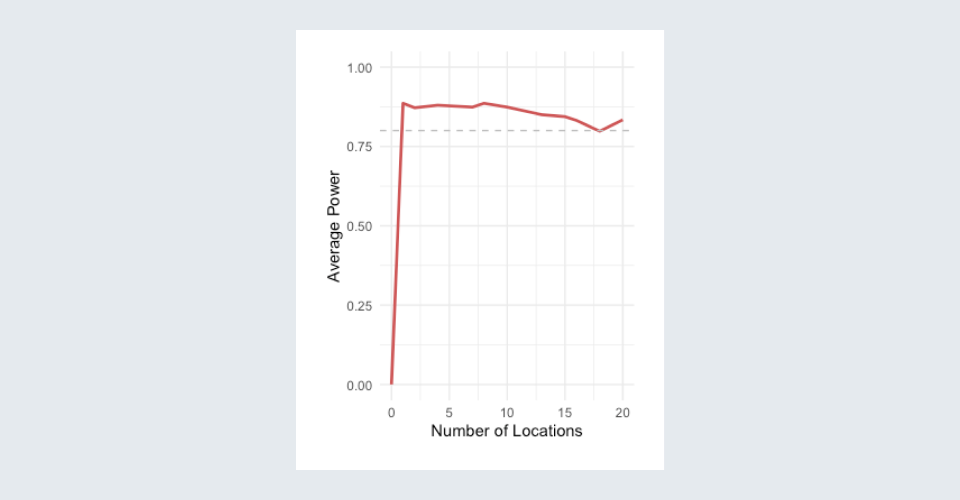
Insight: This plot of Average Power vs. Number of Locations helps us observe that we can get a well-powered test even from just a few locations. It gives a good start to our analysis to know that we can run the test only in a few locations, yet still obtain optimum inferences from it.
Probable Action: We would choose around two, or a maximum of three locations to run the test in, so as to get the best results with the least effort.
- The ideal test and control location
After determining the optimum number of locations, we can move ahead to work out the best combination of test locations in which to run the test. The GeoLiftPower.Search() function does that for us by providing us with a ranking of various location combinations.
After determining the optimum number of locations, we can move ahead to work out the best combination of test locations in which to run the test. The GeoLiftPower.The search () function does that for us by providing us with a ranking of various location combinations.
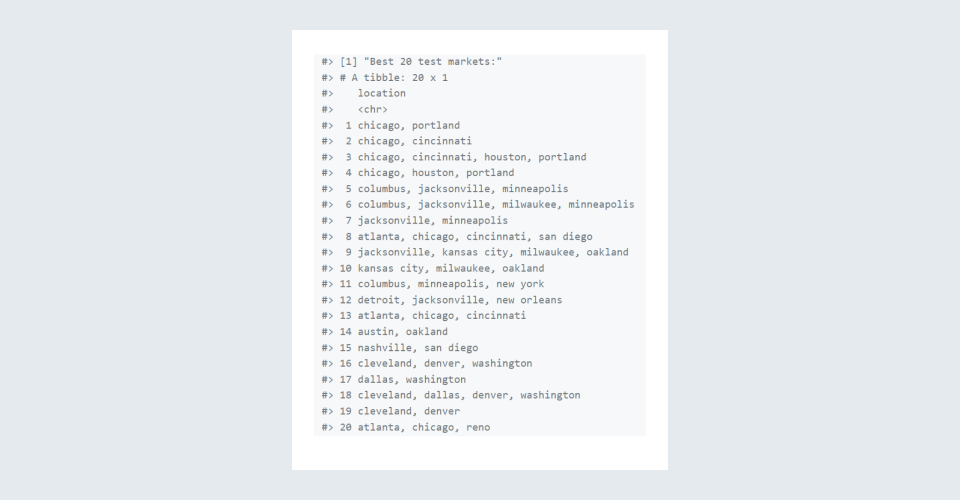
Insight: We can see that the most suitable test locations combination comes out to be Chicago and Portland, ranked as #1, followed by Chicago and Cincinnati.
Probable Action: We would implement our test in one of the top-ranking markets while putting all the other cities in the dataset in the holdout group.
The Minimum Detectable Effect to obtain substantial results
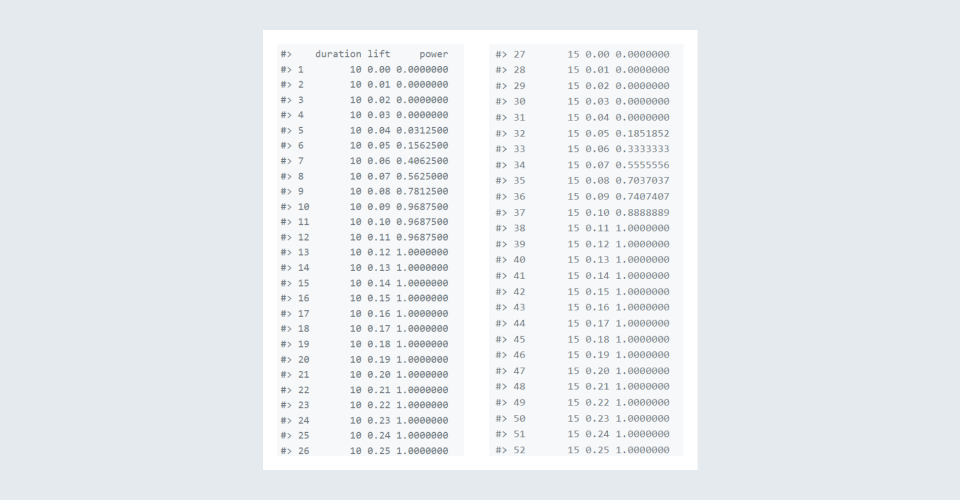
Although the GeoLiftPower.Search() showed us which test and control markets were able to reliably produce well-powered results in a Synthetic Control test, it did not calculate the lift we would need to get that powerful test. As a result, we'll now employ the GeoLiftPowerFinder() method, which investigates the Minimum Detectable Effect that a combination of test and control groups can produce. We run the function to show the results in the top 4 location combinations for two probable durations of 10 and 15 days, respectively.
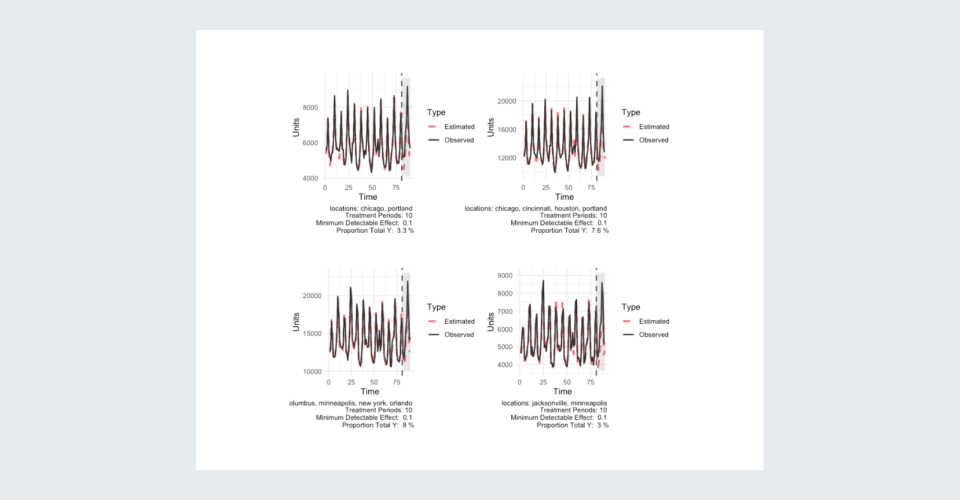
Insight: The results show that Chicago and Portland are the best cities to perform the test in, based on stability, and a small and certain Minimum Detectable Effect.
Probable Action: Based on the results, we would finalize the cities of Chicago and Portland to be the two cities in which we will conduct our test.
Suitable test duration and a ballpark for the budget required to run the test
Subsequently, specifying all of our obtained optimal parameters, we can move ahead to find out what will be the most suitable duration for the test, as well as determine the approximate budget required to implement it. To do this, we use the GeoLiftPower() function, for which we need to know the Cost Per Incremental Conversion (CPIC). The CPIC will allow us to get an approximate value for the budget needed to obtain the required lift for a well-powered test in the given time frame. In this case, the CPIC used is $7.50.
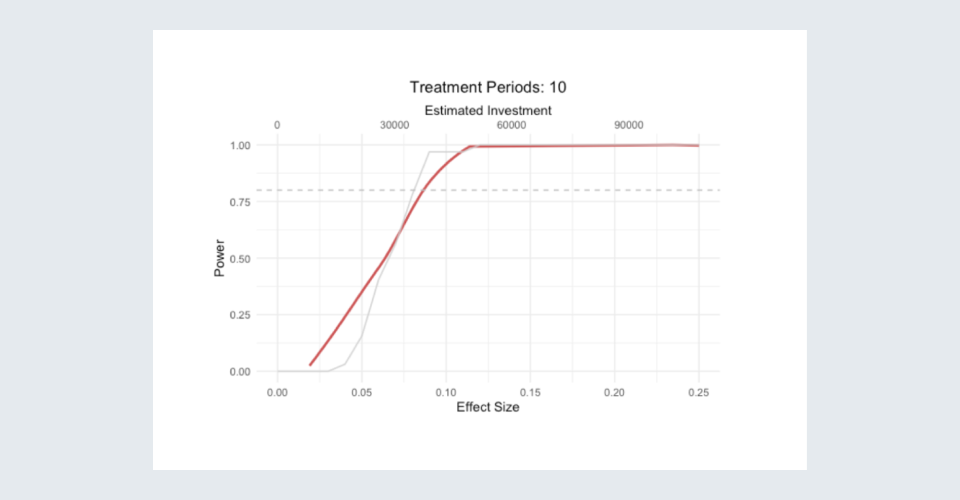
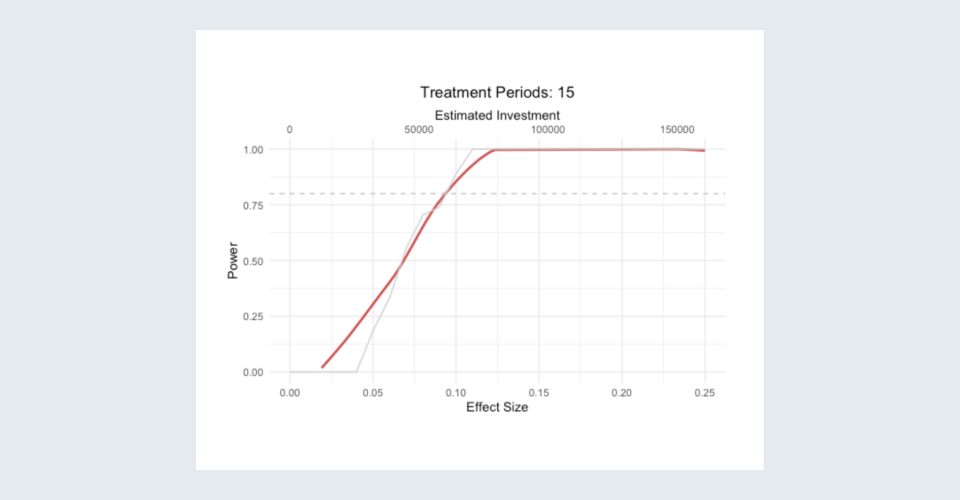
- Insight: The power curves for the tests of both durations show comparable results, having a minimum required lift of around 10%. Furthermore, financial estimates show that a well-powered 15-day test would cost approximately $60,000 at a $7.50 CPIC.
- Probable Action: Based on the findings, the test would finally be set up in Chicago and Portland, for 15 days, costing roughly $60,000.
Blog edit:
Recently, Meta has also added another function to the GeoLift Package, GeoLiftMarketSelection(), which is capable of carrying out all the aforementioned aspects of the Power Analysis at once. Essentially, this function aids in finding the ideal combinations of test and control locations for the experiment by performing multiple simulations and displays important model-fit metrics like the Minimum Detectable Effect and the minimum budget required to execute a successful test, thereby allowing us to choose the test that best meets our objectives and resources in a single step.
Determining the actual lift by analyzing the test results
The next stage in the process is to compute the actual Lift achieved by our marketing campaigns carried out on the test locations after the scheduled test duration of 15 days.
For this purpose, let us consider the GeoLift_Test dataset included in the GeoLift package, which has the resultant sales after the 15-day test period. To do so, we use the GeoLift() function, which takes the GeoLift data frame as input, along with information about the test, such as which cities were in the treatment group, when the test began, and when it concluded. The results we get are in the following form:
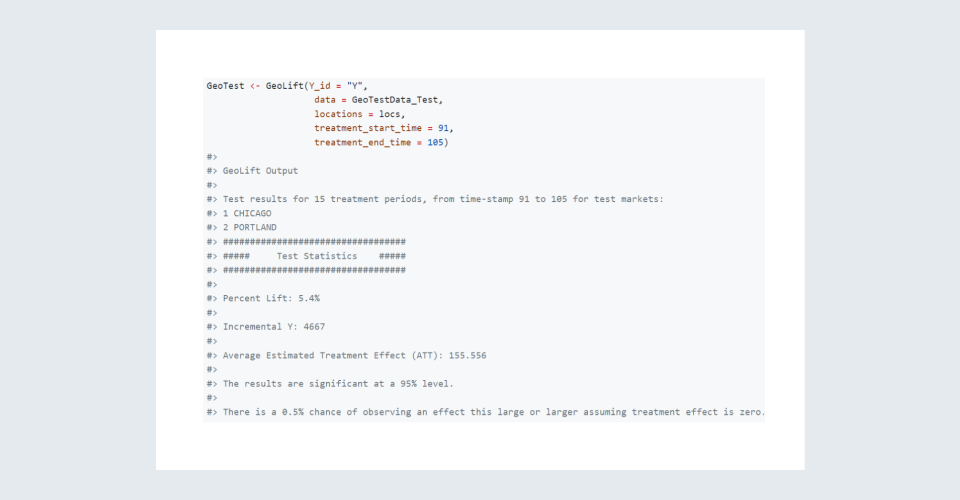
Insight:
The results of the test show that the marketing campaigns caused a 5.4% lift in the number of units sold, corresponding to 4667 additional units sold for this 15-day test. Moreover, per day of the test, the Average Estimated Treatment Effect (ATT) is 155.556 units. Interestingly, we note that these findings are statistically significant at a 95% level. Additionally, if the treatment effect was zero, there would be only a 0.5% probability of witnessing an impact of this magnitude.
Since the statistical significance of the results is very high, and the probability of witnessing such an effect without any treatment effect is negligible, it is safe to say that these outcomes are highly unlikely to be a consequence of chance, which, in effect, validates our results.
Conclusion
GeoLift is a robust lift measurement solution and a potent tool for analyzing a business’ advertising strategies. It can help them with wise decision-making and by course-correcting their marketing methods. GeoLift is capable of coping with the ever-shifting advertising ecosystem and can help businesses correctly quantify the effect of their marketing. Moreover, it is extremely adaptable to the needs of different businesses and is also useful for those that can't employ other assessment strategies owing to data limitations. GeoLift is an indisputable way of moving ahead into the future, the growing consciousness towards the ‘privacy-first’ culture making it more essential now than it has ever been.
To learn more about GeoLift and how it works, visit here.
