Introduction
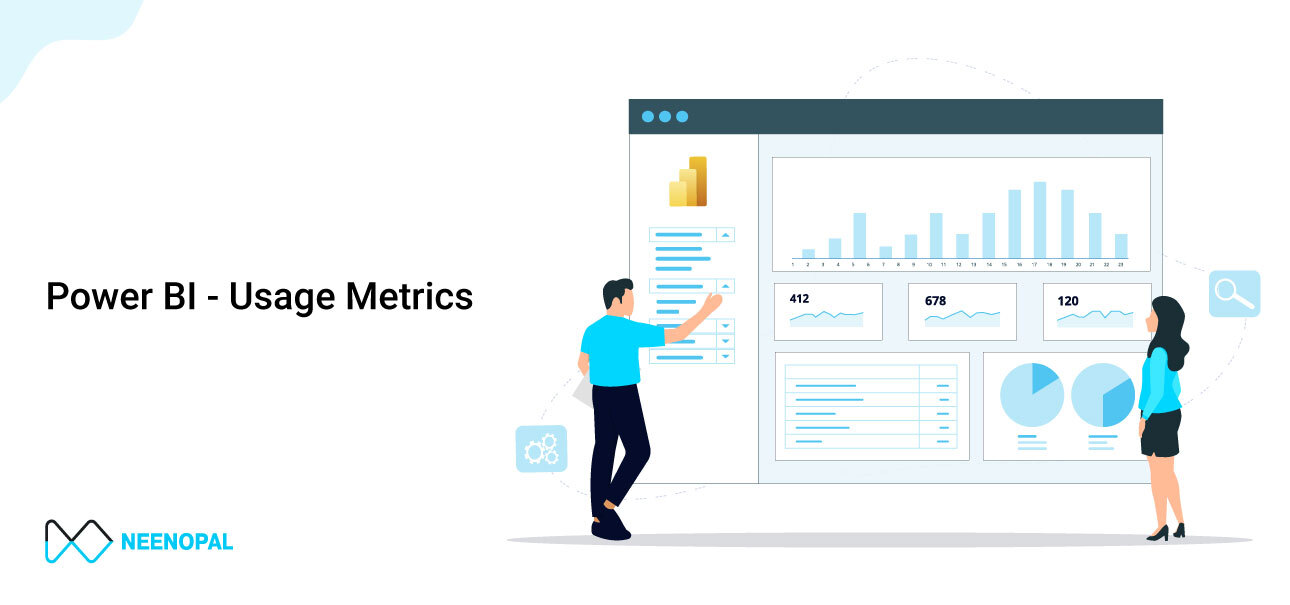
An interesting feature provided by Power BI, Report Usage Metrics, allows you to assess the usage of reports published. This includes no. of views, no. of shares, information about users, along many others.
From a developer's perspective, this turns out to be very useful as it
- Helps understand users’ behavior and preferences
- Helps understand the strengths and shortcomings of developed reports
- Helps improve developed reports
- Helps in improving the quality of upcoming reports
- Gives input on which reports are no longer needed
However, as you may find out later in the blog, the utility of this feature is not limited to the aforementioned points.
Note: The points marked in the blog as “(preview)” are a part of the new version of usage metrics, which hasn’t been launched as a permanent feature, and is still in preview.
Scope
1. License Requirements - A Power BI Pro or Premium Per User (PPU) license is required to access the usage metrics.
2. Permission Requirements - The options for usage metrics for content creators and collection of per-user data in usage metrics must be enabled by your Power BI admin.
3. Workspace scope - This feature is not available for reports in My Workspace. The usage metrics can be viewed for reports in other workspaces. In addition to this, using customizations (as shown below), usage metrics for all the reports in the concerned workspace can be viewed in one report.
Content
The usage metrics provide a range of useful metrics such as:
- Views
- Viewer count
- Shares
- Report’s rank based on views
- Shares
These metrics are summarized differently:
- Per day
- Per user
- Total
However, the new usage metrics (preview) have some useful and interesting additions, which include:
- Opening time
- Report performance
- Trend charts showing the change in metrics across time
- Distribution Methods
- Consumption Methods (Power BI Service, Power BI Embedded or mobile app)
- Web Browsers used to access
How to View Report Usage Metrics?
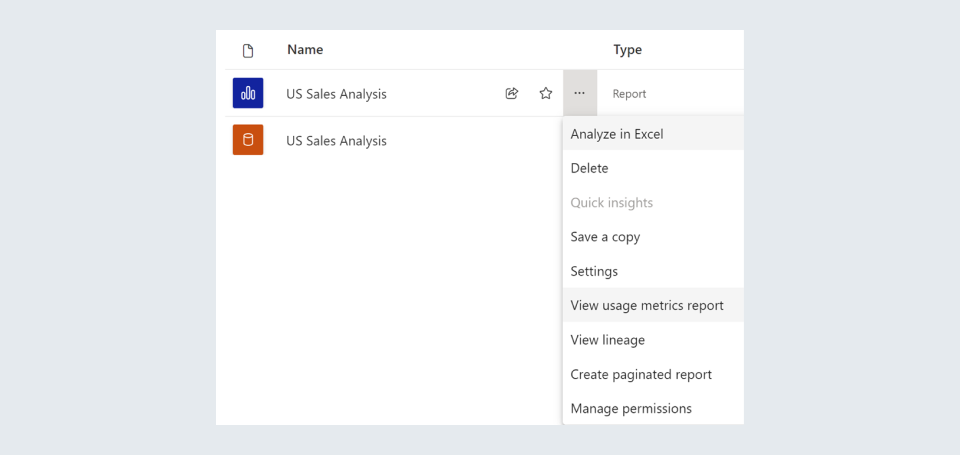
Method 1: In the concerned workspace, you can use the More Options next to your report in the contents list and go to the View usage metrics report option.
Method 2: When the report is open, go to the More Options on the menu bar and go to the Open usage metrics option.

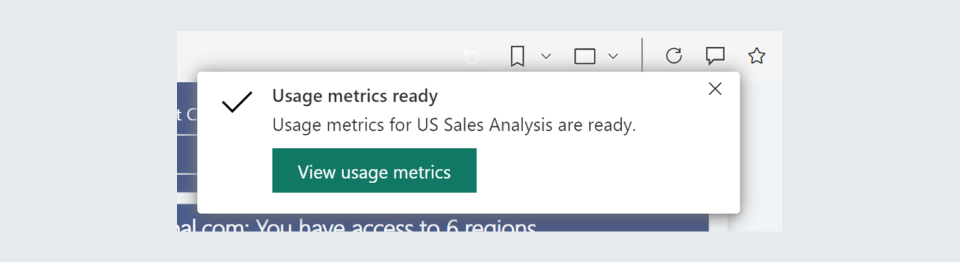
Once the report is ready you’ll get a pop-up titled Usage metrics ready (if not, you can check in the notifications). On clicking the View usage metrics, you’ll be redirected to your usage metrics report.
Herein, you can use the New Usage report on/off to toggle between the Usage metrics report or the New Usage metrics report (preview).

On turning on the New usage report, the New Usage metrics will be created and you’ll be notified.

You can toggle between both the usage metrics reports and analyze how that report is being consumed by the users.
Customization
The Usage metrics also allow customization of the usage metrics reports to the developers for a better use of the provided feature.
Firstly, you need to create a copy of the usage metrics report.
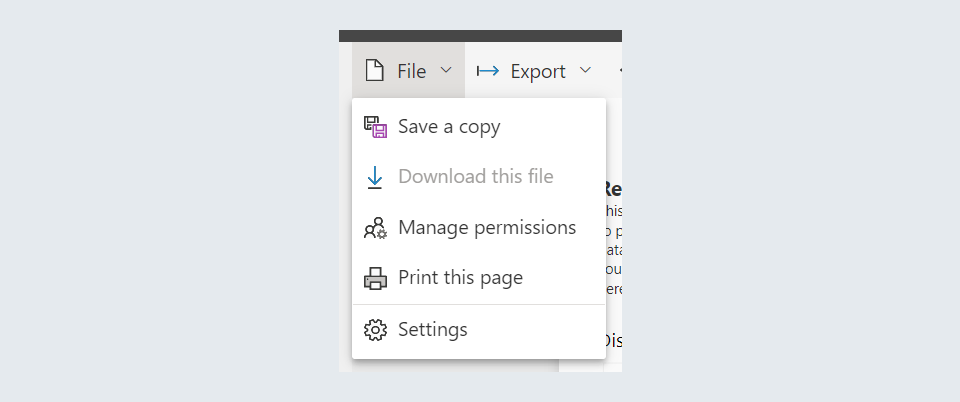
Using the File dropdown in the menu bar and the Save a copy option, we can also convert the usage metrics report to a regular Power BI report.
This makes the usage report easily accessible and also opens up opportunities for customization as needed. You’ll be able to find the copy created in the selected workspace.
1. Viewing Usage metrics of all reports in the workspace
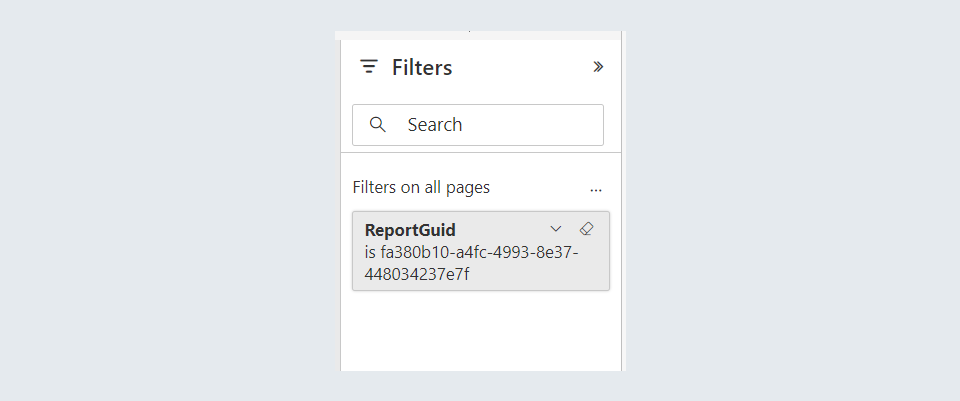
On opening the copy of the usage metrics, you’ll be able to see the Filter pane on the right-hand side. In the Filter pane, a filter of ReportGuidis applied. This filter decides which of the reports in the workspace are being shown in the opened usage report. On clearing the filter, you’ll be able to view usage metrics for all the reports.
2. Customizing Reports in Power BI Desktop
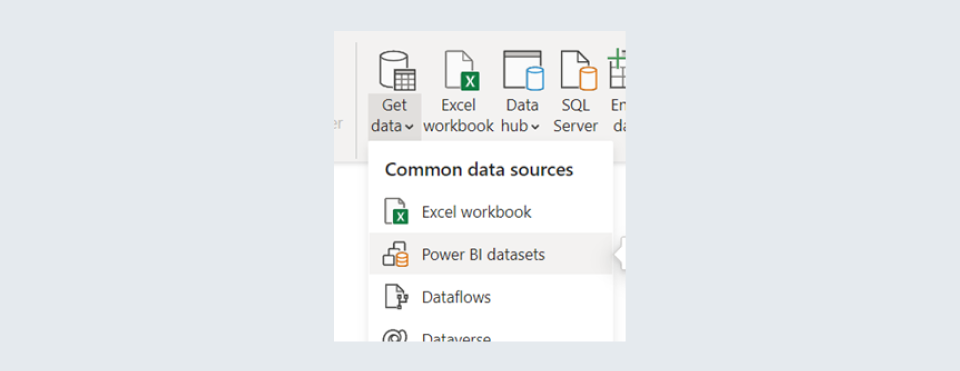
Using Power BI Desktop, we can connect the usage metrics dataset to a report.
In the Get Data dropdown of the Home tab, we can go to Power BI datasets and connect to the Usage Metrics dataset. This allows a free range of analyses to the developer for the usage metrics.
3. Analyzing Usage Data in Excel (preview)
After opening the copy of the usage metrics report, you can go to the File dropdown of the menu bar and select the Analyze in Excel option.

Following this, you’ll receive a pop-up stating that your Excel file is ready on OneDrive. The Excel will contain an empty Pivot Table which can be used to analyze the data.

Dataset Credentials
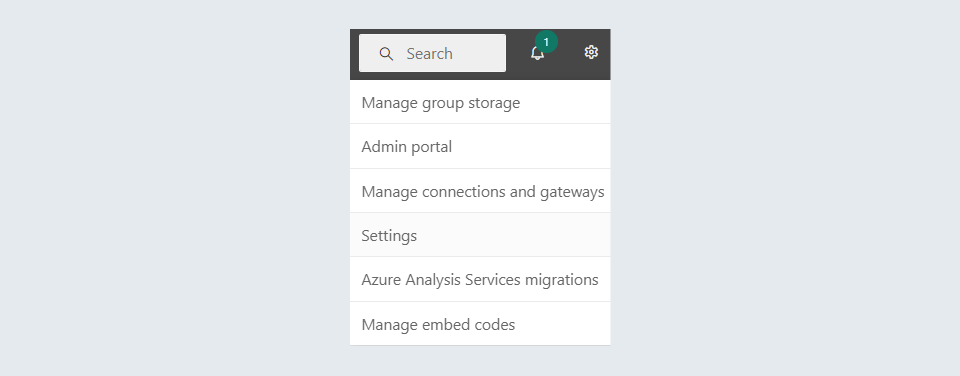
In case of the expiry of credentials, you can take over the usage metrics datasets. You can go to the Settings option following the Settings icon at the top right and the Datasets section. This is also useful in case the dataset owners leave the organizations.
Limitations
- Usage metrics report is not available for My Workspace.
- Sharing is disabled for the usage metrics report.