Salesforce reports and dashboards represent the analytical aspects of the CRM. They characterize the data into pie charts, graphs, tables, gauges, scatter charts, metrics, funnel charts, and other visual representations. Salesforce Dashboard permits us to represent and visualize many reports in a single dashboard page layout by adding different dashboard components.
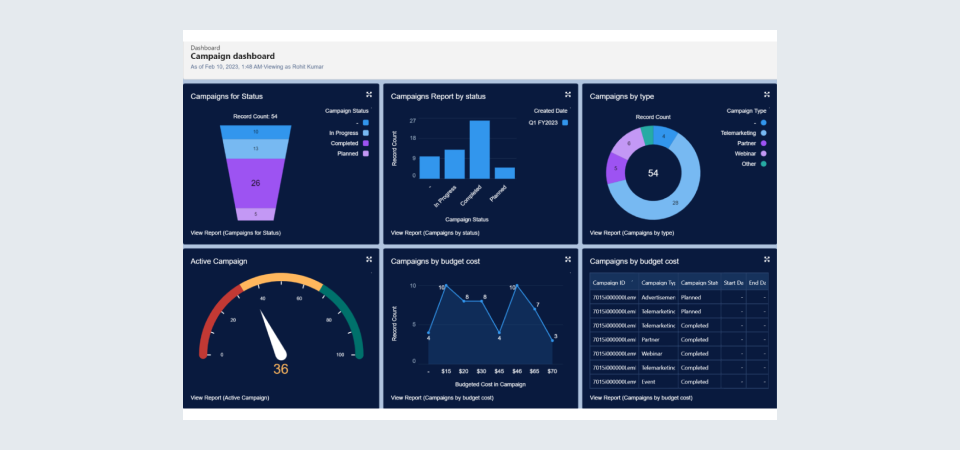
Campaign Dashboard
Overview:
- Campaigns for Status dashboards analyze the campaign's status, and we can easily find out the number of campaigns with a particular status.
- The campaigns Report by Status dashboard visualizes the campaigns based on their status for the current quarter. We can easily analyze the number of campaigns status every quarter.
- The Active Campaigns dashboard shows the total number of active campaigns.
- Campaigns by Budget analyzes the campaigns on the budget so we can easily find the highest budget cost campaign.
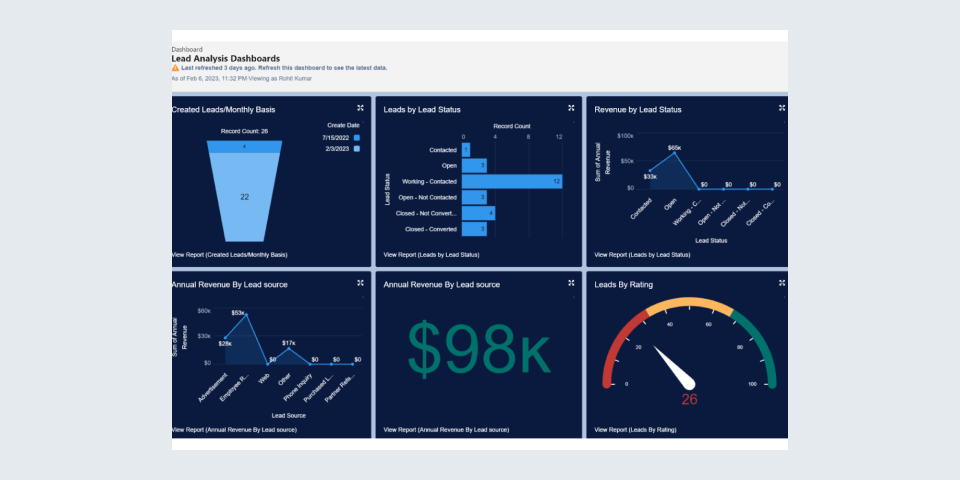
Lead Dashboards
Overview:
- Created Leads/Monthly Basis dashboards are used to analyze the lead creation monthly. A sales manager can easily analyze the number of leads created each month.
- Leads by Lead Status Dashboard shows the status of a lead. A Sales Manager can easily analyze the lead status, which helps them to work on the most probable lead.
- Revenue by Lead Status analyzes the revenue falling under each lead status so that we can predict the revenue generated by those leads.
- The Annual Revenue by Lead Source dashboard shows the annual revenue generated based on the lead source. This helps an organization focus more on those areas where they are getting the least number of leads.
- The Leads by Rating dashboard helps a sales representative analyze the leads according to their ratings. For example, a Hot Rating Lead should be more valuable than the Warm and Cold Ratings Lead.
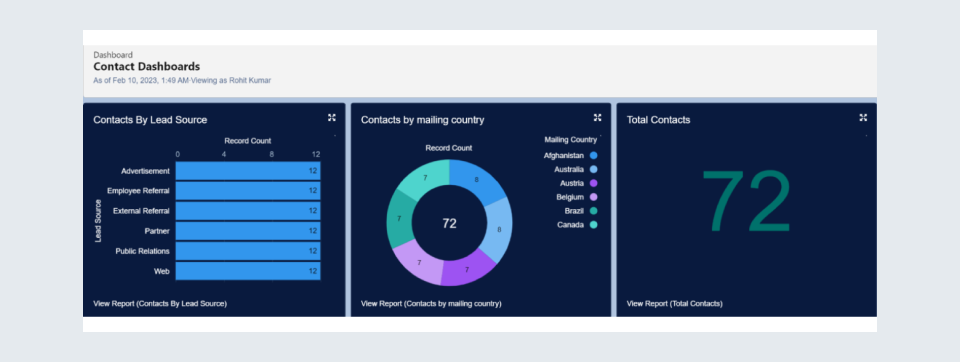
Contact Dashboard
Overview:
- Contact by Lead Source gives an overview of contacts based on lead source.
- The Contact by Mailing Country dashboard is used to visualize the records of contacts based on the mailing country so that we can easily find out the contact of a specific country.
- Total Contacts show the total number of contacts in an organization.
Opportunity Dashboard
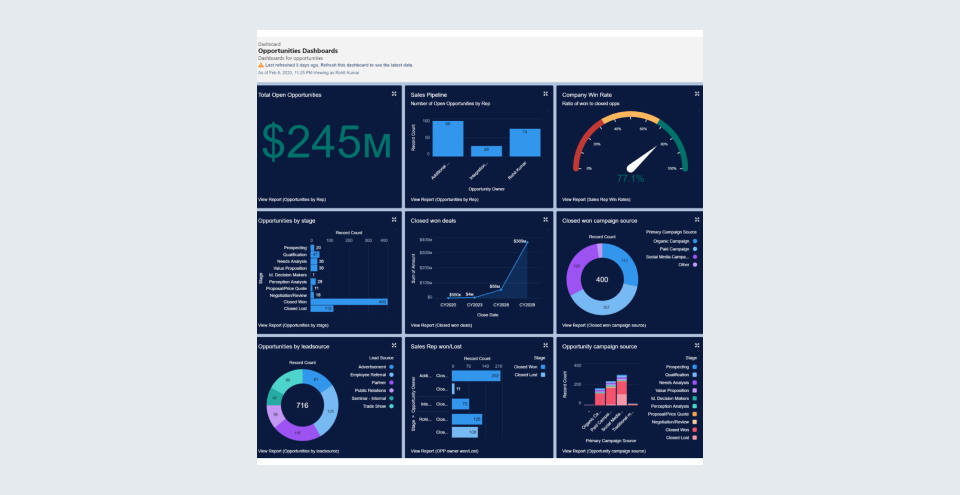
Overview:
- The Total Open Opportunity dashboard calculates the total open opportunities to anticipate the revenue from potential customers.
- Through the Sales Pipeline dashboard, we can visualize Open opportunities per sales representative.
- The Company Win Rate dashboard visualises the entire company win rate for opportunities.
- Opportunities by Stage dashboard analyzes the number of records that fall under each stage of opportunities.
- Opportunities by Deal dashboard analyzes the revenue generated from won deals each year.
- Closed Won Campaign Source dashboard visualizes the won deal records based on the campaign source.
- Opportunities by Lead Source dashboard analyzes the number of records that fall under each lead source of opportunities.
- Sales Rep Won/Lost dashboard can easily find closed won and lost deals revenue from each sales rep.
- Opportunities Campaign Source Dashboard analyses opportunity stages based on campaign source.