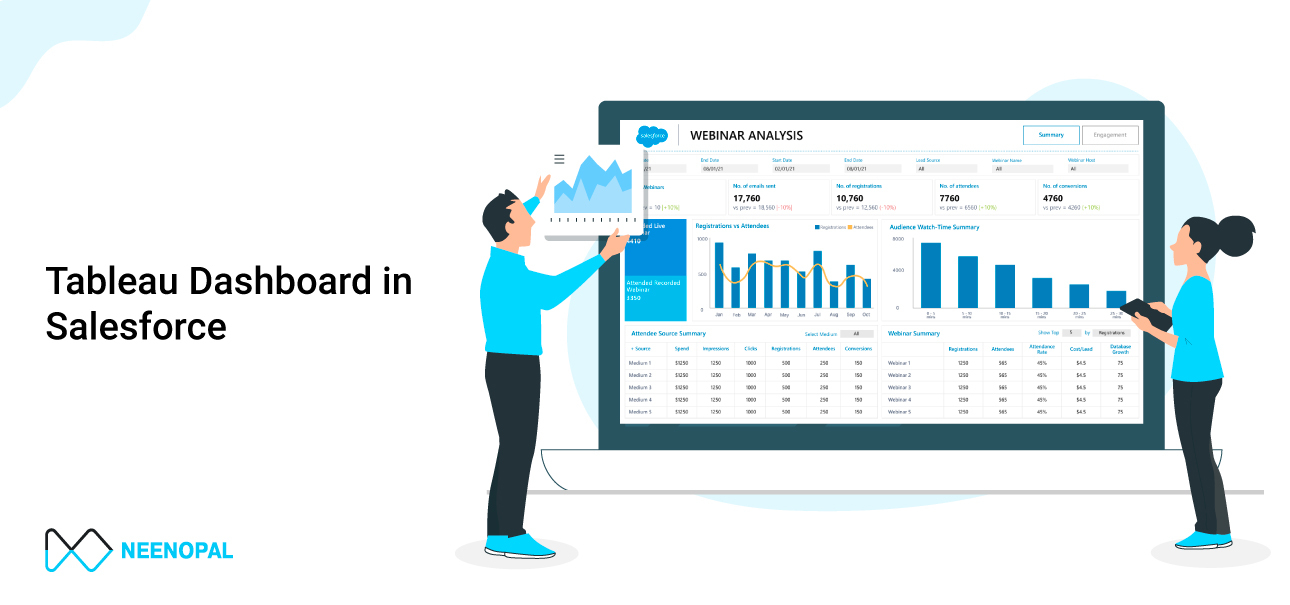
Salesforce has its dashboard & reports, but we are trying to enable the Tableau dashboard because it is used to visualize and analyze data more effectively. When account managers and sales representatives need insights from Tableau visualization, they might be unable to because they don't have hands-on experience with Tableau.
However, answering the 'why' does not answer more fundamental questions like:
- How do you enable the Tableau dashboard in Salesforce?
- What process yields the least resistance and the best results?
- What are the prerequisites for enabling the dashboard?
- What are the limitations of connecting Tableau to Salesforce?
This blog addresses the common queries in connecting Tableau dashboards to Salesforce while walking you through a step-by-step process of enabling the dashboard.
Steps for Enable Tableau Dashboards in Salesforce
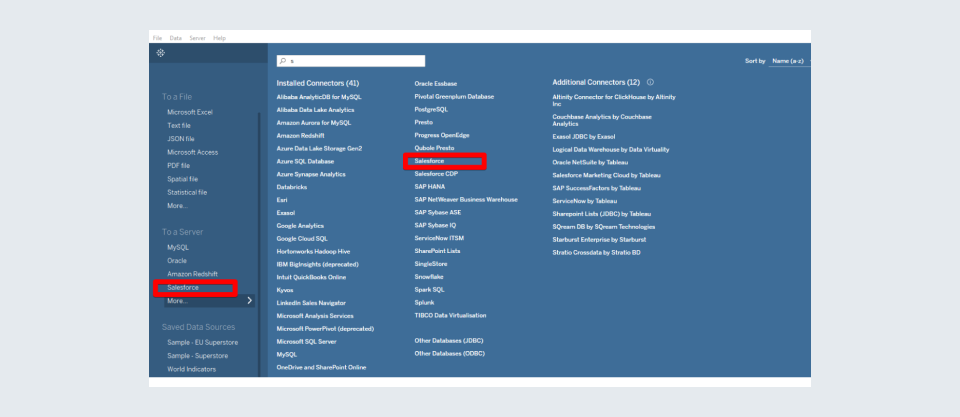
Step 1: Configuring with the help of Tableau's in-built Salesforce connector
To configure Tableau with Salesforce, execute your Tableau workstation. Then, click the connection to the server. A new window will appear where you can select your database. Click on Salesforce from the list of options.
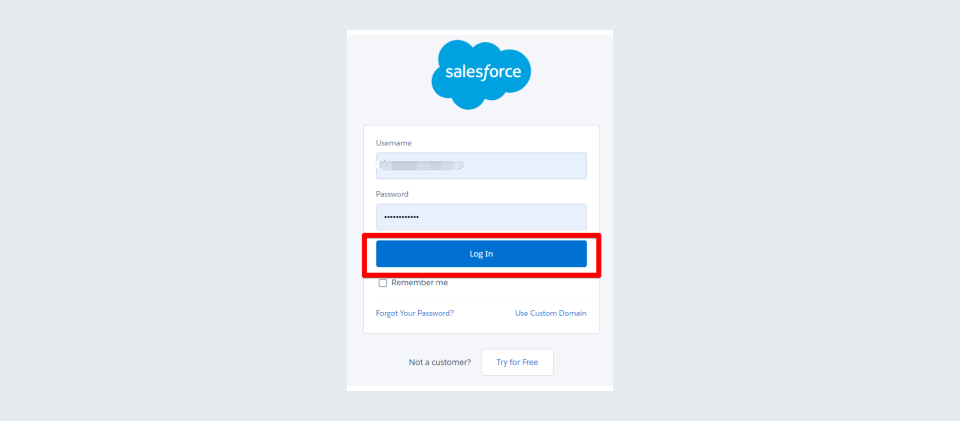
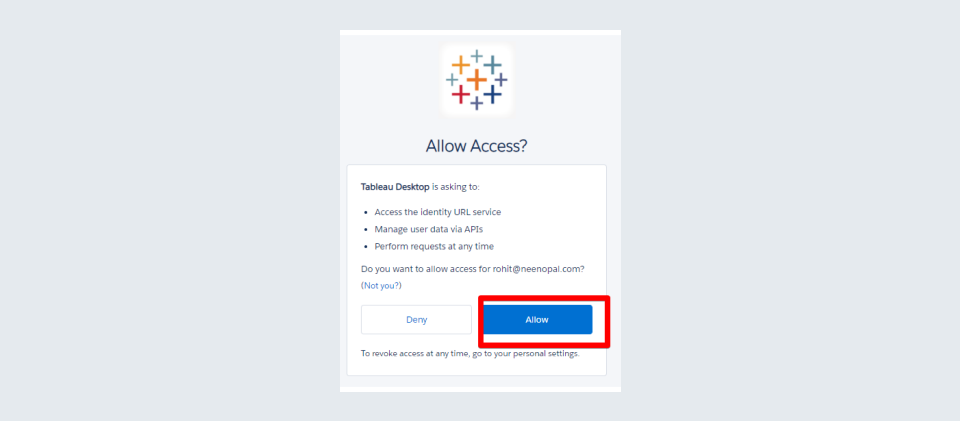
A new screen will ask you for your Salesforce account credentials, where you will need to sign in to your account. Once logged in, you must provide access by clicking on another pop-up window.
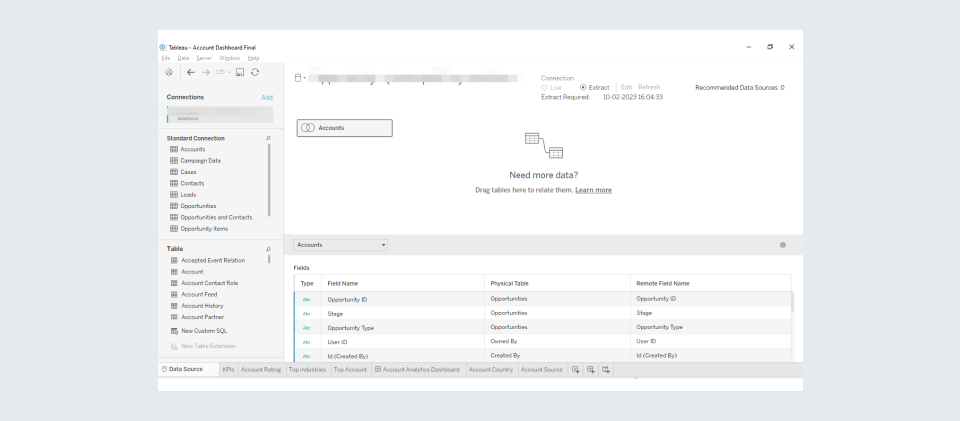
Step 2: Configuring Data Sources:
Tableau allows us to use the standard connection to use predefined queries and objects and simply drag in the table canvas. Alternatively, you can create custom connections where you can manually select objects per your scheme by dragging them onto the canvas.
This is how you can connect Salesforce to Tableau. Now click on the sheets tab to begin the analysis.
How to Refresh Salesforce data:
After data extraction, you can refresh or expand the entire data after Extracted Data includes one of the salesforce objects that have been added or changed since the last incremental refresh. The results will show the salesforce objects that have been added or changed since the last incremental refresh in the preceding 30 days. To refresh data, select Data> [data source name] > Extract> Refresh (Incremental) | Refresh (Full).
Another way to enable the tableau dashboard in Salesforce:
To activate the Tableau dashboard in Salesforce, install the Tableau Viz LWC from the Salesforce Apps Exchange. You can also enable either of these web tabs, visual force pages, and lightning web components. You can copy and paste the integrated URL from Tableau Cloud, Tableau Server or Tableau Public.
Limitations
- Tableau Viz LWC only supports Salesforce Lightning. You can use your apex code and visual force page if you want to enable Tableau in Salesforce Classic.
- Using this method, you cannot connect with real-time data while transferring salesforce data to Tableau. However, you can still refresh the data.
- There is a 4096-character limit while transferring Salesforce data to Tableau, resulting in a failed extraction of some fields.
- Whenever a Salesforce connection is included in the multi-connection data source, the data source won't support it.
The following is an example of a dashboard enabled on a Salesforce homepage for Account Object Analysis.
Account Analytics Dashboard:
This account analytics dashboard is used for maintaining relationships with businesses and customers because it provides a comprehensive analysis of the receivables. You can take a look at Views and compare your accounts side-by-side. You can also access specific accounts, including open opportunities and closed timelines.
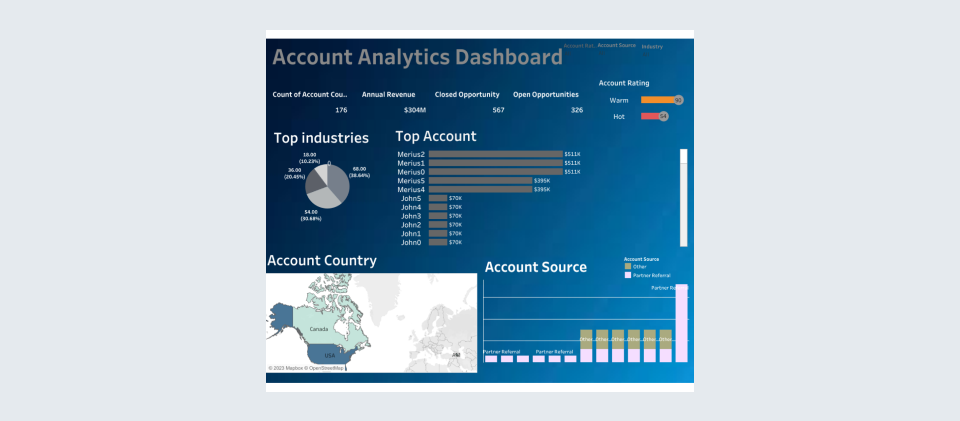
Overview
- This dashboard helps analyse the total number of accounts and open and closed opportunities.
- The Account Source dashboard shows the account's source. An account manager can easily analyze the source, helping them work on the most feasible one.
- The Rating filter in the dashboard helps account managers analyze the accounts' ratings and the annual revenue generated based on the Rating. This helps an organization focus more on areas generating the least ratings and revenue.
- The Top Industries dashboard shows an analysis of the top industries, which helps account managers predict the industries with scope for improvement.
- Top Account Dashboard shows the top account based on their annual revenue.
Account by Rating Dashboard helps an Account manager easily analyze the account according to their Ratings. For example, a Hot Rating account should be more valuable than the Warm and Cold Ratings Account.