
Exporting a Tableau dashboard to Excel is a routine need for analysts, finance teams, and report owners who share numbers with people outside Tableau. However, the native options have real limits. Tableau exports one worksheet at a time as a crosstab, and a full-dashboard export arrives as an image, PDF, or PowerPoint file that can’t be edited.
Closing that gap takes a custom dashboard extension built on the Tableau Extensions API, such as NeenOpal’s Export to Excel. Its Data Edition writes every worksheet’s data to a single .xlsx file as formatted tables, laid out just as they appear on the dashboard. The Dashboard Edition goes further, rebuilding the dashboard in Excel with native chart objects, conditional formatting, and Tableau’s original styling.
To see where an extension adds value, start with what Tableau already offers. Each native export method covers part of the job, and each leaves a specific gap.
Native Ways to Export Tableau to Excel (and Where They Fall Short)
Tableau offers four native ways to get data out of a dashboard, each designed for a specific purpose. To export a Tableau dashboard to Excel as one editable file with its charts included, you’ll need to go beyond these built-in options.
-
Crosstab to Excel is the most direct route to a spreadsheet. In Tableau Desktop, it sits under Worksheet > Export, and on Tableau Cloud and Server, under Download > Crosstab. As Tableau’s documentation explains, you pick one sheet at a time, and its data arrives as a table with your current filters applied. The dashboard’s charts and layout don’t come with it.
-
Download Data (CSV) gives you the summary or underlying data behind a single view. It’s a good fit only when you want raw numbers for your own analysis and don’t need the dashboard’s layout or formatting.
-
Image, PDF, or PowerPoint captures the entire dashboard in one step, which works well for sharing a snapshot. As Tableau’s help pages explain, the PowerPoint option places each sheet on a slide as an image, so the file is meant for viewing rather than editing in Excel.
-
Subscriptions, REST API, and tabcmd help with scheduling and scripting. You still export view by view, and someone with admin or developer access has to set it up.
For a dashboard with six worksheets, that means six separate crosstab downloads. Charts, colour rules, and KPI cards then have to be rebuilt manually in Excel before the executive report is ready for finance leadership or clients.
NeenOpal’s Export to Excel: Choose the Data or the Dashboard
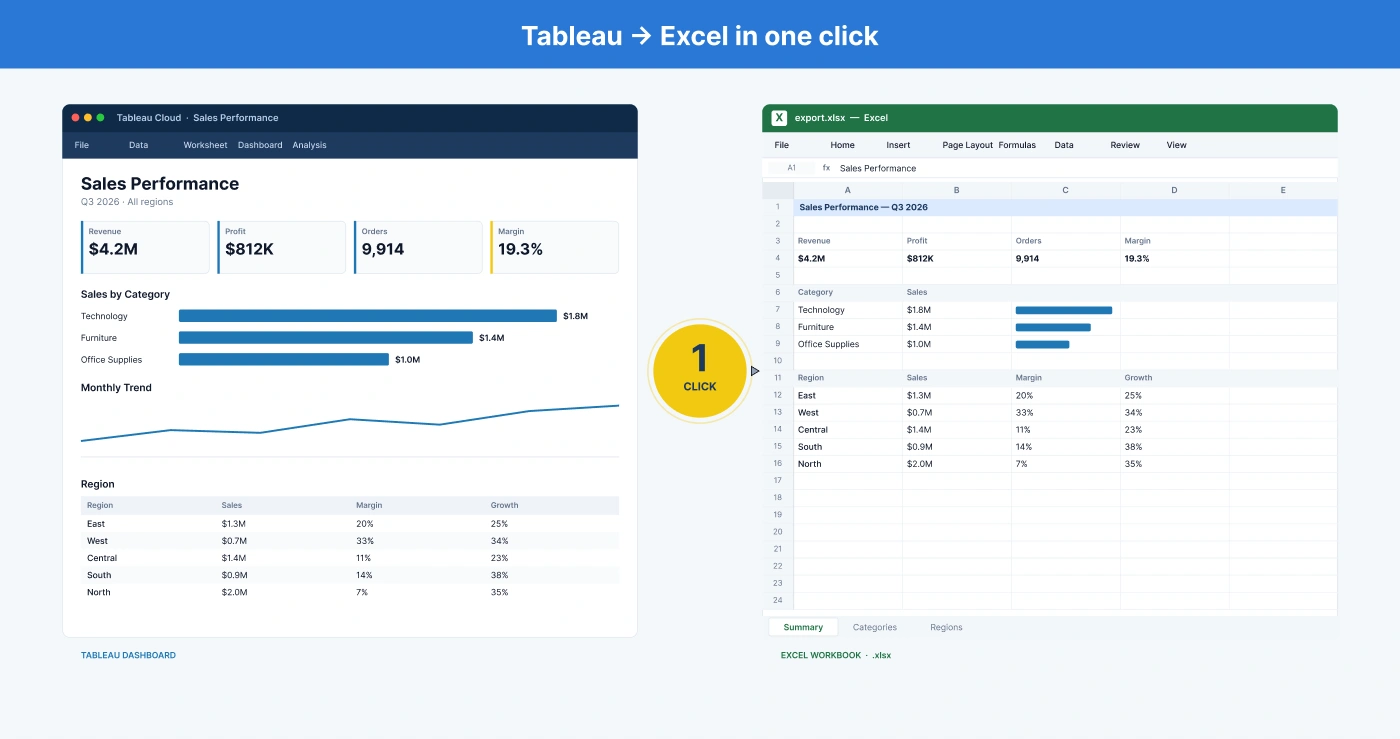
Export to Excel, built by NeenOpal’s Tableau consulting team, is a Tableau export to Excel extension. You drop it on a dashboard, and it sends that Tableau dashboard to Excel in one click. What ends up in the file depends on the edition.
-
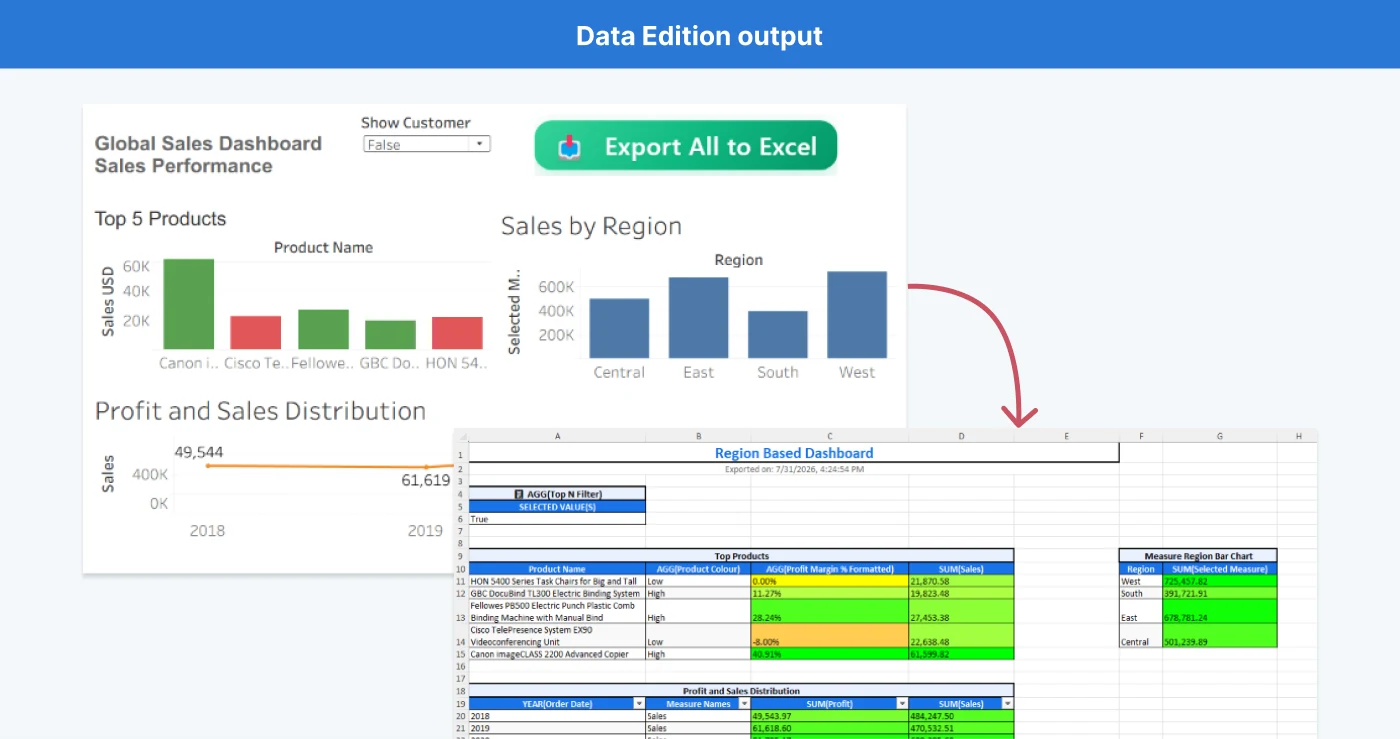
The Data Edition (free) writes all worksheet data, KPI values, and active filters into one workbook as formatted tables, placed to match the dashboard’s layout, so the file reads like the dashboard it came from. It suits analysts who need the numbers for reconciliation or further analysis. Check it out on the Tableau Exchange.
-
The Dashboard Edition rebuilds the dashboard in Excel with native, editable charts, Tableau’s formatting and layout, and conditional formatting applied to real values. It can also export every dashboard in a workbook into one file, with one sheet per dashboard, on Tableau Cloud. Contact NeenOpal's Tableau experts for more details.
How It Works: What Tableau’s Extensions API Can and Can’t See
It comes down to what the Tableau Extensions API is willing to share. An extension can see a dashboard’s data, but it sees very little of the design.
Here’s what the API does give an extension:
- Summary data for each worksheet on the dashboard where the extension sits, formatted values included, so “$1.2M” stays “$1.2M”. It’s the same data our Mark2Table extension turns into dynamic tables.
- Filter and parameter values as they’re currently set.
- The position and size of every zone on the dashboard.
- A little design metadata. Newer Tableau versions also share the workbook’s default fonts and text colours for titles, worksheet text and tooltips, along with which fields drive each chart’s colour, size and labels.
And here’s what it doesn’t: mark colours, how a chart is actually drawn, or any dashboard styling, from backgrounds and borders to banding, text boxes and images. That detail only exists in the workbook XML, the .twb file (which also sits inside every .twbx).
The Data Edition sticks to the API. That’s what lets it support Tableau 2018.2 onward, and it’s also why you get tables rather than charts. The Dashboard Edition reads the workbook XML too. On Tableau Cloud, it finds the published workbook on its own. On Desktop, you select the file once.
Data Edition: Every Table, KPI and Filter in One Excel File
If you only need the numbers in tabular form when you export a Tableau dashboard to Excel, the Data Edition works as a Tableau crosstab alternative. It reads every worksheet on the dashboard in a single pass, so one click on Export All to Excel produces a complete, analysis-ready workbook in place of several separate crosstab downloads.
- Every visible worksheet comes out as a table, placed roughly where it sits on the dashboard. Charts come through as their underlying data, ready for pivots, lookups, or reconciliation.
- Single-value KPI sheets become simple label and value pairs, so headline metrics stay readable instead of turning into stray single cells.
- Numeric columns get a heat-map colour scale, which makes highs and lows easy to spot at a glance. It uses a standard scale rather than your dashboard’s palette.
- Active filters show up as small reference tables. Anyone opening the file later can see which slice of data they’re looking at, which matters for audit trails and shared reports.
- Long tables fold behind an expandable [+] in Excel, so the sheet stays readable and no data is dropped.
- Sheets hidden by Dynamic Zone Visibility (DZV) are left out.
- Only the current dashboard is exported, meaning the one the extension sits on.
Dashboard Edition: The Whole Dashboard, Rebuilt in Excel
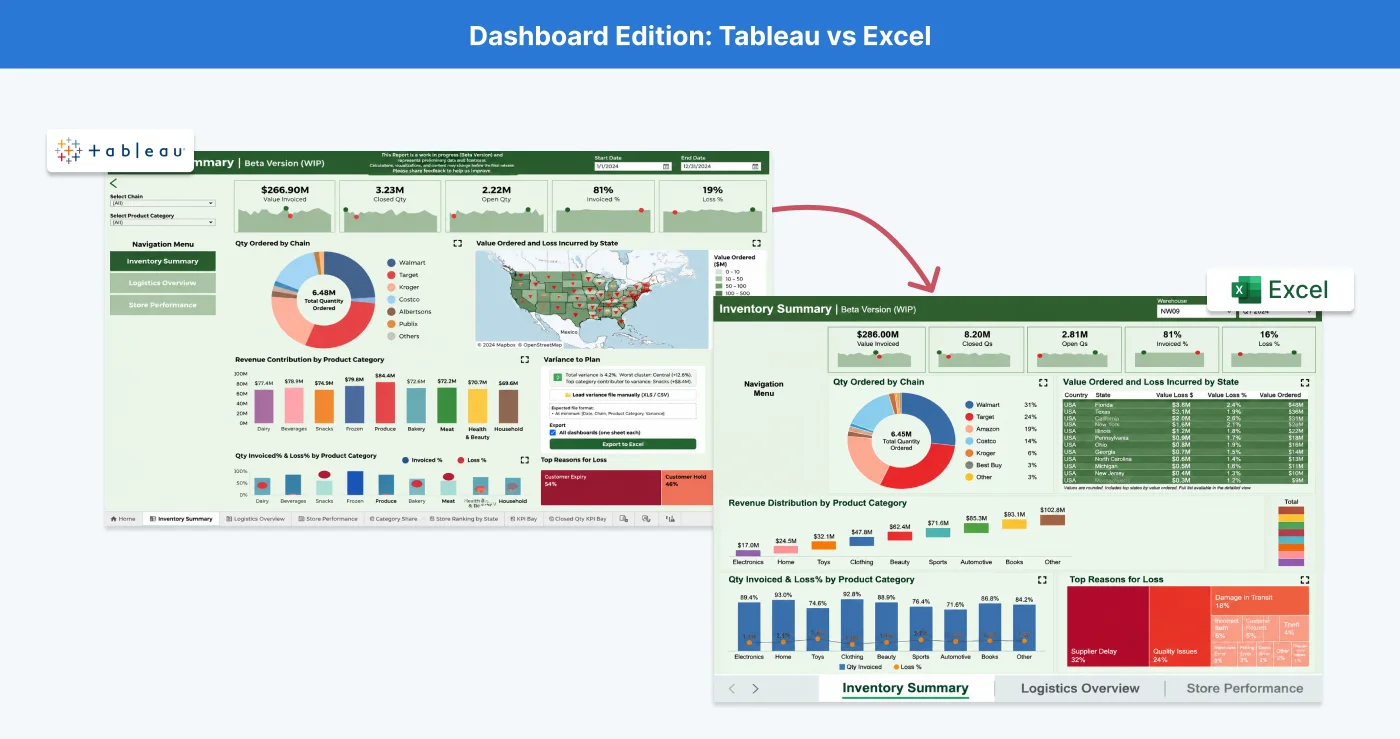
When the report has to look like the dashboard itself, the Dashboard Edition lets you export Tableau to Excel with formatting, charts and layout intact. The result is a fully editable workbook rather than a static snapshot, ready for executive and client reporting.
- Native Excel charts replace Tableau visuals in their original positions, with the same colours, labels and axes. When you export a Tableau dashboard with charts, recipients can restyle them, change the chart type or update the data like any other Excel chart.
- Conditional formatting carries over from text tables. Colour palettes become colour scales, in-cell and diverging bars become data bars, and up/down indicators become icon sets, all applied to real cell values.
- Layout and styling are preserved, including banners, logos, images, background colours, fonts, number formats, borders and banded rows.
- KPI cards keep their caption, border and trend line, while filter and parameter values appear exactly as selected at export.
- All dashboards land in one workbook on Tableau Cloud and Tableau Server. One click exports all Tableau dashboards to Excel, with one sheet per dashboard in Tableau’s tab order, even though the extension sits on only one of them.
- A Conversion Report sheet lists every visual and how it was exported, so nothing is left to guesswork.
- Tables are Excel-ready, with filter dropdowns on every header, long tables grouped behind [+] controls, and an export timestamp on each sheet.
- Access rights stay intact because dashboards are read through the viewer’s own Tableau login, keeping row-level security and permissions in place.
Maps and Sankey charts are exported as formatted data tables, and sunburst charts as donut charts. Waterfall and treemap charts need Excel 2016 or later. On Tableau Desktop, the edition exports the current dashboard.
Security and Data Access: How Each Edition Handles Your Data
IT teams usually want to know about data flow before anything else, so here it is plainly. A viewer can’t export anything they couldn’t already see in Tableau. What changes between editions is where the processing runs.
- Every export runs under the viewer’s own login, which means permissions and row-level security (RLS) behave just as they do in Tableau.
- Network-enabled extensions are blocked on Tableau Cloud and Server until a site admin puts them on the safe list (Tableau’s admin guide covers this). Your admin does it once.
- With the Dashboard Edition, a NeenOpal backend server processes the workbook XML. Viewers sign in to Tableau inside the extension once per browser session.
NeenOpal holds ISO 27001:2022, ISO 42001:2023, and SOC 2 certifications, so its information security controls are independently audited against recognised standards. When a Dashboard Edition rollout goes through vendor or security review, IT and procurement teams have documented evidence to work from instead of starting the assessment from scratch.
Native Tableau vs Data Edition vs Dashboard Edition
|
Capability |
Native Tableau |
Data Edition |
Dashboard Edition |
|---|---|---|---|
|
Whole dashboard in one click |
Only as image, PDF or PowerPoint |
Yes, as data tables |
Yes, with charts, tables and layout |
|
Editable Excel charts |
No |
No (chart data as tables) |
Yes |
|
Tableau formatting kept |
Crosstab only, one sheet |
No (standard heat-map colouring) |
Yes |
|
All dashboards in one file |
No |
No |
Yes, one sheet each (Tableau Cloud and Server; not Desktop) |
|
Setup on Cloud/Server |
None |
Admin adds to safe list |
Admin adds to safe list + viewer sign-in |
|
Where the export is processed |
In Tableau |
In the browser |
NeenOpal backend server |
|
Works with |
All Tableau products |
Tableau 2018.2 and later |
Tableau Cloud; Desktop with workbook file |
|
Price |
Included |
Free |
Contact NeenOpal |
Which Edition Should You Use?
Before you export a Tableau dashboard to Excel, we’d ask one question: who opens the file? If it’s an analyst, they want numbers to pivot and check. If it’s a CFO or a client, they want the thing they saw in Tableau.
- Go with the Data Edition for ad-hoc analysis, for reconciling Tableau totals against your ERP or GL, or for audit snapshots of what the data said on a given day.
- Go with the Dashboard Edition for executive and client reporting, for board packs that must match the dashboard line for line, and for multi-dashboard workbooks going to people who never log in to Tableau.
How to Export a Tableau Dashboard to Excel: Step by Step
Setup is short. An admin does one thing, an author does one thing, and from then on every viewer just clicks.
Data Edition
- Get it safe-listed. On Tableau Cloud or Server, a site admin adds the extension to the safe list. It’s a one-off.
- Drop it on the dashboard. In the dashboard editor, drag in an Extension object and point it at the .trex file you downloaded.
- Allow it. Viewers may see a prompt the first time; they click Allow.
- Export. Hit Export All to Excel.
- Open the .xlsx. It downloads straight to your machine.
Dashboard Edition
- Get it safe-listed. A Tableau Cloud site admin adds the extension to the safe list, again just once.
- Add it to one dashboard. Any dashboard in the workbook works. Publish the workbook afterwards.
- Export. Click Export to EXCEL. Leave “All dashboards (one sheet each)” ticked for the full workbook; untick it if you only want the dashboard you’re looking at.
- Sign in once. The first export in a browser session asks for a Tableau sign-in inside the extension, so it can read every dashboard as you.
- Save it. Pick a folder, or let the .xlsx download.
Get Started
The Data Edition is free on the Tableau Exchange, so you can export your first Tableau dashboard to Excel today. For the Dashboard Edition, or help rolling it out across a Tableau Cloud site, talk to NeenOpal’s Tableau team.
Frequently Asked Questions
1. Can you export a Tableau dashboard to Excel?
Yes, but natively only one worksheet at a time, as a crosstab. If you want the whole Tableau dashboard in Excel from a single click, add an extension like NeenOpal’s Export to Excel.
2. Does it keep charts and formatting?
The Dashboard Edition keeps charts, layout, fonts, colours, number formats, borders and banding. The Data Edition sticks to data tables, with a standard heat-map scale on number columns.
3. Are the charts editable?
In the Dashboard Edition, yes. They’re regular Excel charts, so recipients can restyle them, change the type, or edit the data range.
4. Is it free?
The Data Edition costs nothing on the Tableau Exchange. Dashboard Edition pricing is handled directly by NeenOpal.
5. How do I export all Tableau dashboards to Excel in one file?
Run the Dashboard Edition on Tableau Cloud with “All dashboards (one sheet each)” ticked. Each dashboard becomes a sheet in Tableau’s tab order, plus there’s a Conversion Report sheet.
6. Do recipients need Tableau?
No. Excel is enough, though waterfall and treemap charts need Excel 2016 or later (Microsoft 365 included).
7. What’s the difference between the editions?
Think numbers versus pictures. The Data Edition hands over numbers in tables. The Dashboard Edition hands over the dashboard, charts, conditional formatting, and all.
8. Does the Dashboard Edition work on Tableau Desktop, Cloud, or Server?
It works on all three, with one difference. On Tableau Cloud and Tableau Server, it can export every dashboard in the workbook into one file. On Tableau Desktop, it runs once you select the workbook file, but multi-dashboard export isn’t supported, so it exports only the dashboard you’re on.
9. Which visuals can’t become Excel charts?
Maps and Sankey diagrams, which come out as formatted tables. Sunbursts turn into donut charts. Excel has nothing that keeps Tableau’s map layers or Sankey flows intact.