Faster decision-making
Decision-grade dashboards your leadership actually opens daily.
From deployment and migration to governed dashboards and embedded analytics, NeenOpal delivers Tableau implementation services as one accountable, connected practice.

Enterprises rarely come to us because Tableau is hard. They come because reporting is broken. Analysts are rebuilding metrics in Excel daily, a BI platform that never delivered, or a Tableau environment that's live but poorly built, with slow dashboards and only a fraction of its capability switched on.
NeenOpal closes those gaps with one accountable team of certified Tableau and Salesforce Data Cloud professionals, working across Tableau Desktop, Prep, Server, Cloud, Pulse, Agent, Next, Concierge, and Tableau+. We handle everything end-to-end: deploying, migrating, building, embedding, optimizing, and modernizing, plus developing custom extensions. You're not juggling scattered vendors, resulting in faster decisions, trusted and governed reporting, and deployments that scale without disruption or license lock-in.
Decision-grade dashboards your leadership actually opens daily.

One certified source of truth, not forty conflicting files.

Architecture built to hold as your users and data grow.

Teams answer their own questions instead of filing tickets.

Reporting embedded inside the tools your people already use.
PARTNERSHIP



From first deployment to full-scale optimization, one accountable team handles every stage of your Tableau journey.

Move to Tableau Cloud, or switch platforms entirely, without losing a beat. We rebuild your reports and dashboards, validate them against the originals, and go live only once your team signs off.
Tableau Cloud Migration Services
Design and build dashboards that hold up under daily use. Our in-house design team wireframes the end state first, then our developers build against production data, tuned to your exact business logic, with reusable components and performance baked in from the first calculation itself.
Tableau Dashboard Development Services
Take Tableau outside the Tableau interface. We embed dashboards directly into your product, portal, or internal tools using the Embedding API, with authentication, licensing, and row-level security handled so end users never see Tableau branding.
Tableau Embedded Analytics Services
Prepare your Tableau estate for Tableau Agent and Tableau Next as the platform evolves, so upgrades extend what you already have instead of forcing a re-platform.
Tableau Next Analytics Services
Stand up Tableau right, whether it's a first deployment or a platform move. Our certified consultants start with structured requirement gathering of KPIs, data sources, refresh frequency, and how each team wants to consume reporting, whether desktop, mobile, visual, or tabular. Then we architect security, data, and governance so you scale on solid foundations.
Tableau Platform Migration Services
Roll Tableau out enterprise-wide without losing control. We architect row-level security, folder structure, and content governance so hundreds of dashboards and thousands of users stay organized, while performance holds steady as your data volume and user base keep growing.

Fix a Tableau estate that's already live but underperforming. We run performance audits across queries, data models, and workbook design, then refactor for speed and switch on the capabilities most teams never touch, like Pulse and mobile, so adoption climbs instead of stalling.

Activate Pulse and natural-language Q&A so leaders get metrics as a daily digest. Where a metric needs a rolling or trailing calculation, like a rolling 12-month win rate, that Pulse doesn't support natively, we handle the underlying Tableau Prep transformation that makes it possible.
Every dashboard here is one your leadership actually opens daily, and that's the standard we build to. Here's the kind of decision-grade Tableau work NeenOpal builds across industries, designed by a dedicated in-house design team.
 View
View
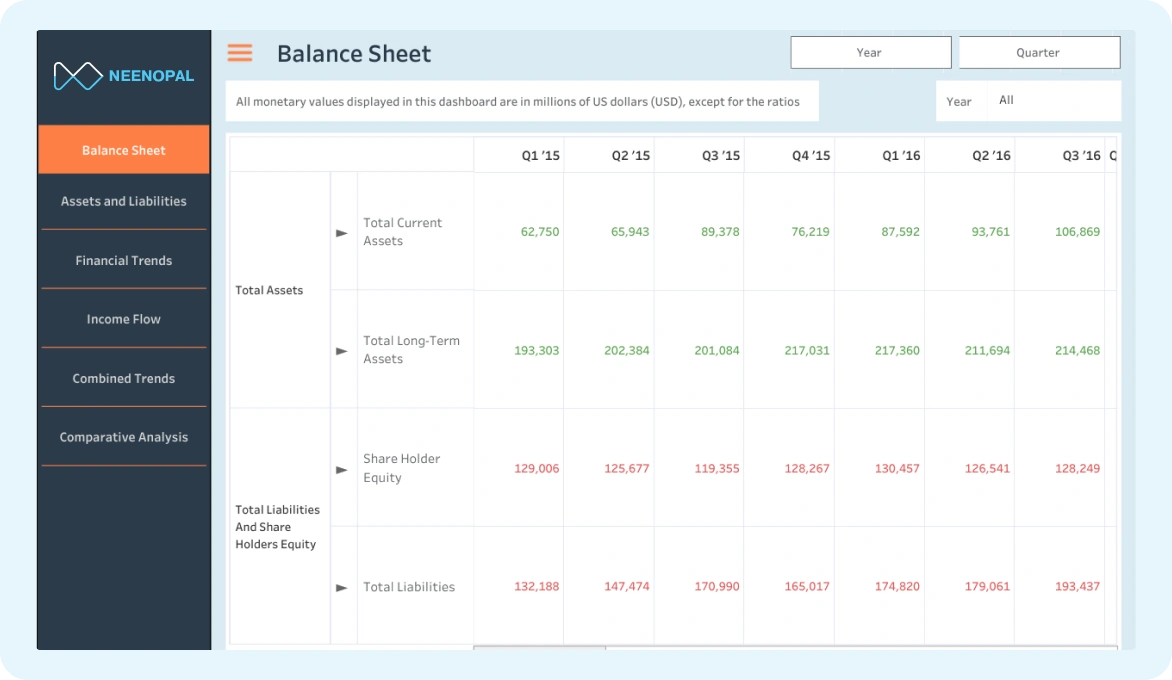
We've built Tableau dashboards that integrate data across finance, HR, sales, procurement, and operations into one governed view, letting leadership see how HR metrics like headcount move financial outcomes like EBITDA, with Row-Level Security controlling exactly who sees what.
 View
View
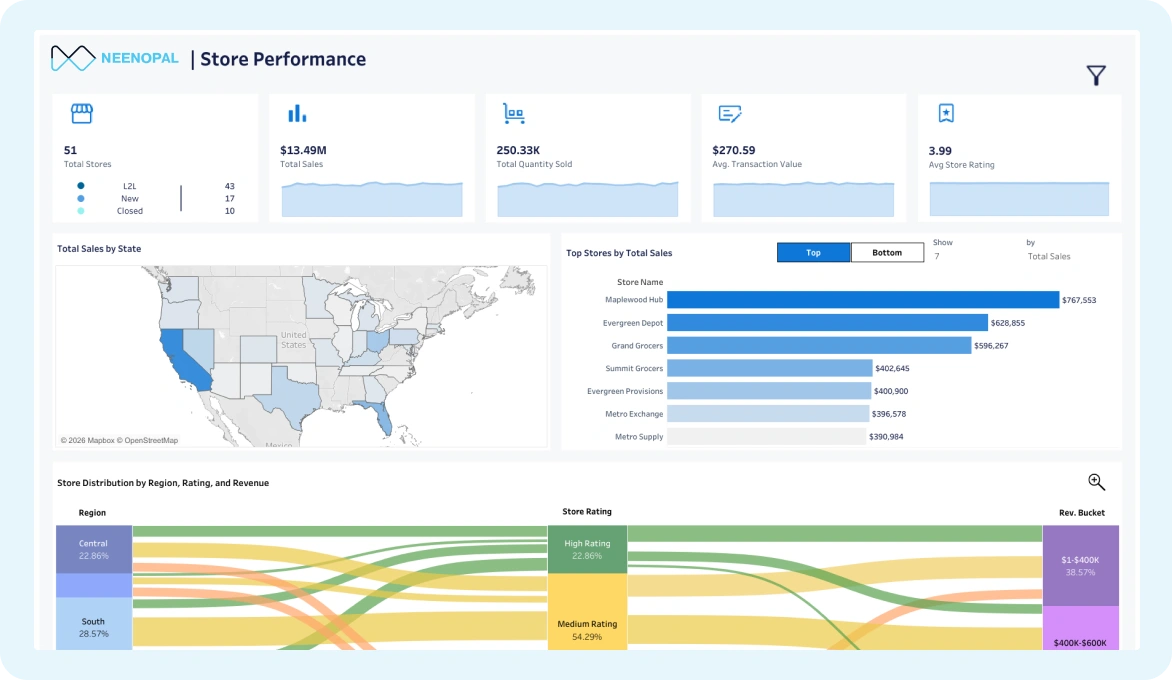
For a healthcare education client, we replaced manual Excel-based scoring with an automated pipeline feeding daily-refreshed Tableau Cloud dashboards, real-time leaderboards, programme-level rankings, and top-performer views, cutting time from survey close to published result from hours to minutes.
 View
View
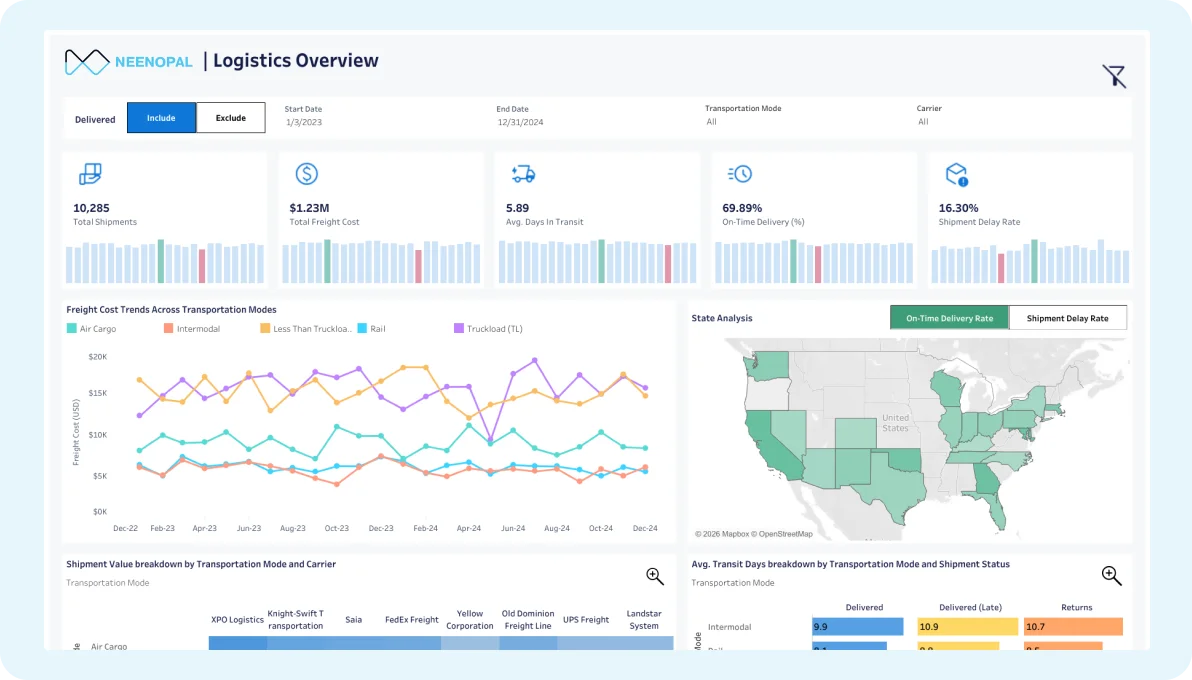
We migrated 80+ dashboards from Power BI to Tableau for a US solar energy enterprise with zero reporting downtime, then built admin-insights dashboards to track usage, lifting adoption 95% and giving the client a way to reclaim unused licenses.
 View
View
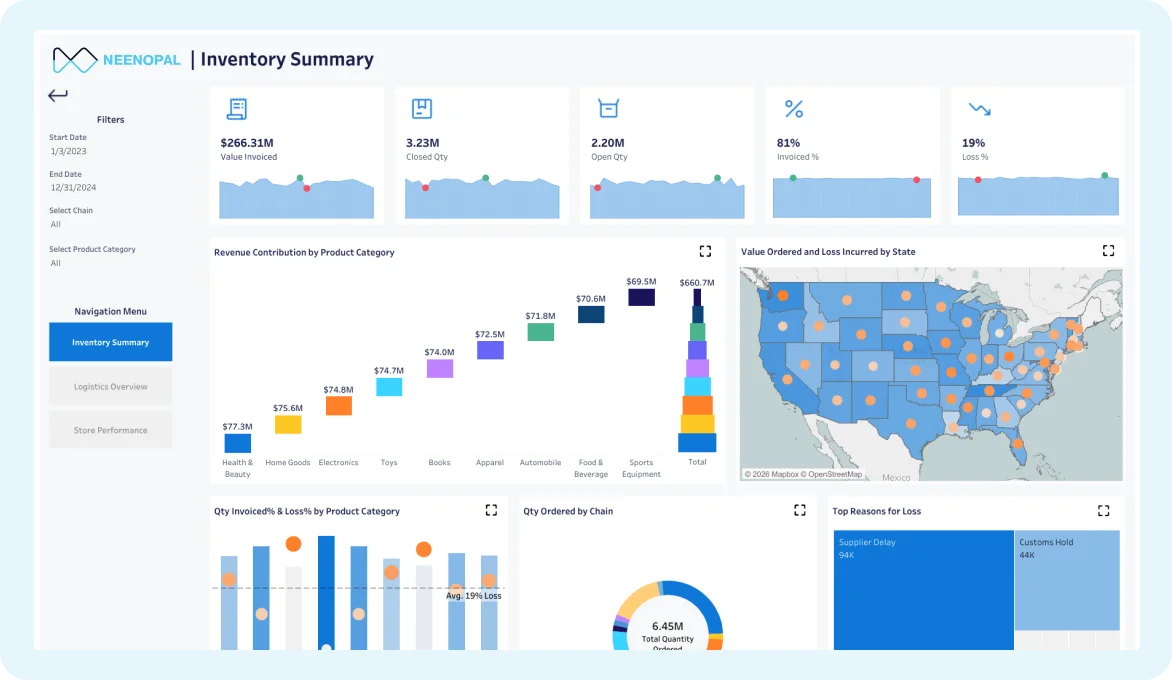
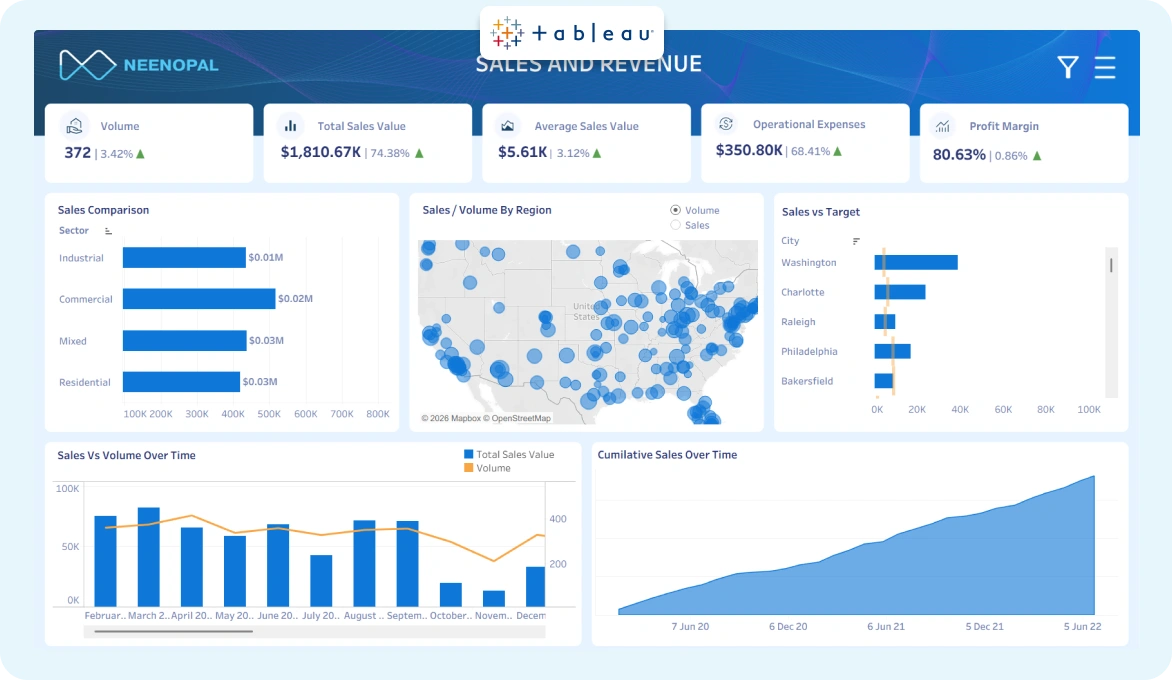
Our Tableau dashboards run across four regions and 26 countries for a global manufacturing leader, giving a geographically distributed user base a single, secure, multi-dimensional view of performance.
 View
View
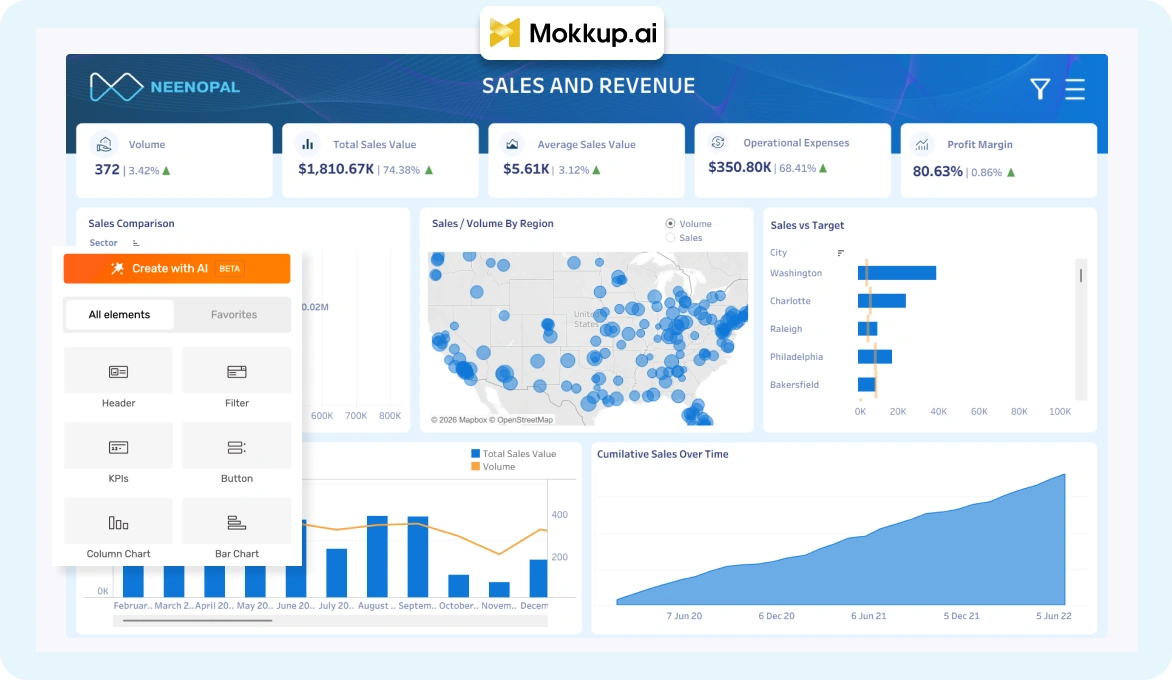
Most vendors wireframe in Figma and rebuild from scratch. We wireframe in Mokkup.ai, export straight to a Tableau-ready file, then plug in production data and refine the calculations, so the design you sign off on is the dashboard you get.
Want to See a Live Walkthrough Relevant to Your Industry?
Request a Tableau strategy sessionNeenOpal's Tableau practice is built for three enterprise situations we see again and again:

Analysts spend their days assembling the same metrics in Excel instead of analyzing them. We automate the pipeline end to end, so daily reporting takes minutes, not a full-time headcount.

Reporting exists, but it runs on a platform leadership isn't happy with- QuickSight, Power BI, or Qlik Sense- and the outcomes aren't there. We migrate to Tableau cleanly.

Tableau is already in place, but dashboards are slow, the design is rough, and most of the platform's power is switched off. We revamp, optimize, and bring it up to standard.
The people we work with are typically CTOs, analytics heads, CFOs on finance-specific engagements, and, where the problem sits inside one function, the department lead who owns that reporting pain directly.
Request a Tableau strategy sessionOur Tableau consultants talk through what actually makes an organization ready for AI-driven analytics, starting with the one decision most teams get wrong before they ever open Tableau. They walk through why AI on messy, ungoverned data breaks, what a clean data layer gives you that AI can't fake, and how this shapes every Tableau engagement, from Pulse to Tableau Agent.
A consistent, low-disruption path from first call to handover, adapted to your data readiness and how certain you are about scope. Some clients already know NeenOpal will be the implementation partner; others want to see the value on a smaller scope before committing to a larger rollout. Either way, we scope the first engagement to fit where you are, then expand once the value is clear.
The delivery process
We sit with your team to map KPIs, data sources, transformation needs, refresh frequency, and how each audience wants to consume reporting. This sets scope and delivery expectations up front.
We mock up end-state dashboards before building, in Mokkup.ai for speed or, where a strict brand template applies, in Figma with our in-house design team. Either way, we align in two drafts to avoid endless revision cycles.
Before any dashboard work begins, we validate the connected data against your source systems and agreed KPI definitions, checking for gaps, duplicates, and mismatched totals. Catching a data issue here costs an hour; catching it after go-live costs a client's trust in the report.
We build from production data, tune every calculation, including LOD expressions, to your agreed business logic, and apply your design and formatting standards throughout, so the finished dashboard matches what was signed off.
Thorough internal QC comes first, then user acceptance testing with your team. We fold in final feedback and produce a signed-off version ready for production.
The dashboard goes live and is handed over with full documentation, training, and enablement, so your team can own, maintain, and extend it with confidence.
The reasons enterprise teams pick NeenOpal as their Tableau consulting company and stay for the long term.

At most BI vendors, the same analysts who build the dashboard also design it. NeenOpal has a design team whose only job is the dashboard's layout and visual clarity, because a report people open every day has to be easy to read, not only accurate.

ISO 27001 and ISO 42001 and SOC 2 processes are part of the engagement from the requirement-gathering call, so access controls and data protection are already in place well before go-live.

Move to Tableau Cloud or re-platform with validated report parity, careful fidelity checks, and zero broken reporting on go-live day, so nothing leadership relies on ever goes dark.

We optimize for the decisions your team needs to make. If a straight Tableau vs. Power BI comparison favors Tableau for your stack, we'll say so and build accordingly; if it doesn't, we'll say that too.

Most Tableau estates use a fraction of what they're licensed for. Our team switches on Pulse, mobile, and Slack or Teams integration, and builds the rolling-calculation workarounds Pulse needs for trailing metrics, so adoption can keep growing.

Instead of wireframing in Figma and rebuilding from scratch, we wireframe in Mokkup.ai and export straight to a Tableau-ready file, then plug in production data. The design phase that usually takes days compresses to hours.

A dedicated project manager plus the Tableau consultants your project needs, owning delivery end-to-end.
Schedule a strategy session
Certified Tableau consultants join your existing team for short-term builds, migrations, or specialist LOD and performance work.
Find available experts
Defined scope, fixed price, and milestone-based delivery, so you know the cost and timeline before work begins.
Get project estimateAnswers enterprise teams ask before starting a Tableau engagement with NeenOpal.
Most enterprise Tableau implementations reach a first production release in 6-12 weeks, with full rollout phased over a quarter. Timeline depends on data readiness, the number of sources, and governance requirements. We scope a clear roadmap up front so you see value within the first 90 days.
We run migrations in parallel: the existing platform stays live while we recreate data sources and dashboards in Tableau Cloud, validate parity line by line, and only cut over once your team has signed off, so reporting never goes dark.
Tableau Cloud migration moves an existing Tableau Server deployment onto Tableau's hosted platform with the same content. Platform migration moves you onto Tableau from a different tool entirely, such as Power BI, QuickSight, or Qlik Sense, rebuilding dashboards and logic from scratch.
Our team audits query design, data models, and visual complexity to find what's actually slowing dashboards down, then refactors workbooks against a tested performance framework, typically cutting load times sharply while lifting adoption and reclaiming unused licenses.
Yes. We embed governed Tableau dashboards directly inside your product portal using Tableau's embedded analytics APIs, so customers see live reporting without leaving your application, turning analytics into a feature they pay for.