Teams drowning in manual reporting
Analysts rebuild the same metrics in Excel every day. We automate the pipeline so daily reporting takes only minutes.
We turn manual, Excel-bound reporting into decision-grade Tableau dashboards, built from a structured requirement-gathering and wireframing process, powered by production data, and shaped by a dedicated in-house design team, so the report is one people actually open every day.

Our Tableau dashboard development practice is built for three situations we see again and again.
Analysts rebuild the same metrics in Excel every day. We automate the pipeline so daily reporting takes only minutes.

Tableau is in place, but the design is rough, and most of the platform's power is switched off. We revamp it, tune performance, and bring it up to standard.

Conflicting reports across teams. We consolidate into governed Tableau dashboards everyone can trust.
A consistent, low-disruption path from first conversation to a dashboard your team owns. If you're not yet committed to a full rollout, we can scope a smaller proof-of-value dashboard first and expand once it proves out.
We map your KPIs, data sources, transformations, and refresh needs, agree on KPI design up front, then confirm how each audience wants reporting: visual or tabular, desktop or mobile, before we scope the build.
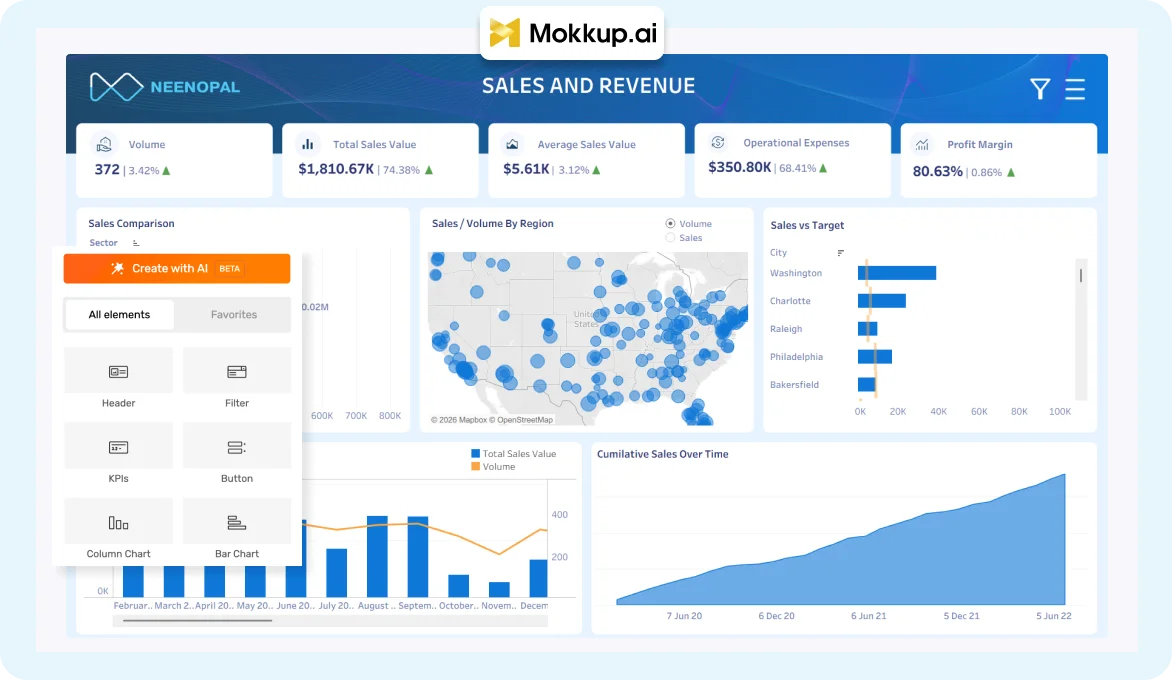
We mock up the end-state dashboard before we build: fast, realistic layouts in Mokkup.ai, or pixel-aligned Figma wireframes from our in-house design team when you need a strict brand template. Where stakeholders aren't yet sure what they need, we build the wireframe live with them on a call, which surfaces the real requirement faster than a written brief. We align across two drafts, deliberately, so revisions never hamper the project.
Before any dashboard work begins, we validate the connected data against your source systems and agreed KPI definitions, checking for gaps, duplicates, and mismatched totals. Catching a data issue here costs an hour; catching it after go-live costs a client's trust in the report.
We build on your production data, never dummy data. Mokkup.ai hands over a structured, Tableau-ready file. From there, our developers do the precision work. Every metric becomes a proper calculated field, LOD expression, parameter, or table calculation, validated line by line against your business logic. Source data runs through Tableau Prep wherever it needs cleaning or blending. We connect it live or through an extract, whichever your refresh needs call for.
Thorough internal QC, then user acceptance testing with your team. We fold in final feedback and produce a signed-off final version.
Once signed off, we productionize the dashboard: performance checks, access permissions, and refresh schedules all get finalized. We hand it over with full documentation, so your team can own, maintain, and run it independently from day one.
The specific choices, from workflow to design, that make NeenOpal's Tableau dashboards ones your team actually opens daily.

Most Tableau dashboard development companies wireframe in Figma, then rebuild everything from scratch. We wireframe in Mokkup.ai, export straight to a Tableau-ready file, and plug in production data. The slow build-from-scratch step disappears.

At most BI vendors, analysts double as designers, and it shows. Our design team's only job is making dashboards look right and stay on-brand, from KPI design and layout down to the mobile layout. A report you open every day should be effortless to read, with consistent formatting, clear labels, and an info icon on every KPI so nobody has to ask what a number means.

Every visual is tied to a governed, agreed metric definition from requirement gathering, with RLS applied for different slices of data. That governance runs on real calculated fields, LOD expressions, parameters, and table calculations, and dashboard actions connect those views so your team can click through and follow a question naturally.
Every NeenOpal engagement ends with documentation your team can actually use later, not a one-time handover call. Download the same two templates we deliver on every project: a Business Intelligence Technical Documentation guide for your IT and data teams, and a dashboard user manual template for everyone else. Use them to onboard new team members, survive handoffs, and keep the dashboard from quietly getting abandoned.
Tableau Agent turns plain-language questions into analysis and dashboards, drawing on the same governed metrics and production data foundation we build into every dashboard on this page. Watch it in action, then see what your own governed dashboard could support next.
A dashboard only earns a place on someone's desktop if they open it every day. Here's the kind of decision-grade Tableau storytelling and custom design NeenOpal builds across industries, designed by a dedicated in-house design team and built to be opened every single day.
 View
View
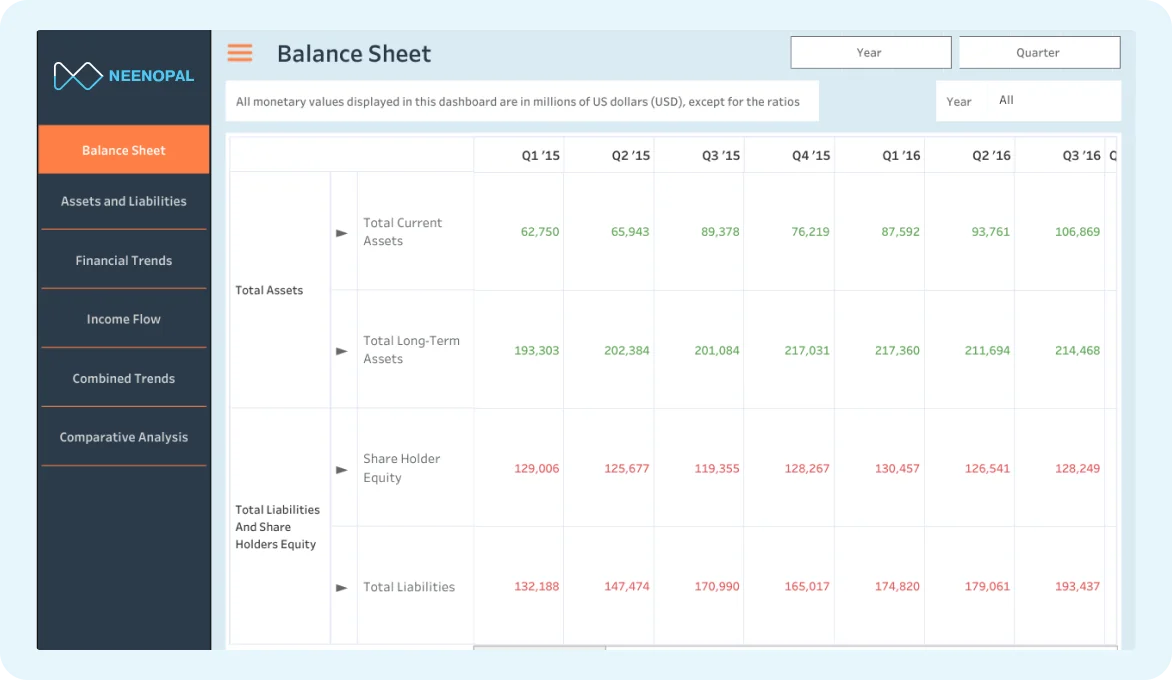
We've built Tableau dashboards that integrate data across finance, HR, sales, procurement, and operations into one governed view, letting leadership see how HR metrics like headcount move financial outcomes like EBITDA, with Row-Level Security controlling exactly who sees what.
 View
View
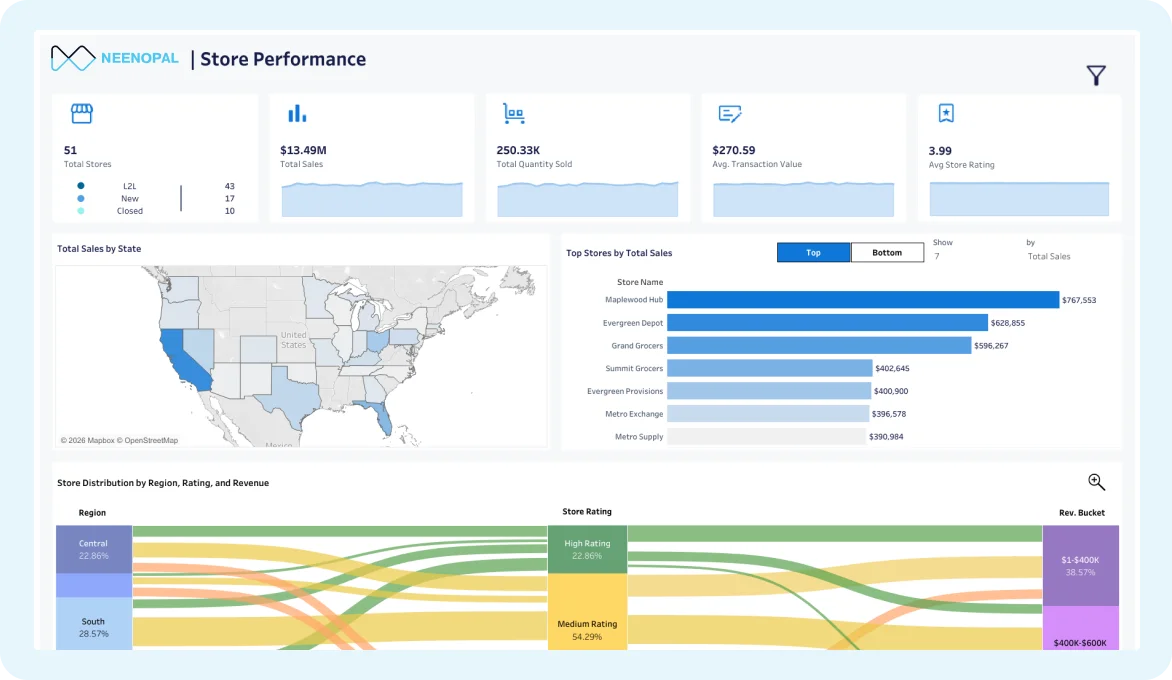
For a healthcare education client, we replaced manual Excel-based scoring with an automated pipeline feeding daily-refreshed Tableau Cloud dashboards, real-time leaderboards, programme-level rankings, and top-performer views, cutting time from survey close to published result from hours to minutes.
 View
View
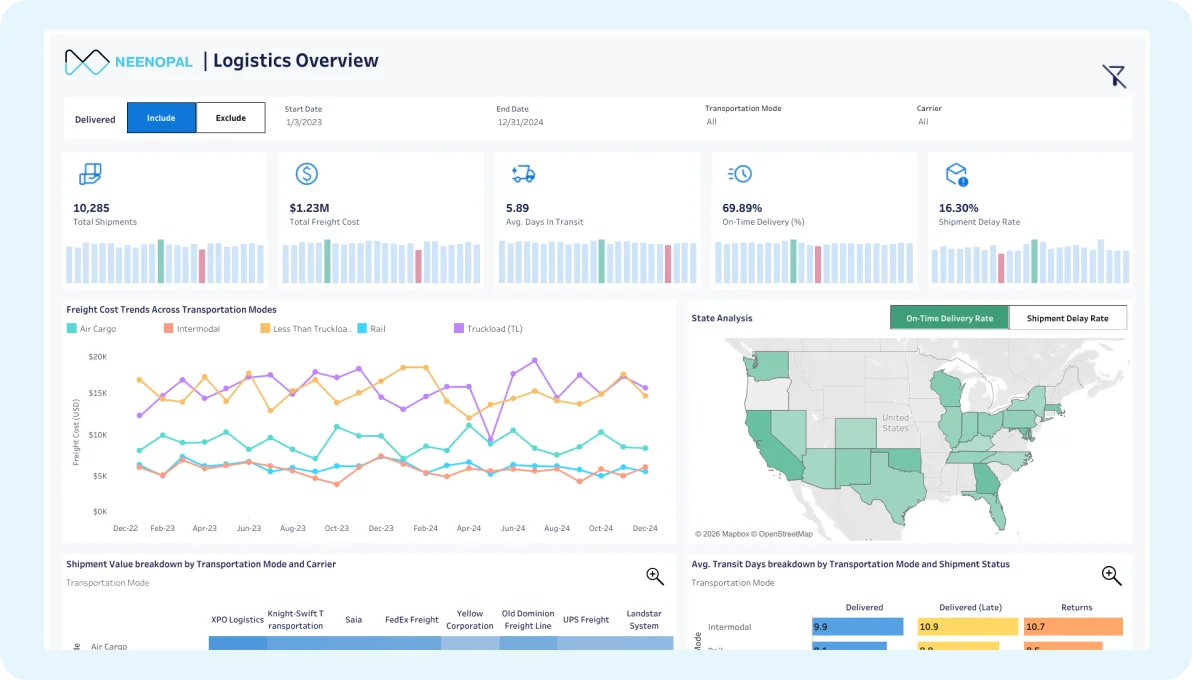
We migrated 80+ dashboards from Power BI to Tableau for a US solar energy enterprise with zero reporting downtime, then built admin-insights dashboards to track usage, lifting adoption by 95% and giving the client a way to reclaim unused licenses.
 View
View
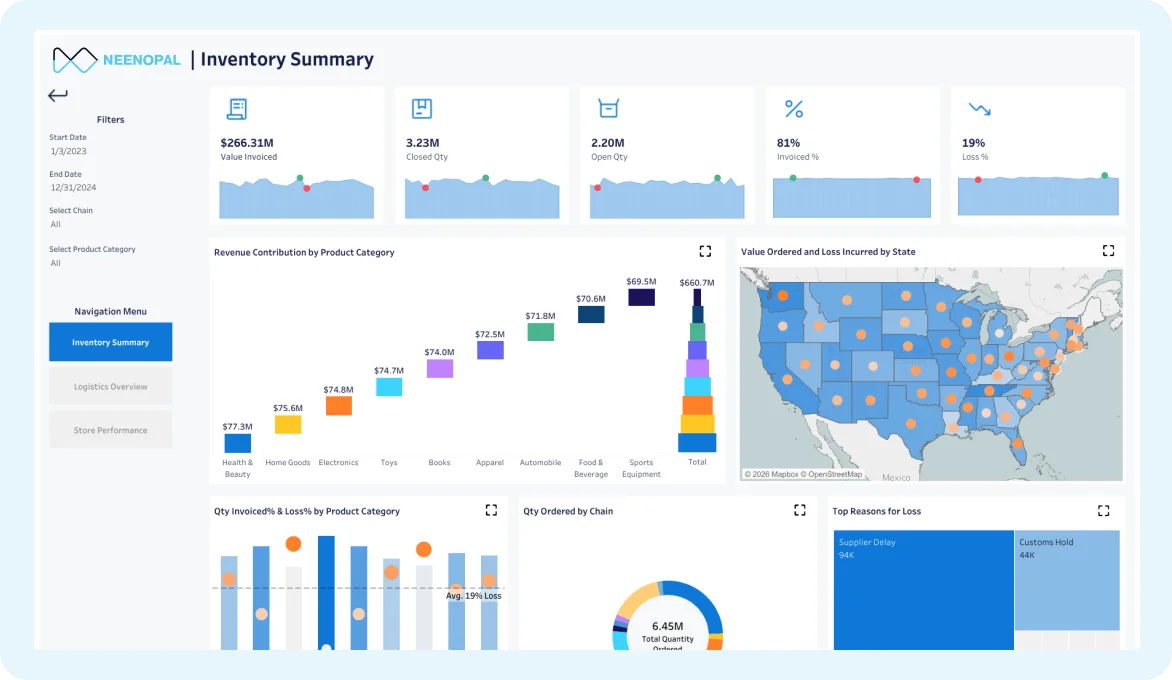
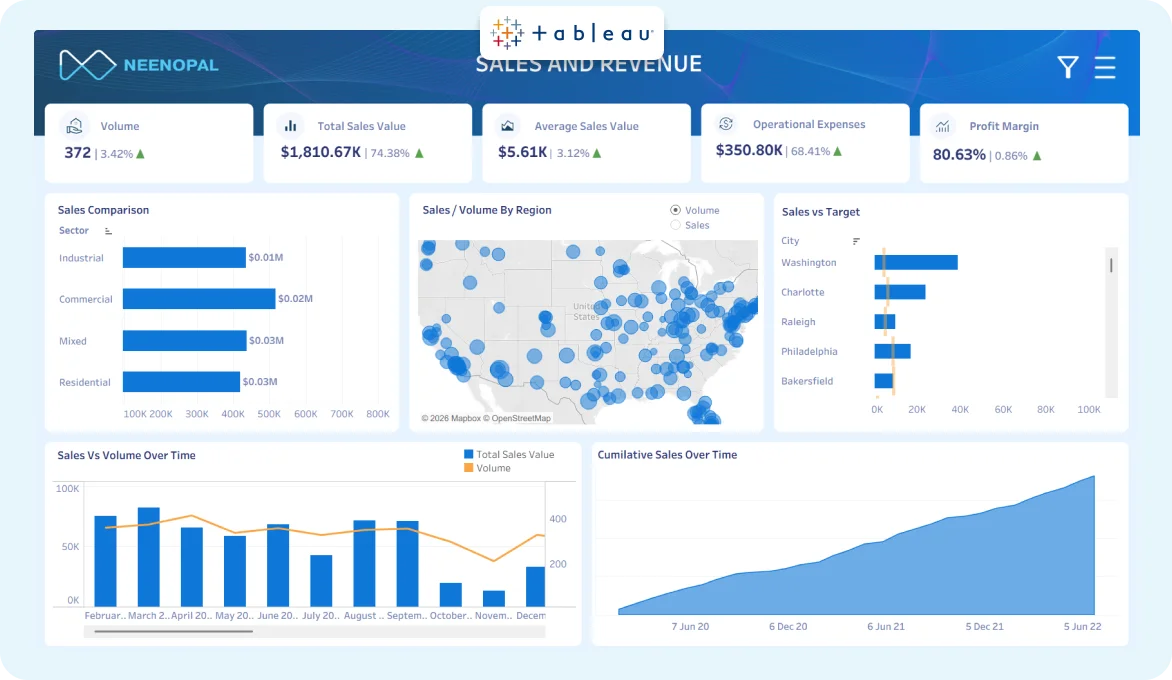
Our Tableau dashboards run across four regions and 26 countries for a global manufacturing leader, giving a geographically distributed user base a single, secure, multi-dimensional view of performance.
 View
View
Most vendors wireframe in Figma and rebuild from scratch. We wireframe in Mokkup.ai, export straight to a Tableau-ready file, then plug in production data and refine the calculations, so the design you sign off on is the dashboard you get.
Want to See a Live Walkthrough Relevant to Your Industry?
Request a Tableau strategy sessionResults from real NeenOpal engagements, shown by industry.

Executive Tableau dashboards across 4 regions and 26 countries, unifying NetSuite ERP via AWS with role-based access and Row-Level Security, replacing linear reports with cross-functional insight.

An Inclusive Leadership Index dashboard on Tableau and AWS Lambda, replacing slow legacy reporting with automated processing and real-time insight for 100+ concurrent complex report generations.

Data warehousing paired with Tableau dashboard development, helping stakeholders track key business metrics in near real time as part of a wider analytics engagement.
More ways NeenOpal's Tableau data visualization services help your team get further, from platform-wide consulting to performance tuning and embedded analytics.

End-to-end Tableau implementation, governance, and dashboard development for reliable, enterprise-wide reporting on one platform.
Learn More
Migrating and modernizing your Tableau environment and licensing without disrupting existing reporting workflows.
Learn More
Embedding governed Tableau visualizations directly into your own products, portals, and customer workflows.
Learn More
A dedicated project manager plus the Tableau developers and designers your dashboard needs, owning requirements, wireframing, build, and handover end-to-end.
Schedule a dashboard consultation
Certified Tableau developers and designers join your existing team for short-term builds, migrations, or design and calculation work you don't have in-house.
Find available Tableau experts
One governed dashboard, fixed scope, fixed price, and milestone-based delivery, so you know the cost, timeline, and outcome before work begins.
Get a project estimateDirect answers to the concerns that matter before committing time and budget.
Five phases covering the full Tableau report development lifecycle: requirement gathering (KPIs, data sources, freshness, how teams consume reporting), wireframing (typically two drafts), build from production data with calculations matched to your business logic, QC and user acceptance testing, then productionize and hand over with documentation.
We wireframe in Mokkup.ai and export straight to a Tableau workbook, so the design phase that usually takes days compresses, and the build starts from a structured layout rather than a blank canvas. We then connect production data and refine the calculations.
Yes. We revamp poorly-built dashboards, fix the design, and tie every visual to a governed metric definition. If the issue is specifically speed and load times, that's our Tableau performance optimization service, which pairs naturally with a rebuild.
We pair a Mokkup.ai wireframe-to-Tableau workflow with a dedicated in-house design team, so wireframing, calculation logic, and final visual design sit inside one accountable process. We also work across Tableau and Power BI, so the platform recommendation reflects your decisions and data, not a license we're trying to sell.
You do. Once signed off, it's productionized and handed over with documentation so your team can run it.