Faster, self-service decision-making
Executives and analysts get answers on their own, without waiting on a report queue.
One certified Power BI consulting team handles dashboard development, migration, embedded analytics, and performance tuning end-to-end, so the reporting estate you get stays governed and keeps getting used long after go-live.

The chart is the easy part. Most Power BI work is won or lost on adoption, trust, and performance. Our Power BI consulting services cover the whole lifecycle, from data modeling and the semantic model to migration, embedding, and performance tuning, under one accountable team, so reports are built well, migrated cleanly, embedded securely, and actually used.
Split across vendors, that lifecycle usually means three handoffs and a dashboard nobody owns when it breaks. Our certified Power BI consultants close those gaps instead of creating more.
Executives and analysts get answers on their own, without waiting on a report queue.

One certified, governed source of truth, not another spreadsheet workaround.

Legacy reports and Excel move over without a single day of downtime.

Row-level security keeps every customer's data walled off inside a shared workspace.

Slow reports get diagnosed and fixed source-to-visual, using Performance Analyzer and VertiPaq Analyzer.
PARTNERS



One team owns build, migration, embedding, and performance tuning, so nothing gets lost between vendors. The consultants who scope your data model at kickoff are the same ones who tune performance and hand the dashboard over, so context never has to be re-explained mid-project.

Decision-grade Power BI dashboard development, co-designed with your users from the first wireframe, with the semantic model and Power Query transformations built for adoption from day one.
Power BI dashboard development
Move legacy reporting and Excel to Power BI and Microsoft Fabric on Azure, with zero downtime and validated numbers.
Power BI Migration Services
Multi-tenant Power BI embedded analytics inside your product, with row-level security (RLS) enforced by the model.
Power BI Embedded Analytics
Diagnose and tune slow reports source-to-visual with focused Power BI performance optimization, and switch on the governance that builds trust.
We treat dashboards as a product here, not a one-time deliverable. Here is the kind of decision-grade Power BI work NeenOpal builds across industries, designed for adoption and built to be opened every day.
 View
View
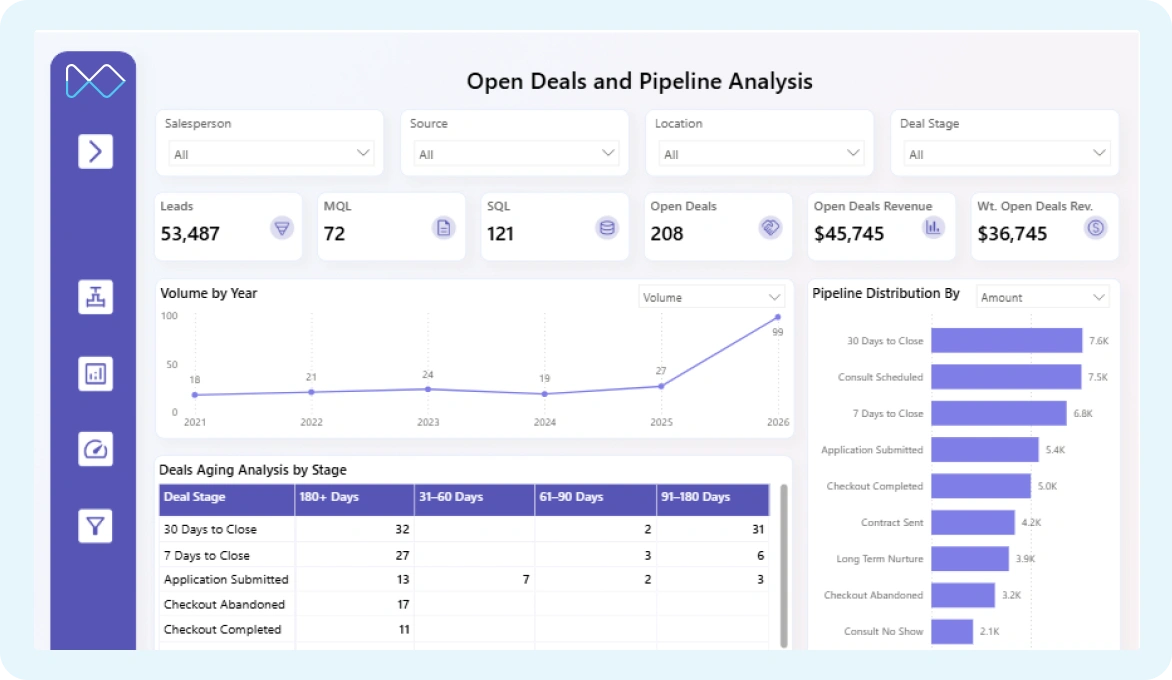
Sales and marketing unified from HubSpot: open deals, pipeline stages and revenue trends in one governed Power BI view your revenue team can actually act on.
 View
View
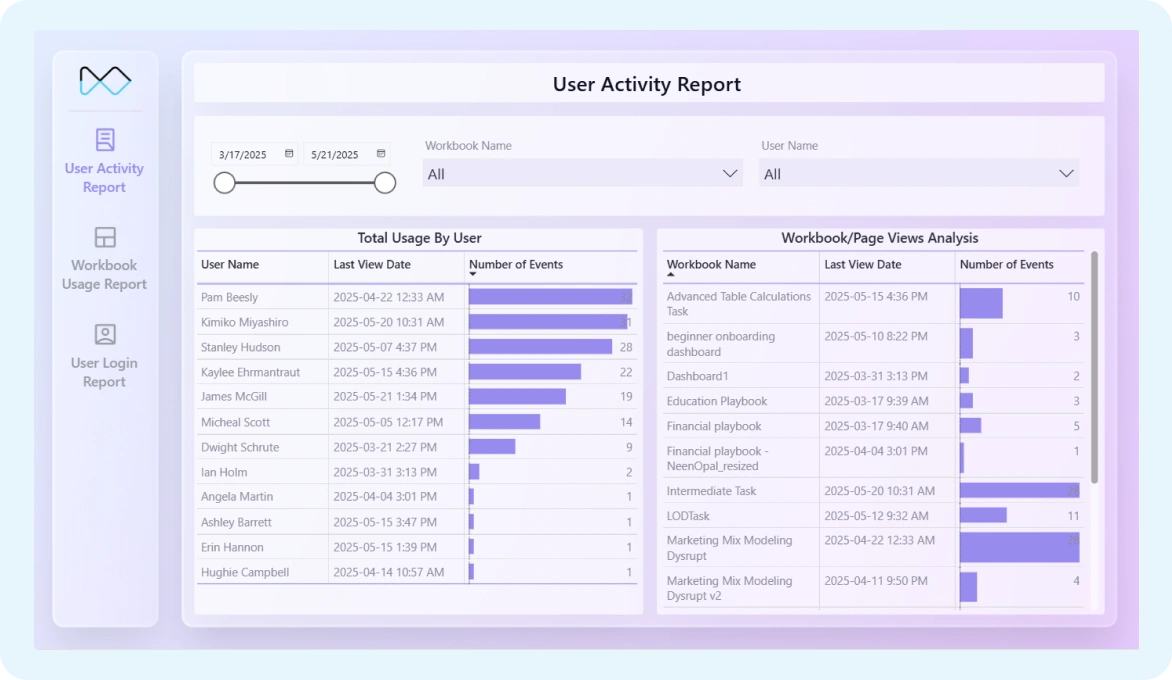
A tailored product-usage report tracking user activity and feature adoption over time, so product and success teams see who is engaged and where usage is slipping.
 View
View
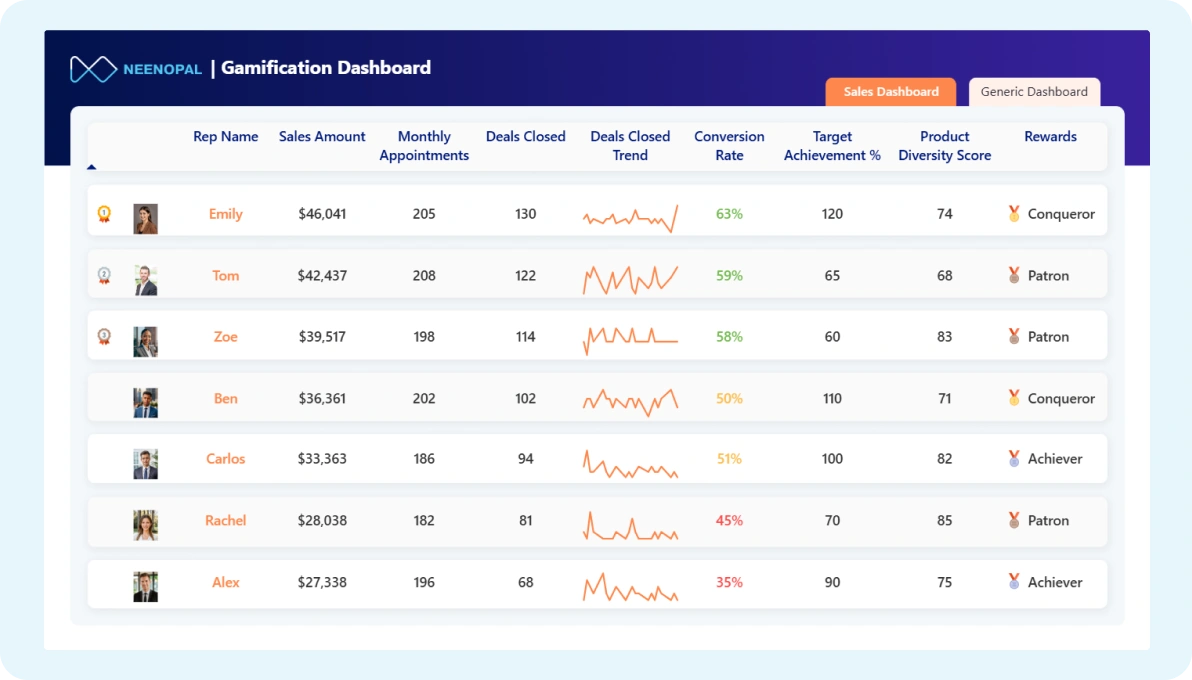
A sales gamification leaderboard ranking reps on deals, conversion and targets, with rewards and live standings that keep a competitive team motivated day to day.
 View
View
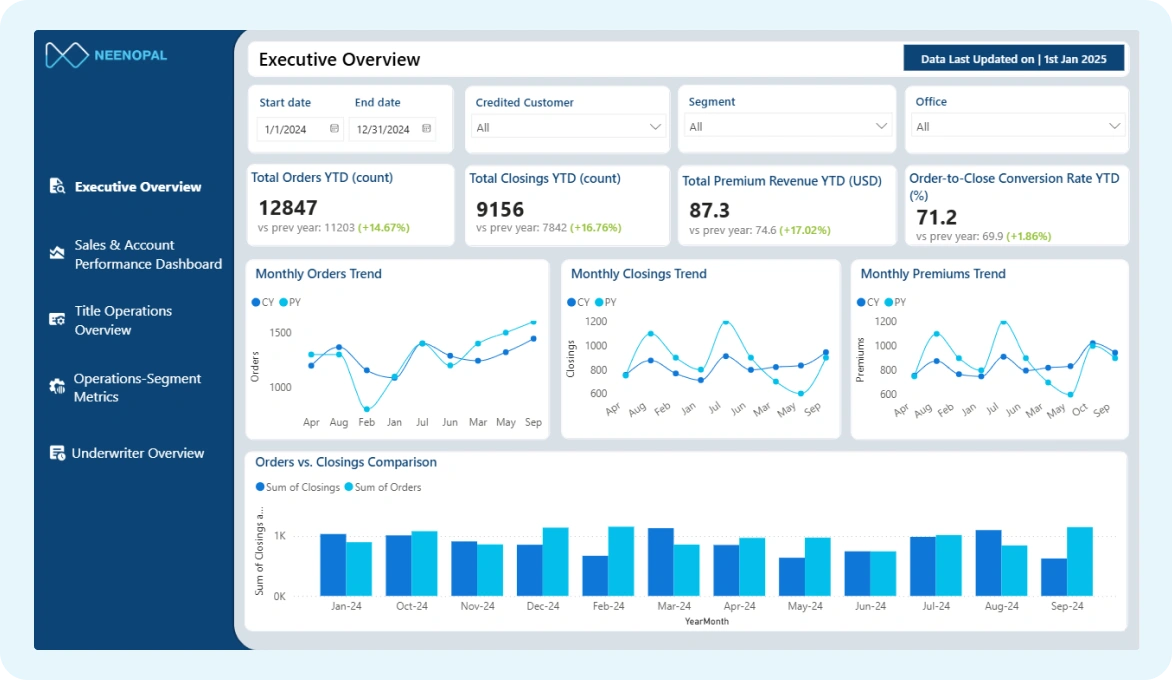
An insurance executive overview across policies, claims and workforce KPIs, with drill-downs that turn a dense operational picture into decisions leadership can act on.
 View
View
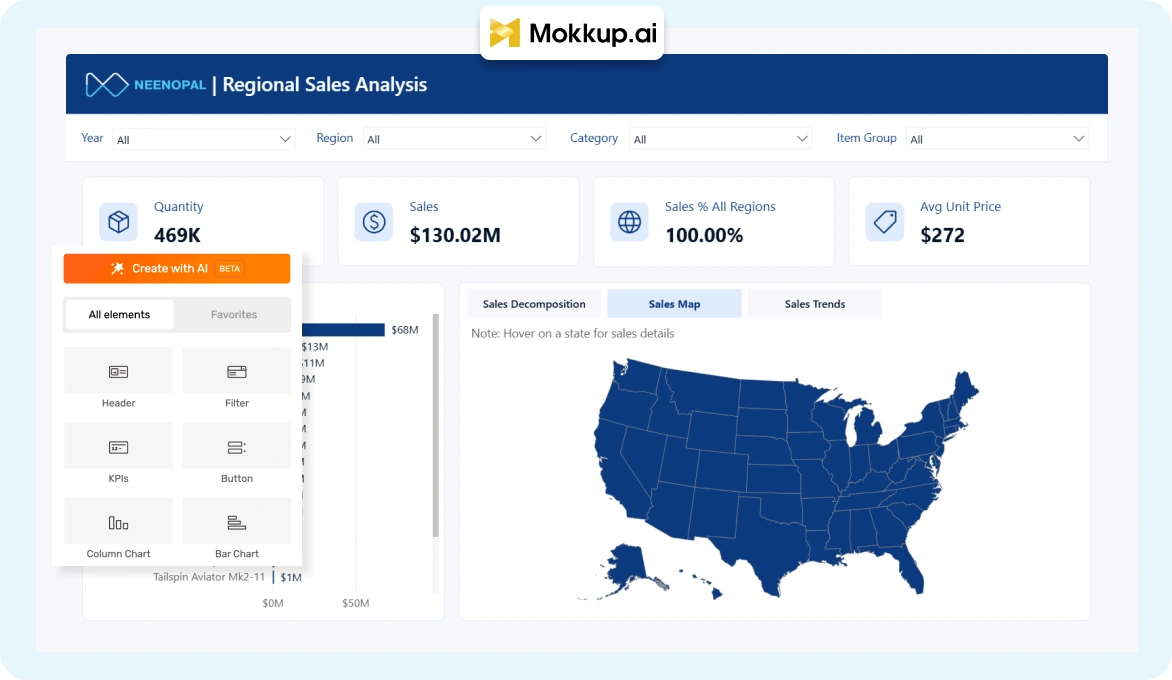
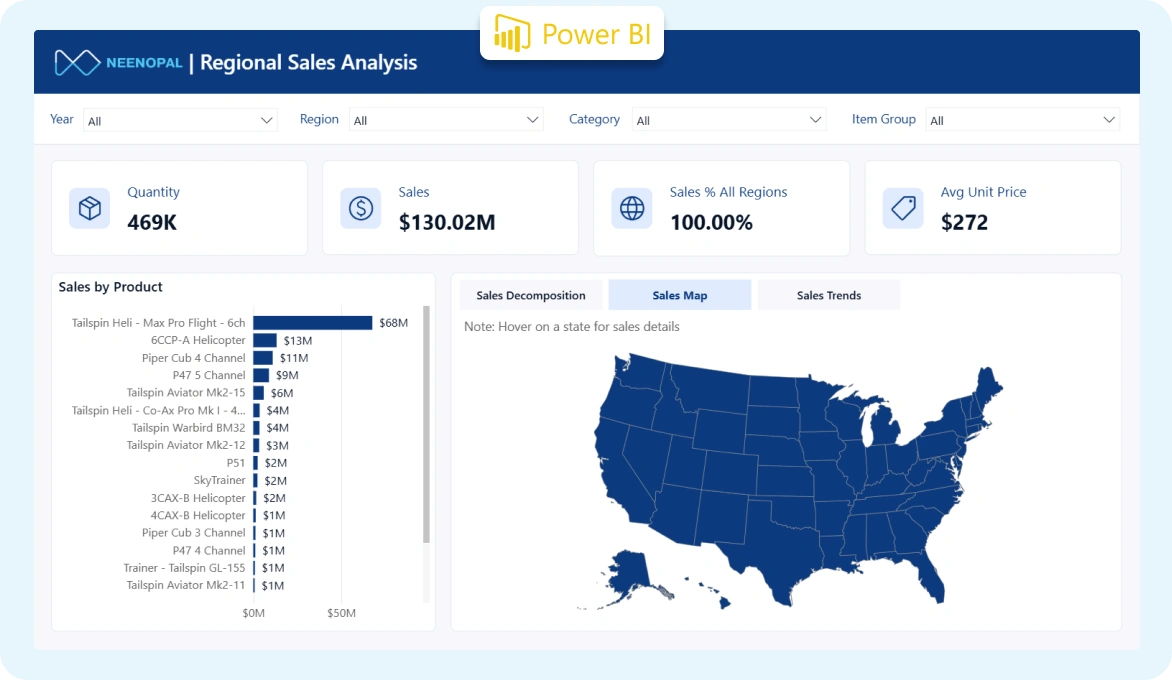
We wireframe in Mokkup.ai, export straight to a Power BI-ready file, then plug in production data and refine the DAX, so the design you sign off on ships unchanged.
Want to see a live walkthrough relevant to your industry?
Request a Power BI strategy sessionNeenOpal's Power BI practice is built for three enterprise situations we see again and again:

Analysts spend their days assembling metrics in Excel. We automate the analytical pipeline so daily reporting takes minutes, not headcount.

Reporting exists, but it runs on a platform leadership isn't happy with: Tableau, QuickSight, or Qlik Sense, and the outcomes aren't there. We migrate you to Power BI cleanly.

Power BI is already in place, but dashboards are slow and under-governed, with most performance and security tools switched off. We optimize, secure, and bring the estate up to standard.
We typically work with CTOs and analytics heads, or, when the problem sits inside a single function, the department lead who owns that reporting pain directly.
Request a Power BI strategy sessionA dashboard only works if people can find what they need quickly. Across hundreds of Power BI, Tableau, Looker, and Salesforce reports, we've found that it comes down to three phases: plan, wireframe, and design. In this webinar, our consultants walk through practical, phase-by-phase principles for designing dashboards people actually open every day.
A consistent, low-disruption path from first call to handover, adapted to your data readiness and how certain you are about scope. Some engagements start with a single wireframe review call; others begin with a multi-source data audit before a line of DAX gets written. Either way, the steps below stay the same.
For clients who want to see value before committing to a large rollout, we can scope an initial proof-of-value engagement first, then expand.
The delivery process
We sit with your team to map KPIs, data sources, transformation needs, data freshness and frequency, and how each audience wants to consume reporting. This defines scope and the delivery expectation up front.
We mock up the end-state dashboards before building. For speed, we wireframe in Mokkup.ai; where you have a strict brand template to match, our in-house design team builds pixel-aligned wireframes in Figma. We align with you in two drafts to avoid endless revision cycles.
Before any dashboard work begins, we validate the connected data against your source systems and agreed KPI definitions, checking for gaps, duplicates, and mismatched totals. Catching a data issue here costs an hour; catching it after go-live costs a client's trust in the report.
We build from production data, tune the DAX measures and data model to your agreed business logic, and apply your design and formatting standards.
Thorough internal QC, then user acceptance testing with your team. We fold in final feedback and produce a signed-off final version.
The dashboard goes live and is handed over with documentation, so your team can own it.
These are the standards our Microsoft-certified team holds itself to on every engagement, backed by NeenOpal's status as a Microsoft Solutions Partner.

We co-design dashboards live with your users and tailor rollout by role, from executive walkthroughs to hands-on analyst sessions, so adoption starts on day one.

Tooltips, info icons, bookmarks, and in-report navigation so any user can navigate independently.

Endorsement (Promoted/Certified), row-level security, workspace governance, and visible data-freshness timestamps, delivered under our ISO 27001 and ISO 42001-aligned data and AI practice.

Aggregate and visual-by-visual validation against the legacy report, with version-controlled rollback, so a migration only goes live once every number checks out.

Q&A visuals, Copilot summaries, and PowerPoint-embedded visuals for leadership reviews, so a board update is ready in minutes.

Source-to-visual Power BI performance optimization using Performance Analyzer and VertiPaq Analyzer, with DAX refactored for speed.

A dedicated project manager plus the Power BI consultants your project needs, owning delivery end-to-end.
Schedule a strategy session
Certified Power BI consultants join your existing team for short-term builds, migrations, or specialist DAX and performance work.
Find available experts
Defined scope, fixed price, and milestone-based delivery, so you know the cost and timeline before work begins.
Get project estimateCommon questions enterprise teams ask before starting a Power BI engagement with NeenOpal.
The full lifecycle: Power BI dashboard development, migration to Power BI and Microsoft Fabric, embedded analytics, and performance and governance, delivered by certified Power BI consultants as one practice.
We co-design with users via live wireframing, embed self-service context (tooltips, docs, Q&A, Copilot), endorse trusted models, and keep a Teams feedback loop open.
Yes. We migrate in phases, keep the legacy environment live until the new one is verified, and validate every migrated report against its legacy counterpart down to the row, aggregate, and visual level.
Yes, with App-Owns-Data and dynamic row-level security so each customer sees only their own data, scaling to 1,000+ tenants on a shared-workspace model.
Yes. We diagnose source, model, query then visual, addressing DirectQuery/Import/composite choices, star-schema and cardinality issues, and common DAX offenders like unnecessary iterators and bi-directional filters, using Performance Analyzer and VertiPaq Analyzer.
Managed Team, Staff Augmentation, and Fixed Cost, matched to your scope, internal capacity and certainty of requirements.