Power BI Dashboard Development Services for Decision-Ready Analytics

We convert manual, Excel-bound reporting into decision-ready Power BI dashboards. Every build starts with structured requirement gathering and expert wireframing, runs on clean data modeling and validated DAX measures, and is shaped by our in-house design team, so every report becomes one your team opens daily.

Power BI dashboard development: data sources unified into governed, decision-grade dashboards

Who We Build Power BI Dashboards For

Our Power BI dashboard development services address three situations we see again and again:

Poorly-built existing dashboards

Power BI is already in place, but the design is rough, performance is slow, and most of it sits unused. We trace slow reports back to the actual cause, checking the data source, semantic model, the DAX, and then the visuals themselves, using Performance Analyzer and VertiPaq Analyzer, and bring the dashboard up to standard from there.

Leaders needing single source of truth

Conflicting reports across teams and tools, each team swearing by its own numbers. We consolidate everything into governed, executive Power BI dashboards tied to one agreed metric definition, with Q&A visuals for quick questions, so everyone walks into a decision looking at the same numbers.

Outcomes Enterprise Leaders Measure Us By

$750M+
Financial Impact Delivered to Clients
85%
Reached North Star outcomes within 90 days
1000+
Power BI dashboards delivered

How We Build a Power BI Dashboard

A structured, five-step process from first conversation to a dashboard your team owns, tested and refined on production data throughout.

1

Requirement gathering

We map the KPIs, data sources, required transformations, and refresh frequency you need, plus how each audience consumes reporting: visual or tabular, desktop or mobile layout. This locks the KPI design and expected output before a single visual gets built.

2

Wireframing

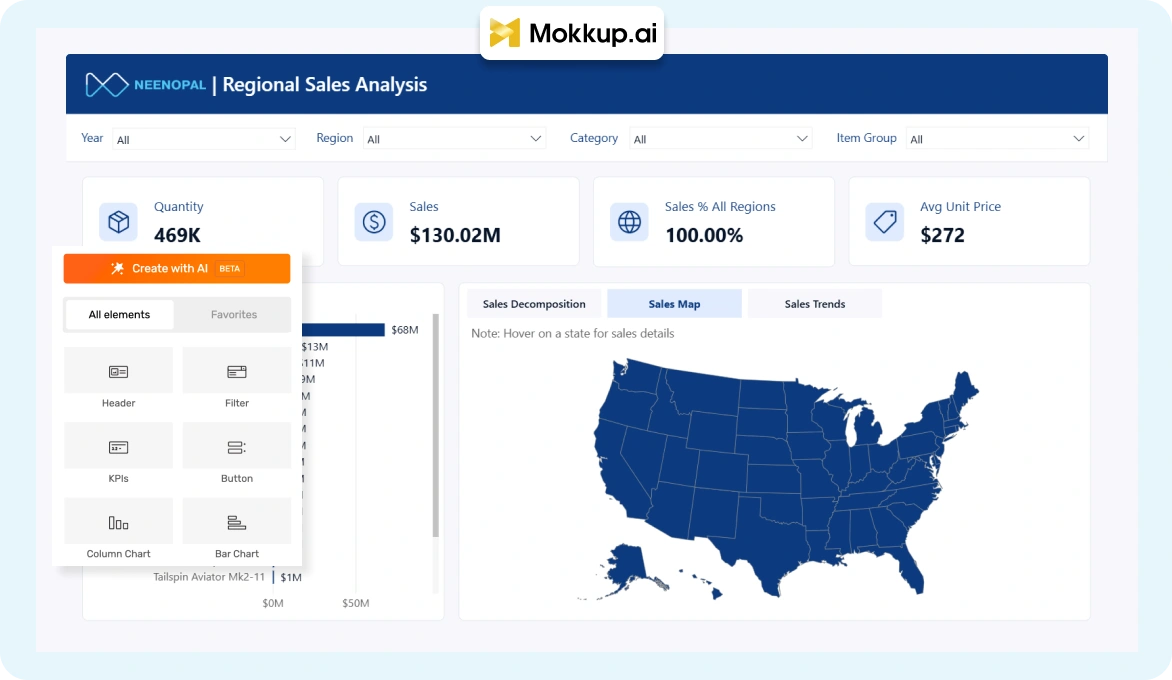
We mock up the end-state dashboard before we build: fast, realistic layouts in Mokkup.ai, or pixel-aligned Figma wireframes from our in-house design team when you need a strict brand template. Where stakeholders aren't yet sure what they need, we build the wireframe live with them on a call, which surfaces the real requirement faster than a written brief. We align across two drafts, deliberately, so revisions never hamper the project.

3

Dashboard build

We build on your production data, never dummy data. Mokkup.ai's semantic export carries the business logic straight into a Power BI-ready file: we handle the data modeling in Power Query, structure it as a clean star schema, validate every DAX measure against your business logic, and apply your design standards for polished, custom Power BI dashboard development.

4

Data sanity check

Before any dashboard work begins, we validate the connected data against your source systems and agreed KPI definitions, checking for gaps, duplicates, and mismatched totals. Catching a data issue here costs an hour; catching it after go-live costs a client's trust in the report.

5

QC and UAT

Thorough internal QC comes first, checking data accuracy, interactive visuals such as drill-throughs and bookmarks, and report performance. Then your team runs user acceptance testing, and we fold in feedback before sign-off.

6

Productionize and hand over

Once signed off, we productionize the dashboard: performance checks, access permissions, and refresh schedules all get finalized. We hand it over with full documentation, so your team can own, maintain, and run it independently from day one.

What Makes a NeenOpal Power BI Dashboard Different

The specific choices, from workflow to design, that make NeenOpal's BI dashboards ones your team actually opens daily.

A dedicated in-house design team

At most BI vendors, analysts double as designers, and it shows. Our design team's only job is making dashboards look right and stay on-brand, from KPI design and layout down to the mobile layout. A report you open every day should be effortless to read, with consistent formatting, clear labels, and an info icon on every KPI so nobody has to ask what a number means.

Full platform utilisation

We switch on the parts of Power BI most teams never touch: drill-through and bookmarks for faster navigation, Q&A visuals and Copilot-generated summaries for executives, Power BI visuals embedded directly into PowerPoint, paginated reports for print-ready exports, and custom visuals. Every visual ties to one governed metric definition, with row-level security where needed.

The Documentation That Keeps Our Dashboards From Getting Abandoned

Every NeenOpal engagement ends with documentation your team can actually use later. Download the same two templates we deliver on every project: a Business Intelligence Technical Documentation guide for your IT and data teams, and a dashboard user manual template for everyone else. Use them to onboard new team members, survive handoffs, and keep the dashboard from quietly getting abandoned.

The Design Process Behind Every Dashboard We Build

Our design team walks through the same three-phase process that runs through this whole page: plan, wireframe, then design, built from hundreds of client reports across BI tools. It's exactly how we approach every Power BI dashboard here, from the first KPI list to the final handover.

See What We Actually Build

Browse real, anonymised, interactive Power BI dashboards across retail, finance, and manufacturing, plus a side-by-side look at how a Mokkup.ai wireframe becomes a finished Power BI dashboard.

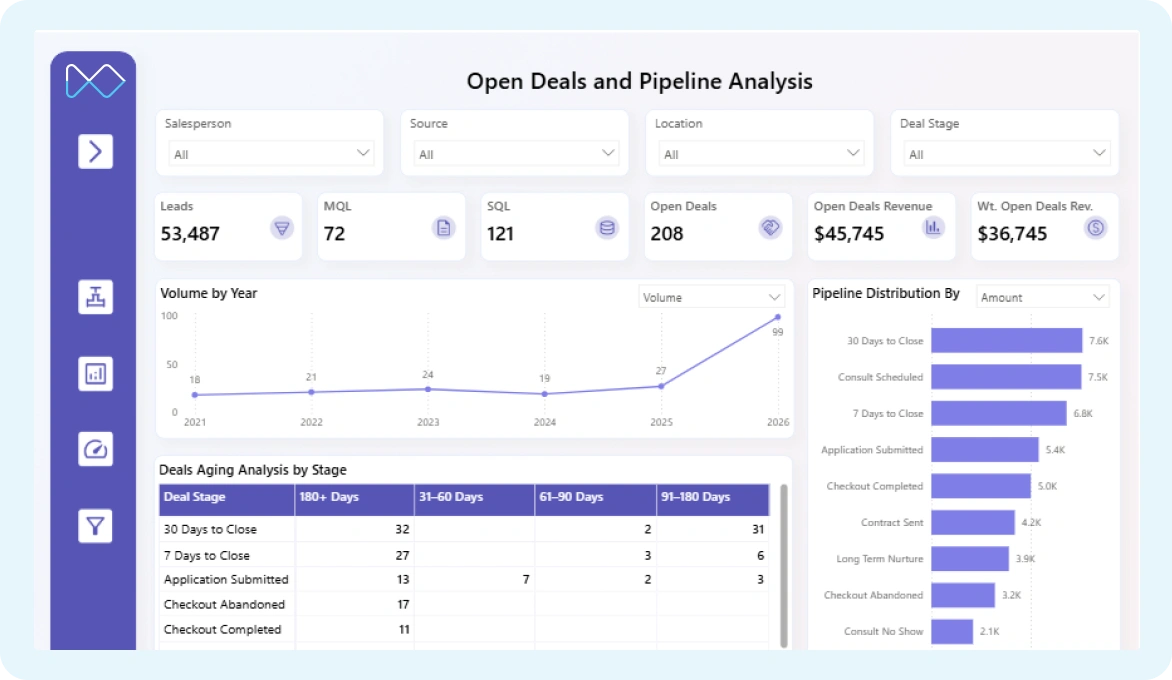
Combined HubSpot Playbook View

Combined HubSpot Playbook

Sales and marketing unified from HubSpot: open deals, pipeline stages and revenue trends in one governed Power BI view your revenue team can actually act on.

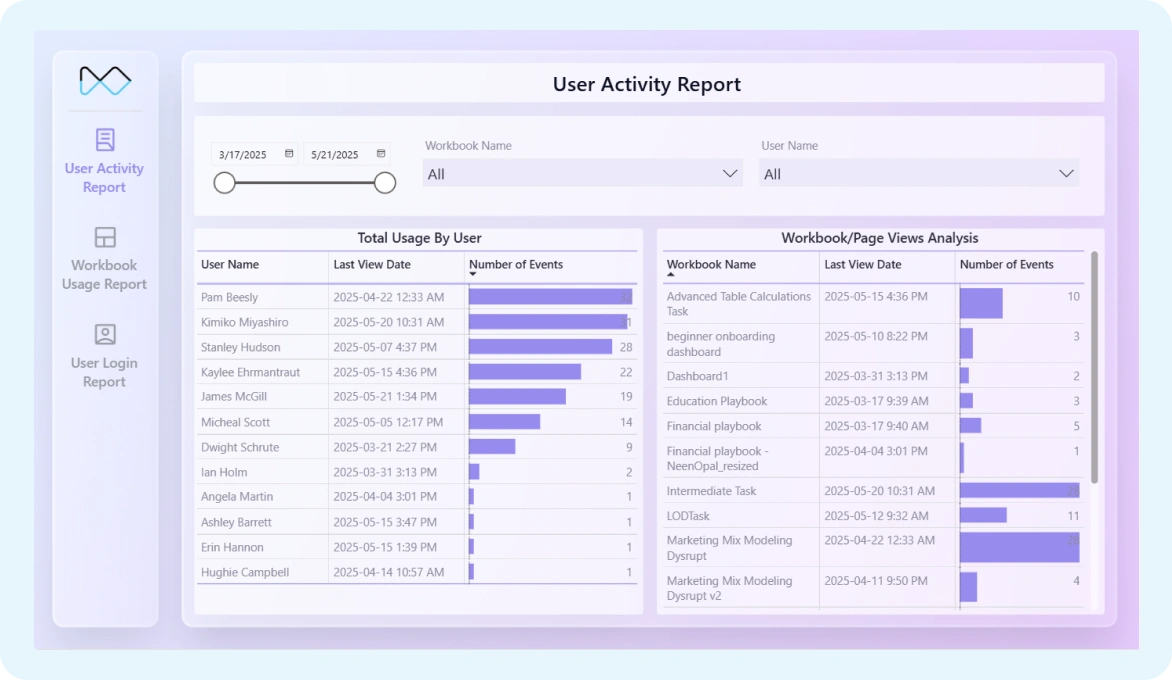
Custom Usage Report View

Custom Usage Report

A tailored product-usage report tracking user activity and feature adoption over time, so product and success teams see who is engaged and where usage is slipping.

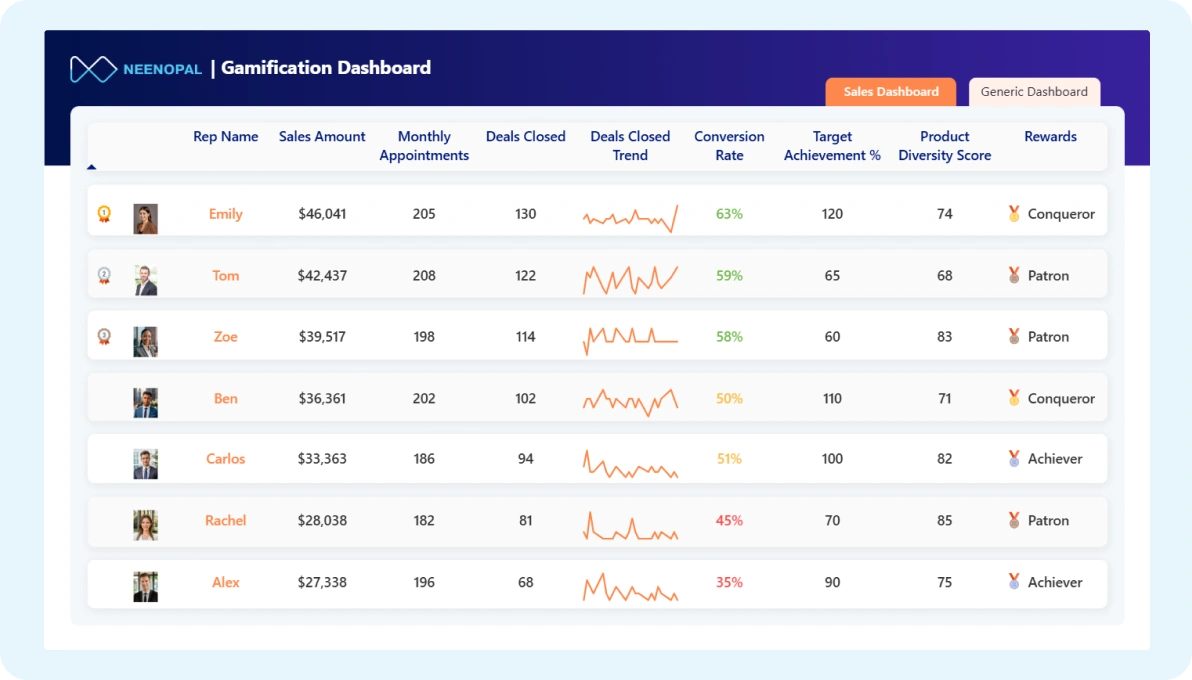
Gamification Dashboard View

Gamification Dashboard

A sales gamification leaderboard ranking reps on deals, conversion and targets, with rewards and live standings that keep a competitive team motivated day to day.

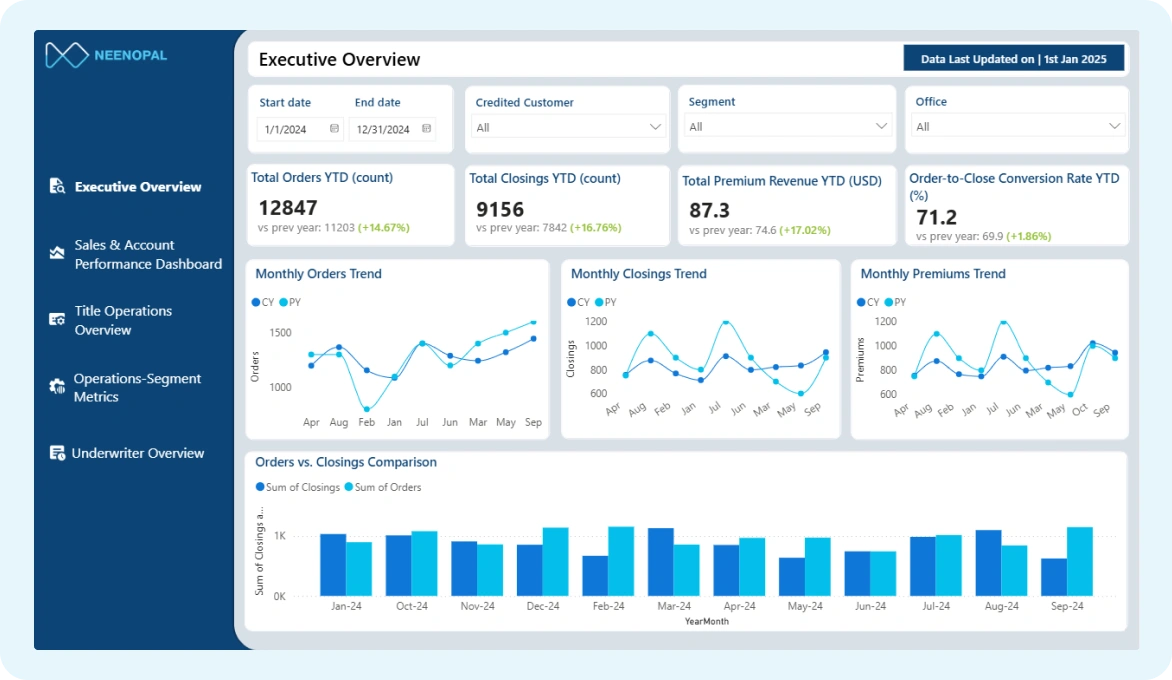
Insurance Playbook View

Insurance Playbook

An insurance executive overview across policies, claims and workforce KPIs, with drill-downs that turn a dense operational picture into decisions leadership can act on.

Power BI dashboard wireframe in Mokkup.ai
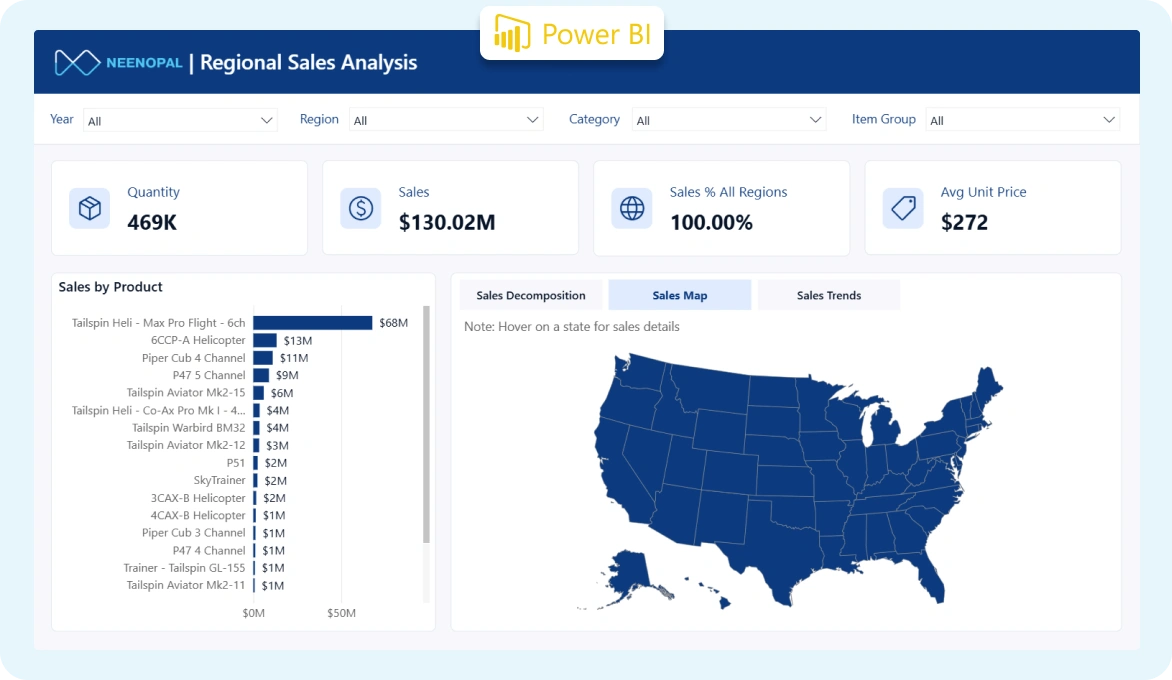
Finished Power BI webinar analytics dashboard View

From live wireframe to finished Power BI dashboard

We wireframe in Mokkup.ai, export a data-linked file straight into Power BI, then verify the production data and refine the DAX, and it's good to go.

Want to see a live walkthrough relevant to your industry?

Request a Power BI strategy session

Real Power BI Outcomes

Results from real NeenOpal engagements, shown by industry.

Consumer-durable retailer

Power BI dashboards across sales, inventory, service, finance, logistics, supply chain, and customer loyalty for a retailer with 400+ locations and 2,200+ employees, on a robust cloud setup.

Pharmaceutical enterprise

A BI platform to streamline internal reporting and speed decision-making for a research-based pharma company of ~1,000 people operating across 80+ countries, integrated with a custom ERP.

Consumer goods giant

A Power BI engagement for Singer Sri Lanka PLC, praised us for an organized workflow, constant feedback, and strong technical instincts, delivering navigable, stakeholder-aligned dashboards that supported optimized inventory and increased sales.

Related Power BI Services

At NeenOpal, we provide specialised Power BI solutions that enhance data visualisation and analytics. Our offerings help businesses unlock the full potential of their data.

Power BI Embedded Services

Embedding interactive Power BI analytics directly inside your own applications, portals, and products.

Learn More

Power BI Migration Services

Seamless migration of legacy reporting tools onto Power BI with zero workflow disruption.

Learn More

Choose the Power BI Engagement Model That Fits Your Needs

Managed Dashboard Build

A dedicated project manager plus the Power BI developers and designers your dashboard needs, owning requirements, wireframing, build, and handover end-to-end.

Schedule a dashboard consultation

Embedded BI Developers

Power BI developers and designers join your existing team for short-term builds, migrations, or design and DAX work you don't have in-house.

Find available BI developers

Fixed-Scope Dashboard Sprint

One governed dashboard, fixed scope, fixed price, and milestone-based delivery, so you know the cost, timeline, and outcome before work begins.

Get a project estimate

Power BI Dashboard Development FAQs

Answers to what clients ask us most before a Power BI dashboard development project even starts.

It involves five phases: requirement gathering (KPIs, data sources, freshness, how teams consume reporting), wireframing (typically two drafts), build from production data with calculations matched to your business logic, QC and user acceptance testing, then productionize and hand over with documentation.

We wireframe in Mokkup.ai and export straight to a Power BI-ready file, so the design phase that usually takes days compresses, and Power BI report development starts from a structured layout rather than a blank canvas. We then connect production data and refine the calculations.

Yes, this is one of our most common engagements. Our Power BI dashboard consultants revamp poorly built dashboards, fix the design, and switch on the platform features left unused, tying every visual to a governed metric definition.

Most Power BI dashboard development companies wireframe in one tool and then rebuild everything from scratch once development starts. Our Mokkup.ai-to-Power BI workflow skips that step, and because our design team's only job is design, dashboards come out genuinely good to look at and on-brand, backed by full platform features like drill-through, bookmarks, and paginated reports most teams never switch on.

You do. Once signed off, it's productionized and handed over with full documentation, so your team can run it independently.

Usually, yes. We diagnose in a fixed order: the data source first, then the semantic model, then the DAX (heavy iterators like SUMX, bidirectional filters, calculated columns that should be measures), then the visuals themselves, using Performance Analyzer and VertiPaq Analyzer to find the actual bottleneck rather than guessing. Most slow dashboards get fixed at the model or DAX layer without touching the report design.