
Inventory before you rebuild
We catalogue every report and workbook feeding it: usage, sources, parameters, filters, row-level security. A large share turns out dead or duplicated, so this step alone keeps the rebuild lean and the cost down.
A platform migration takes you from legacy BI, such as Tableau, Qlik, Cognos, SSRS, or MicroStrategy, or from Excel-based reporting, onto Power BI, consolidating separate licensing costs into one governed environment along the way. The calculation language and model have no direct equivalent, so the analytics layer is rebuilt from the ground up. The risk to manage is fidelity: numbers drifting from source.
A data-platform migration, often called a Power BI Microsoft Fabric migration, keeps Power BI as the reporting layer while modernizing what sits beneath it. Legacy sources move onto a Fabric data warehouse, and the real work is ETL, semantic models, and refresh. Moving your data layer to Fabric? See our Data Engineering services.
PARTNERS
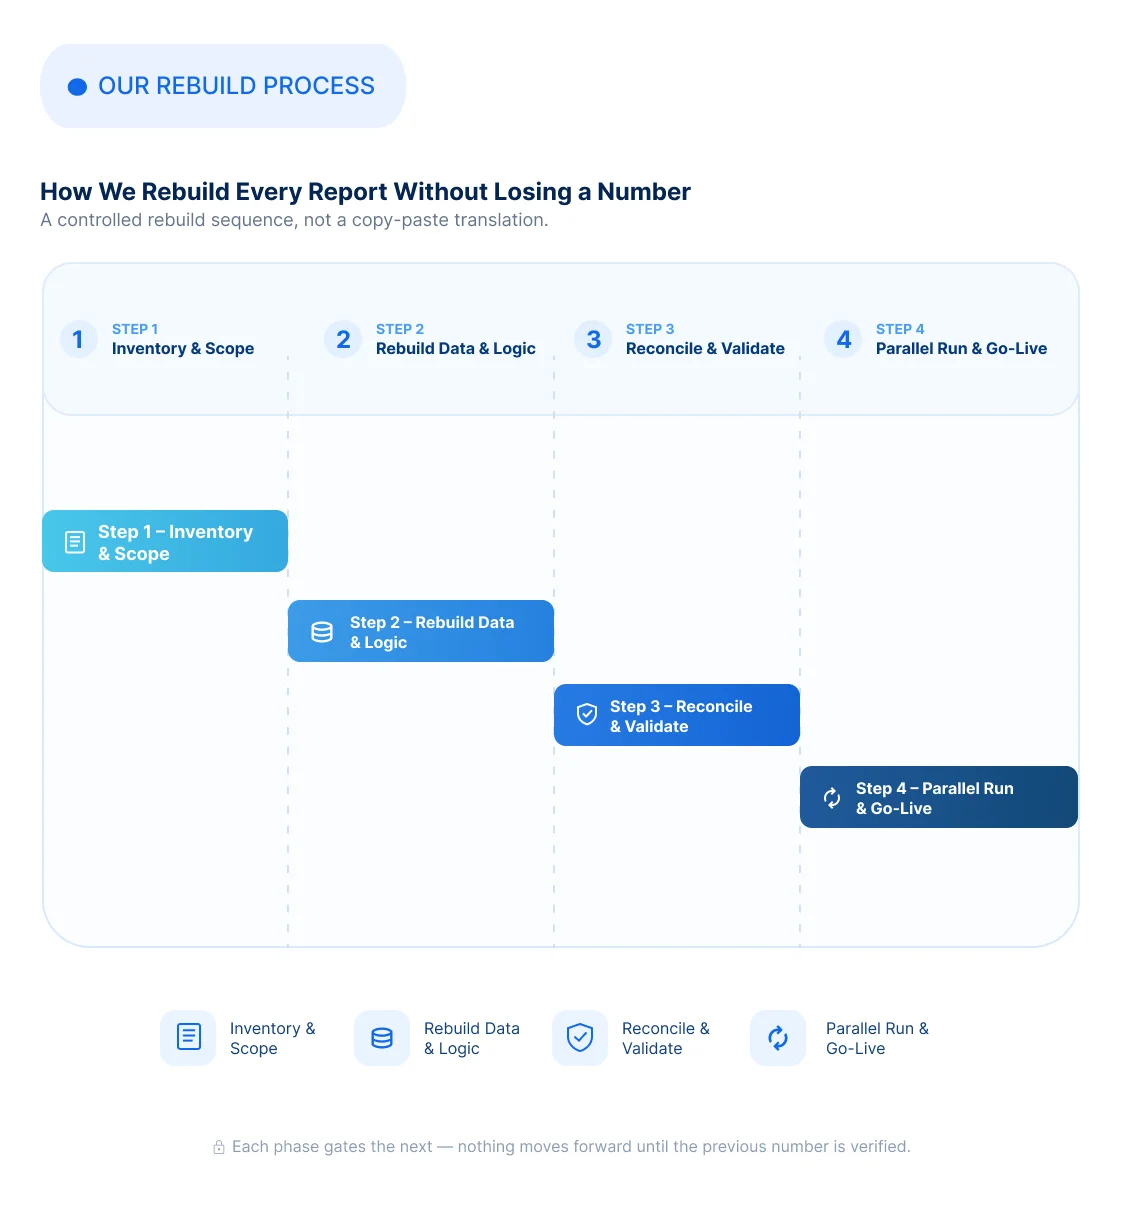
Our Power BI migration services follow a controlled rebuild sequence: inventory, data layer, logic, visuals, reconciliation, deployment, then a parallel run. Skip a step and the numbers drift; run all seven and the report holds up to scrutiny.
We catalogue every report and workbook feeding it: usage, sources, parameters, filters, row-level security. A large share turns out dead or duplicated, so this step alone keeps the rebuild lean and the cost down.
Clean, validated data lands in the new warehouse, often Microsoft Fabric, before anything else is touched. Heavy logic sits there too, close to the source, so every report downstream inherits it automatically.
Relationships, measures, and logic get re-expressed in Power BI's own paradigm, DAX and star schema, matched to intent the way Qlik set-analysis, Cognos calculated members, or SSRS expressions were built to work.
Visuals move from old reports to new ones using .pbip files, which speeds the migration without rebuilding from scratch. The goal is the analytical intent and visuals stakeholders already recognize.
Each rebuilt report goes through parity validation and data reconciliation: totals checked across key dimensions, then every visual checked against the source. Every comparison gets recorded, for sign-off and for later reference.
Reports move to UAT for your test group, then Power BI deployment pipelines promote the validated workspace to production. The new model gets Endorsed as Promoted or Certified, marking it the source of truth.
Legacy stays live until the new environment is fully verified, so nothing switches off early. A parallel run catches what reconciliation missed, with rollback ready on both the report and ETL layers.
Tableau and Power BI are both capable enterprise platforms. Switching between them is usually a question of fit, covering where your stack is heading, how your team works, and what licensing and governance need to look like. Here's an honest, factual comparison, and where moving to Power BI makes sense.
If your team is already running into one of these, the case for moving is already made.
If your data platform is consolidating onto Azure and Fabric, Power BI sits inside that stack rather than beside it, querying OneLake directly through Direct Lake instead of adding another connector and another semantic layer to keep in sync.
Above F64 capacity, viewers read reports on a free licence, so cost stops scaling with headcount. That's a different economics curve than a per-user Creator or Explorer model, where every new viewer is one more licence to plan for.
Contract renewals are the natural moment to compare, and Fabric usually shifts the maths, since moving spend from per-user Pro or Premium licences onto a single capacity tier changes the calculation more than the visualization layer does.
NeenOpal's Power BI migration services connect to a full Power BI practice, spanning strategy, dashboard development, and Fabric modernisation, so your whole analytics stack moves as one.
Full-cycle Power BI implementation, dashboard design, and DAX optimization tailored to your business.
Discover MoreEmbedding interactive Power BI analytics directly inside your own applications, portals, and products.
Discover MoreCustom, KPI-driven Power BI dashboards built for faster, clearer, more confident business decisions.
Discover MoreA dedicated project manager plus the Power BI migration team your estate needs, owning inventory, rebuild, reconciliation, and handover end-to-end.
Request a migration assessmentCertified Power BI developers join your existing team for the migration work, DAX and semantic-model rebuilds, or reconciliation you don't have in-house bandwidth for.
Find available Power BI expertsOne platform or data-layer migration, fixed scope, fixed price, and milestone-based delivery, so you know the cost, timeline, and outcome before work begins.
Get a project estimateFidelity, downtime, rollback, performance, the questions that matter before you commit budget to a Power BI migration, answered plainly.
One moves you off legacy BI to Power BI, rebuilding the analytics layer from scratch. The other modernises the data layer underneath onto Microsoft Fabric. They often run together.
Every report is validated against its legacy counterpart at aggregate level across dimensions and visual by visual, with every comparison documented.
In phases, with zero downtime: the legacy environment stays fully live until the new one is verified, so users are never cut off. The team decides when the numbers are ready, and that's when the switch happens.
No. During inventory we identify usage across every report and Excel workbook; a large share are dead or duplicated. We migrate what's actively used, confirm a retirement list with you, and rebuild only what earns its place in the new environment.
Yes. The .pbip report layer has Git integration, so a previous version of any report, visuals and calculations included, can be restored quickly, and SharePoint version checkpoints give an extra recovery point wherever .pbip isn't in use yet. On the ETL layer, Azure DevOps or Git handles rollback where formal pipelines are in place; where they aren't yet, common since full DevOps deployment needs Premium capacity and engineering maturity many mid-market teams are still building, rollback takes more coordination but is treated as the top priority the moment it's needed.
We pause consumption, retrace the delta, and, since the usual cause is a data-freshness mismatch, build "last updated" and "last refresh" timestamps into every report.
Yes, including replacing Excel inputs with parameter tables and resolving slicer and performance issues, as on the EI Simulator.