

Working with dynamic measures in Power BI is one of those areas where things look simple from the outside but get complicated the moment you try to build something flexible. A business user wants a Power BI Matrix Visual where they can pick any two measures from a slicer, compare them side by side, and see the results broken down by quarter and month. It sounds reasonable. But as soon as you start building it, you realise the usual approaches do not hold up.
That is exactly the situation NeenOpal ran into while working on a reporting solution for one of our clients. We started with SWITCH logic, which seemed like a natural fit. It worked well with a small number of measures. But as the measure count grew, Power BI started throwing memory errors, the Matrix slowed down significantly, and maintaining the DAX code became increasingly painful.
The root cause was straightforward once we identified it: Power BI evaluates every branch of a SWITCH statement on every query, not just the one the user selected. The fix was Power BI Calculation Groups, a feature that lets you define DAX logic once and have Power BI apply it dynamically, evaluating only what is actually needed. In this post, we walk through the full story: the requirements, why SWITCH fell short, and how Calculation Groups solved the problem.
1. The Client's Challenge
The client needed a Power BI Matrix Visual that gave business users complete flexibility over what they compared and how. The requirements were specific.
- The column layout had to follow a fixed hierarchy: Measure Name, then Quarter, then Month.
- Users should be able to add or remove measures from the visual using a slicer, without needing any developer help.
- Any measure should be comparable with any other measure, whether that is Value 1 versus Value 2, Value 1 versus Value 3, or any other pairing.
- The rows also needed to be dynamic and respond to user selections, not be hardcoded.
A field parameter handles slicer-driven measure selection reasonably well, but it cannot produce a column hierarchy with Measure Name sitting at the top level. That gap is what made this problem genuinely tricky and led to the first attempt at a solution.
2. First Approach: SWITCH Logic
What Was Built
The initial solution used three tables and two key measures. A KPI Table held measure names entered manually, including Value 1, Value 2, Value 3, and their pre-calculated differences. A Base Table and a Comparison Table were created as disconnected lookup tables to drive the Base and Other slicers. The Switch1 measure returned the value selected from the Base slicer, while Switch2 returned the value selected from the Other slicer. A Main SWITCH Measure combined both and computed the Base versus Other difference.
With three measures, this worked exactly as expected. The Matrix rendered correctly, the column hierarchy held up, and users could compare any pair of measures freely.
Why Power BI SWITCH Performance Breaks Down at Scale
The problem emerged as more measures were added. Power BI does not evaluate SWITCH lazily. It runs every single branch every time a query executes, regardless of which option the user has actually selected. This means the workload does not grow in line with the number of measures. It grows combinatorially.
The number of unique pairings follows the formula N multiplied by N minus 1, divided by 2. With 10 measures, that is 45 active branches. With 20 measures, it becomes 190. Each of those branches runs a full measure calculation across every row and column in the Matrix, and the model was doing all of that work on every single query.
Power BI began returning "Query has exceeded the available resources" errors. The Matrix loaded slowly, and on some occasions it did not load at all. Adding even one new KPI meant going back and rewriting the SWITCH logic across multiple measures. It was not a sustainable approach.
3. The Fix: Power BI Calculation Groups
What Are Power BI Calculation Groups?
Power BI Calculation Groups are a feature of the Tabular Object Model that let you write a DAX expression once, inside a Calculation Item, and have Power BI apply it dynamically to whichever measure is currently in context. Instead of writing separate logic for every possible pairing, you write it once, and the engine handles the rest.
The critical difference from SWITCH is that Power BI only evaluates the Calculation Item that is actually in use at any given moment, not all of them. That single change in how evaluation works is what makes Calculation Groups the right solution for scenarios like this one.
Common uses include applying time intelligence calculations such as year to date, month to date, and prior year uniformly across all KPIs, handling currency conversion across a multi-measure model, and enabling the kind of dynamic measure switching in Matrix or Table visuals that this project required. If you want to stay up to date with what else is new in the platform, our roundup of the latest Power BI features is a good place to start.
How Calculation Groups Enable Dynamic Measures in Power BI
Once we moved to Calculation Groups, the exponential growth problem disappeared. There is no longer a branch for every possible measure pairing. There is one Calculation Item that handles any pairing dynamically, and Power BI only evaluates it when it is in context. Memory usage dropped significantly, and the model became much easier to work with.
Building dynamic measures in Power BI this way also makes the model much easier to scale. Adding a new KPI means adding a single Calculation Item. Nothing else in the model needs to change, no matter how many measures you eventually add. To see how NeenOpal applies this kind of thinking in practice, take a look at how we built a dynamic Power BI dashboard for a global pharma client.
4. How the Solution Was Built
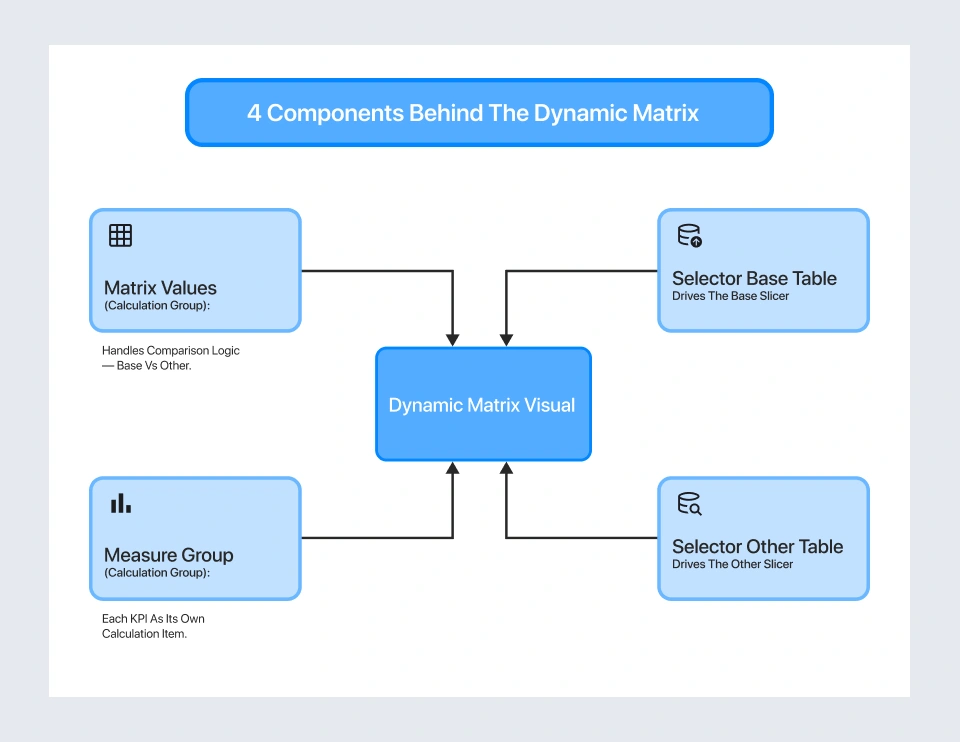
The redesigned model has four components. Each one plays a specific role, and together they make the dynamic Matrix work cleanly and efficiently.
1. Calculation Group: Matrix Values
This group handles the comparison logic at the visual level. Inside it, there is a Compare Type grouping with individual Calculation Items for each measure, VAL1, VAL2, and VAL3, along with a Base vs Other item. The Base vs Other item uses the SELECTEDMEASURE() function to dynamically retrieve both the base and comparison values and compute the difference between them, without needing to know in advance which measures the user will select.
2. Calculation Group: Measure Group
Each KPI is defined as its own Calculation Item inside this group. Using SELECTEDMEASURE(), each item returns the value of whichever base measure is currently being evaluated. This is what gives the Base vs Other item in the Matrix Values group the ability to pull any measure dynamically at runtime.
3. Selector Base Table
This is a disconnected lookup table listing all available KPIs. It powers the Base slicer on the report canvas. When a user picks a measure from this slicer, the selection flows into the DAX filter context and tells the Base vs Other Calculation Item which measure to treat as the base value.
4. Selector Other Table
This table has the same structure as the Selector Base Table but drives the Other slicer instead. Because the two tables are completely independent, the user can compare any measure against any other measure in any combination, with no conflicts.
How It All Connects
When a user interacts with the report, the flow is straightforward. They select a Base measure from one slicer and an Other measure from the second slicer. The Base vs Other Calculation Item picks up both selections, calls SELECTEDMEASURE() for each, and calculates the difference. The Matrix automatically renders columns in the correct order: measure name, then quarter, then month. And if a new KPI needs to be added later, one new Calculation Item in the Measure Group is all it takes.
5. Results: Before and After
The impact on the Power BI Matrix Visual was immediate and measurable. Every issue that had been slowing the model down was resolved.
- Memory Errors Stopped Appearing Entirely: The "Query has exceeded available resources" message has not come back, regardless of how many measures are included in the model.
- The Matrix Loads Much Faster: Because only the selected Calculation Item is evaluated, the query footprint is a fraction of what it was under the SWITCH approach.
- The Model Scales Cleanly: New KPIs can be added at any time without touching the existing logic or worrying about performance degradation.
- Maintenance is Straightforward: All comparison logic sits in one Calculation Item instead of being spread across a growing tangle of SWITCH branches.
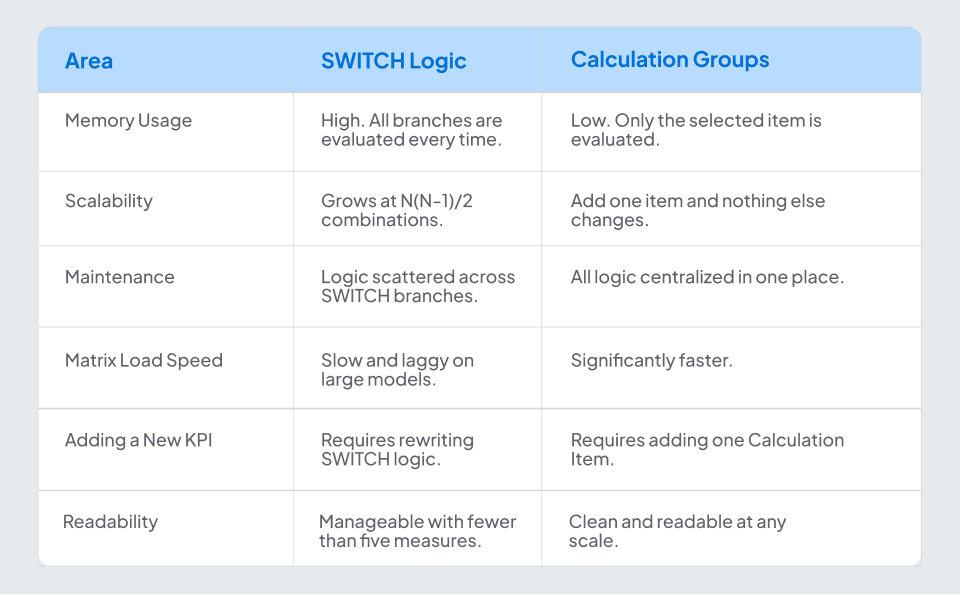
SWITCH versus Calculation Groups: At a Glance
6. Drawbacks to Know
Calculation Groups are genuinely powerful, but they do come with a few nuances that are worth understanding before you adopt them in a model:
- Implicit Measures Do Not Work Well with Calculation Groups: Power BI automatically creates implicit measures, such as SUM or MAX of a field, when a column is dragged into a visual. Because Calculation Groups dynamically override measure logic, these auto-generated measures can produce unexpected results. The fix is to convert all implicit measures to explicit DAX measures before introducing any Calculation Groups into the model.
- Standard Conditional Formatting May Not Behave as Expected: Calculation Groups change the evaluated measure result rather than the underlying base measure. Formatting rules that reference base measure values can therefore produce incorrect output. Visual Calculations are the recommended alternative here, since they operate on the final rendered values rather than the base measures.
- Multiple Calculation Groups Require Explicit Precedence Settings: When more than one Calculation Group is active in the same model, the evaluation order must be set deliberately in Tabular Editor or through the XMLA endpoint. Without a defined precedence, the order is unpredictable, and results can be wrong.
7. When Should You Use Calculation Groups?
Calculation Groups are not the answer to every situation. For a small, simple model with three or four measures, a well-written SWITCH statement is easier to set up and perfectly fine to maintain. If you are just getting started, it helps to first get comfortable with the basics of Power BI before jumping into Calculation Groups. The case for Calculation Groups builds as complexity grows.
1. Consider Calculation Groups when:
- You have five or more measures that share similar time intelligence or comparison logic.
- Your SWITCH statement has grown beyond eight to ten branches and is becoming a maintenance burden.
- Users need to switch between measures dynamically using a slicer.
- You are hitting memory errors or slow refresh times on a Matrix or Table visual.
- You want to add new KPIs to the model later without rewriting any existing DAX logic.
2. Stick with SWITCH when:
- Your model has three to four measures, and the logic is straightforward to follow.
- Your team is not yet familiar with Tabular Editor or the Calculation Group configuration process.
- The report does not require dynamic measure comparison, and a static layout is sufficient.
Conclusion
When SWITCH logic stops scaling, Power BI Calculation Groups are the right way forward. They let you write the comparison logic once, keep memory usage low, and make the model easy to grow over time without touching existing DAX.
The solution NeenOpal built comes down to four components working together: a Matrix Values Calculation Group for comparison logic, a Measure Group Calculation Group for each KPI, and two Selector tables for the Base and Other slicers. Together, they deliver a fully dynamic Power BI Matrix Visual that is fast, clean, and simple to extend as new measures are added.
If your Power BI reports are running into memory errors or your DAX model is getting too large to manage, Calculation Groups are worth exploring.
NeenOpal's Power BI consulting team can help you evaluate your current model and redesign it for performance and scalability. Get in touch with us to start the conversation.
Frequently Asked Questions
Q1. What is the difference between SWITCH and Power BI Calculation Groups?
SWITCH evaluates every branch of its logic on every query, regardless of what the user has selected. This means memory usage and query time grow quickly as the number of measures increases. Power BI Calculation Groups work differently. They evaluate only the Calculation Item that is currently in context, which keeps memory usage low and performance consistent no matter how many measures your model contains.
Q2. Do I need Tabular Editor to use Power BI Calculation Groups?
Calculation Groups can be created in Power BI Desktop. However, Tabular Editor is recommended for production use and complex precedence scenarios. You will also need Tabular Editor if you are working with multiple Calculation Groups and need to set precedence between them.
Q3. Can Calculation Groups be used with any Power BI visual, or only the Matrix?
Calculation Groups work across all Power BI visuals, not just the Matrix. They are commonly used with tables, bar charts, line charts, and any other visual that displays measure values. The Matrix visual is a particularly common use case for dynamic measure switching because of its column hierarchy structure, but the underlying Calculation Group logic applies equally to any visual where you want measure behaviour to change dynamically based on user selection.
