

When a Fortune 500 BI lead recently asked their team to render an end-to-end customer journey on a Power BI dashboard, the answer came back blunt: the native visual library couldn't deliver the Sankey diagram their executives wanted at the fidelity they needed. The team's verdict: escalate to a Power BI to Tableau migration. That moment captures a quiet shift happening across enterprise analytics teams in 2026. According to the Gartner Magic Quadrant for Analytics and BI Platforms, both Power BI and Tableau remain leaders, but their architectural philosophies are diverging, and so are the use cases that push organizations to switch.
Most articles on this topic treat the move as a tooling upgrade. It isn't. A Power BI to Tableau migration, at its core, is a calculation engineering project disguised as a visualization refresh. Every successful Power BI to Tableau migration we've delivered hinges on what happens beneath the dashboards. The dashboards themselves rebuild quickly. The DAX measures, the row-level security rules, and the semantic layer do not. And the deeper your Power BI stake, the more this gap matters.
This guide draws on the working experience of NeenOpal's Tableau development team Shruthi Ravi (Tableau Developer) and Suriya Prakash M who have led multiple enterprise migrations between the two platforms. Throughout, you'll see why we believe a manual, redesign-first approach beats every "70-90% automated conversion" pitch in the market. If you're evaluating whether to migrate Power BI to Tableau or scoping the budget for one, this article was written for you.
What Is Power BI to Tableau Migration?
A Power BI to Tableau migration is the structured process of moving dashboards, reports, semantic models, calculations, and security configurations from Microsoft Power BI to Tableau. It is fundamentally a rebuild, not a file conversion. Power BI .pbix workbooks cannot be imported into Tableau Desktop because the two platforms use different calculation engines (DAX vs. Tableau calculated fields and LOD expressions), different data modeling assumptions, and different visualization frameworks.
A complete Power BI to Tableau migration covers five distinct workstreams: the visualization layer (visuals, dashboards, layouts), the calculation layer (every DAX measure rewritten as a Tableau calculated field), the semantic layer (data sources, relationships, joins), security (Row-Level Security and user filters), and licensing (mapping Power BI Pro/Premium users to Tableau Creator, Explorer, and Viewer tiers). Skipping any one of these is the most common reason a Power BI to Tableau migration goes over budget.
Why Enterprises Migrate from Power BI to Tableau
The reasons enterprises switch are surprisingly narrow. After dozens of conversations with BI leads, three drivers explain almost every Power BI to Tableau migration our team has worked on.
Advanced Visualization Needs: Where Most Migrations Begin
The number one trigger is rarely cost or licensing. It is the visualization wall. Teams hit a chart type that Power BI cannot render natively at the fidelity executives are asking for: Sankey diagrams for customer journey analytics, sophisticated network maps, multi-layered radial visualizations and the workaround custom-visual marketplaces are either slow, paid, or unsupported in their tenant.
"One of the clients requested to shift from Power BI to Tableau because of the visualization. They wanted a Sankey chart and other complex visuals at that point, it was not easy to do that in Power BI." Shruthi Ravi, Tableau Developer, NeenOpal
This is the heart of the Sankey chart Power BI vs Tableau question that shows up repeatedly in searches. Tableau ships a richer out-of-the-box flow, journey, and density visuals and pairs them with a fluid calculation layer that handles path-style data more naturally. In our experience, this single capability gap is the most common opening question in any Power BI to Tableau migration scoping call.
Microsoft Ecosystem Lock-In
The second trigger is structural. Power BI is engineered to thrive inside the Microsoft stack, Microsoft Fabric, Azure Synapse, Microsoft 365, Power Query, and Copilot. That tight coupling is a feature for Microsoft-first shops and a constraint for everyone else.
"If somebody works with Power BI, they are kind of stuck to the Microsoft ecosystem. The Tableau ecosystem can work anywhere." Suriya Prakash M, Tableau Developer, NeenOpal
Enterprises running multi-cloud architectures across Snowflake, Databricks, AWS Redshift, BigQuery, and Salesforce Data Cloud routinely choose Tableau for its platform-agnostic posture. That is something that people are unable to address during Power BI to Tableau migration projects in 2026.
Self-Service Analytics Maturity
A third, smaller cohort migrates when their analyst community outgrows Power BI's authoring model. Tableau's longer self-service heritage, Tableau Desktop, Tableau Server, Tableau Cloud, plus Tableau Pulse and Tableau Agent, appeals to organizations where business analysts, not central IT, drive dashboard development.
One myth worth puncturing: cost is rarely the primary driver to migrate Power BI to Tableau. Tableau is generally the more expensive platform per seat. Power BI to Tableau migration cost discussions tend to come up only after the visualization or ecosystem decision has already been made.
The Technical Challenges Most Teams Underestimate
Most Power BI to Tableau migration challenges live below the visual surface. Three of them blow up timelines if they aren't planned for in week one.
DAX-to-Tableau Calculation Translation: The Heaviest Lift
"In Tableau, the calculator feature is comparatively simple. DAX is bit more logical, so that's one thing." Shruthi Ravi
This is the part everyone underestimates. DAX is a deeply logical, context-aware language built around row context, filter context, and the CALCULATE function. Tableau's calculation model is leaner: calculated fields, table calculations, and Level of Detail (LOD) expressions. The two are not interchangeable.
"The biggest challenge is the calculation. We have to look into the calculations in Power BI and come up with a similar approach in Tableau." Shruthi Ravi, Tableau Developer, NeenOpal
The DAX to Tableau translation problem is non-trivial. A Power BI measure like CALCULATE([Total Sales], FILTER(Sales, Sales[Region] = "EMEA")) doesn't lift directly. In Tableau, the equivalent is often a FIXED LOD: {FIXED [Region]: SUM([Sales])} combined with a region filter, but the choice between FIXED, INCLUDE, and EXCLUDE depends on the surrounding view, not the original DAX shape. Similarly, a SAMEPERIODLASTYEAR DAX time-intelligence pattern becomes a date-offset calculated field plus a window calculation in Tableau.
No reliable automated DAX to Tableau converter exists in 2026. Every credible Power BI to Tableau migration today rebuilds calculations by hand.
Data Model Restructuring and the Semantic Layer
Tableau historically lacked the multi-fact, multi-modal data modeling that Power BI shipped with composite models and DirectQuery. That gap closed several Tableau versions ago. Today, Tableau supports relationships, multi-fact analysis, and a flexible semantic layer well enough that data modeling is no longer the blocker it once was.
Where teams still trip: bidirectional filters in Power BI rarely have a one-to-one Tableau equivalent, star vs. snowflake schemas behave differently inside Tableau's relationship model, and Power Query (M language) transformations don't port; they have to be rebuilt either in Tableau Prep or pushed upstream to the data warehouse.
Row-Level Security (RLS) Rebuild
Row-level security is the silent failure point of nearly every Power BI to Tableau migration. Power BI's RLS is configured inside the model. Tableau implements Row-Level Security through user filters joined to an entitlement table, often combined with the USERNAME() or ISMEMBEROFGROUP() functions. The pattern is different, the validation requirement is heavier, and embedded dashboards behave differently under each model.
Our rule: never go live on Tableau row-level security from a Power BI rebuild until the rules are validated against at least three role personas (executive, regional manager, and individual contributor). The cost of catching a Tableau RLS gap after go-live is an order of magnitude higher than catching it during QA.
NeenOpal's 7-Stage Power BI to Tableau Migration Roadmap
Most Power BI to Tableau migration guides skip the process. We won't. Below is the seven-stage roadmap we run for every enterprise engagement.
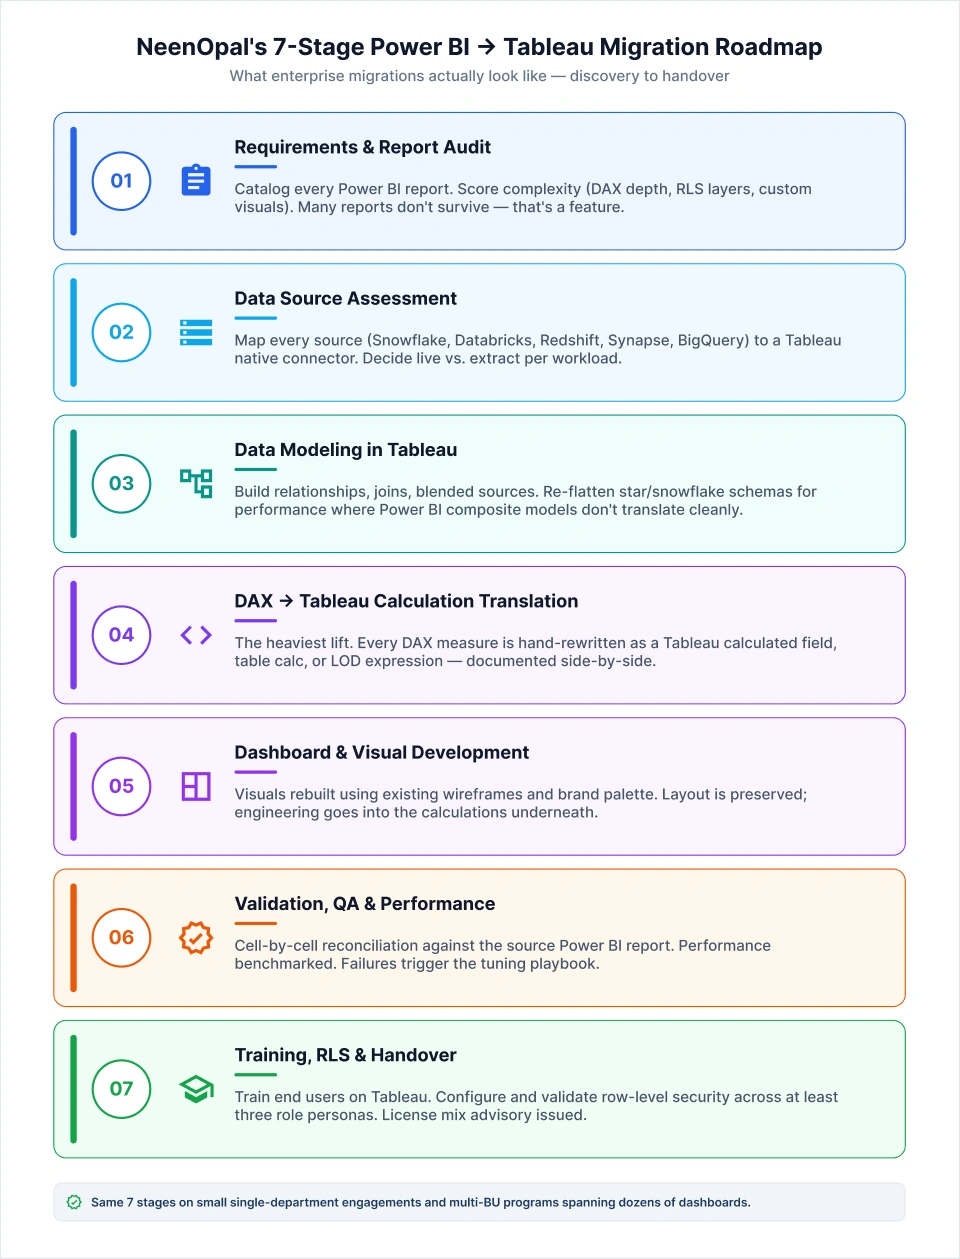
- Business requirements and existing report audit. Catalog every Power BI report, identify business owners, score complexity (DAX depth, RLS layers, custom visuals), and confirm what stakeholders actually want to see in Tableau. Many reports don't survive this stage, and that's a feature, not a bug.
- Data source assessment and connector strategy. Map every source system (Snowflake, Databricks, AWS Redshift, Azure Synapse, BigQuery, and on-prem SQL) to a Tableau native connector. Decide on live vs. extract per workload. This is where you also catch the Power Query transformations that need to move upstream.
- Data modeling in Tableau. Build the relationships, joins, and blended sources Tableau needs. Now that Tableau supports multi-modal models, most Power BI semantic patterns translate but star and snowflake schemas often need to be re-flattened for performance.
- Calculation translation — DAX → Tableau calculated fields. This is the heaviest lift. Every DAX measure is rewritten as a Tableau calculated field, table calculation, or LOD expression. We document the source DAX and the target Tableau side by side for audit.
- Dashboard and visual development. Visuals and dashboards are rebuilt referencing existing wireframes and color palettes; layout is preserved while the engineering focus stays on the calculations underneath. We accelerate this stage using Mokkup.ai. Mokkup's conversational AI allows you to upload your existing report as screenshots and attach sample data for more accuracy. Once uploaded, you get a wireframe that can be easily exported as a starter workbook in Tableau. You can also specify your calculations and how each visual is built in Power BI to get an even closer export in Tableau. From there, you just have to verify the calculations, replace your actual dataset, and the dashboard is ready.
- Validation, QA, and performance testing. Numbers are reconciled cell-by-cell against the source Power BI report. Performance is benchmarked. Failures trigger the post-migration performance playbook (covered below).
- User training, RLS configuration, license advisory, and documentation handover. Train end users on Tableau navigation. Configure and validate row-level security. Issue a license mix recommendation. Ship a documentation pack the client owns.
This roadmap is the difference between a Power BI to Tableau migration that lands on schedule and one that drifts into a multi-quarter rebuild. We've used the same seven stages on small, single-department engagements and on multi-business-unit Power BI to Tableau migration programs spanning dozens of dashboards.
Which Power BI Assets Migrate Cleanly and Which Need Rebuilding
A useful frame: when you migrate Power BI to Tableau, very little is genuinely copied. Most assets are referenced or rebuilt.
What Rebuilds Cleanly (with Referencing, Not Conversion)
Dashboard layouts, visual hierarchy, spacing systems, color palettes, and brand styling carry over cleanly because the design already exists as a reference layer. Tools like Mokkup.ai make this even faster. Its semantic layer feature lets teams upload a screenshot of any existing dashboard and instantly generate a fully structured dashboard ready for their Tableau environment, downloadable with a single click. That means developers get a BI-native spec to rebuild from rather than starting a redesign from scratch.
"Redesign won't be that much of an issue because we already have the design and color palette. We are just replicating what is there." Shruthi Ravi, Tableau Developer, NeenOpal
Data source connections also "migrate" cleanly in the sense that the same warehouse, lakehouse, or database powers the new Tableau workbooks via Tableau's native connectors.
What requires a complete rebuild
DAX measures and calculated columns become Tableau calculated fields and LOD expressions. Power Query (M language) transformations move to Tableau Prep flows or to warehouse-side SQL. Row-level security is reconfigured from scratch using Tableau user filters and entitlement tables.
What's a Wash
Embedded reports generally translate without drama. Tableau's embedded analytics story (JS API, Connected Apps, Tableau Embedding API v3) is mature. Bookmarks, drill-throughs, and tooltip behavior need light adjustment but no fundamental redesign.
|
Power BI Asset |
Tableau Equivalent |
Migration Effort |
|
Visual layout & color palette |
Tableau dashboard (rebuilt) |
Light — reference-based |
|
DAX measures |
Calculated fields / LOD expressions |
Heavy — manual rewrite |
|
Power Query (M) |
Tableau Prep/warehouse SQL |
Medium-heavy |
|
Semantic model |
Tableau data source + relationships |
Medium |
|
Row-Level Security |
User filters + entitlement table |
Heavy — full rebuild |
|
Embedded reports |
Tableau Embedding API |
Light |
|
Bookmarks / drill-through |
Filter actions / set actions |
Light-medium |
This table is the single best Tableau vs. Power BI for visualization migration reference you can hand to a stakeholder asking, "What actually changes?"
Automated vs. Manual Migration: Why We Choose Manual
Every BI services vendor in this market pitches automation. BIChart, Sparity BIPort, WinWire iAURA, and a long list of Power BI to Tableau migration tools advertise 70-90% time savings via automated DAX-to-Tableau conversion. The marketing is compelling. The output is not.
Our experience: automated conversion tools produce brittle calculations, mistranslated filter contexts, and dashboards that need to be rebuilt anyway, only now with the added cost of debugging a generated layer no one on your team owns. The "70-90% automated" number rarely survives the QA phase, and the cleanup work often takes longer than a clean-sheet rebuild would have.
NeenOpal's stance is contrarian and deliberate: we rebuild Power BI to Tableau migrations manually using Tableau-certified developers. This isn't a luxury position; it's a quality position. A manual rebuild lets the team pick the right Tableau-native pattern (an LOD where a CALCULATE was forced or a table calculation where a DAX iterator was over-engineered) rather than transliterating one mental model into another.
Where automation does earn its place: metadata extraction. Tools that inventory Power BI workbooks, surface DAX complexity scores, and flag custom visuals are genuinely useful in the discovery phase. Just don't confuse inventory automation with conversion automation. They are not the same product.
Post-Migration Performance Tuning
Here is the truth most migration vendors won't say out loud: Tableau dashboards are often slower than the Power BI originals on day one. Tableau's render engine is more sensitive than Power BI's to wide tables, filter sprawl, and nested calculated fields.
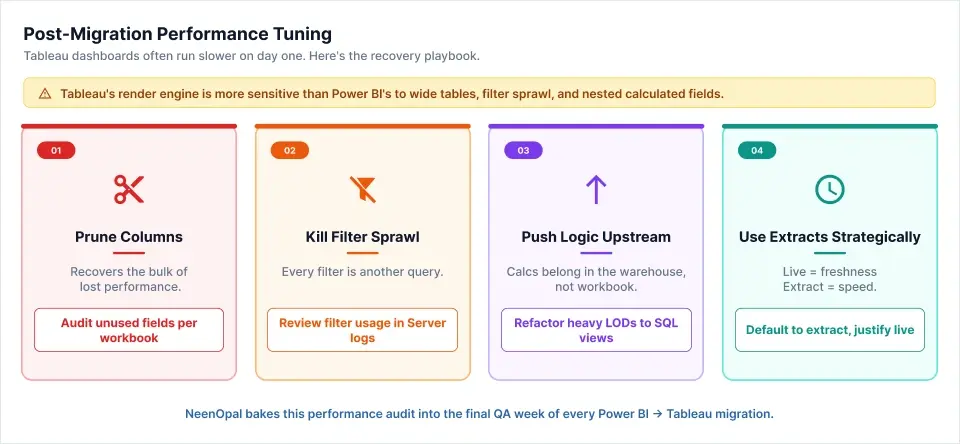
"The Tableau dashboard was very slow compared to the earlier one. The number of columns plays an important role in Tableau." Shruthi Ravi, Tableau Developer, NeenOpal
The recovery playbook is consistent across every Power BI to Tableau migration we've run:
Prune columns. Tableau materializes columns into memory in ways that punish wide tables. Reduce data sources to only the columns the dashboard actually consumes. This single move recovers the bulk of lost performance.
Challenge filter sprawl. Every additional filter in Tableau is an additional query. Sit with the client and ask, "Do you actually use these views?" Filters that exist because someone added them once and never removed them are the easiest performance win on the table.
Push heavy logic upstream. Calculations that belong in the warehouse or in Tableau Prep should not live as nested calculated fields inside the workbook. Move time intelligence, aggregations, and joins as far left as possible.
Use extracts strategically. Live connections are great for freshness and painful for performance. For most executive dashboards, a scheduled Tableau extract is the right answer. We bake this performance audit into the final QA week of every Power BI to Tableau migration before the client sees the rebuilt dashboards.
A note on honesty: we don't yet have a deep library of published before/after performance benchmarks for our migrations. Performance gains depend heavily on starting data model quality, and we'd rather flag that gap than fabricate numbers.
Tableau Licensing After Migration: Which Tier for Which Users
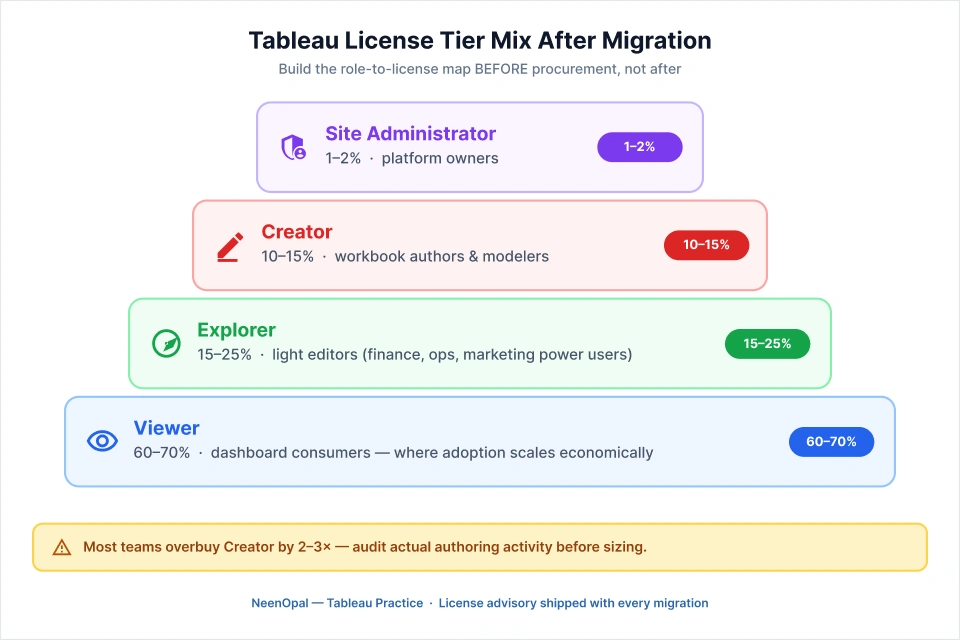
Tableau licensing is the section that no competing Power BI to Tableau migration guide bothers to write, and it's the one your procurement team will need first. Getting the license mix right is one of the cleanest wins in any Power BI to Tableau migration plan. Tableau's licensing model differs structurally from Power BI's Pro/Premium split, and getting the license mix wrong is a six-figure mistake that's easy to avoid.
Tableau Creator. For analysts and developers who build workbooks. This is the most expensive tier and the one most teams over-provision. Reserve Creator licenses for genuine authors.
Tableau Site Administrator (Creator-level). For platform owners, governance leads, and admins managing sites, projects, permissions, and users. One or two per organization is usually right.
Tableau Explorer. For users who edit existing workbooks (light authoring) but don't build new data sources from scratch. Often, the most underused tier, Explorer fits power users in finance, ops, and marketing better than Creator does.
Tableau Viewer. For everyone who consumes dashboards. The bulk of your seats live here. Viewer pricing is what makes large-scale Tableau adoption economically tractable.
The decision framework we ship with every Power BI to Tableau migration: build a role-to-license map before procurement, not after. Count actual authors (creators) and light editors (Explorer), and pure consumers (Viewer). Most teams overbuy Creator by 2-3x because no one paused to ask whether their "analysts" actually author new workbooks.
User Onboarding and Adoption
A successful Power BI to Tableau migration ends not at dashboard handover but at adoption. Tableau's authoring paradigm is different; pills, shelves, and the drag-and-drop calc editor take getting used to for users accustomed to Power BI's field-list-and-formula-bar model.
Our onboarding pattern is consistent: tailored documentation per license tier (Viewer manuals look nothing like Creator manuals), an initial walkthrough session at go-live, and a follow-up Q&A two weeks in, once real friction has surfaced. For larger enterprises, we recommend standing up a small Tableau Center of Excellence (CoE) to own governance, naming conventions, and ongoing enablement.
The investment compounds. A team that adopts cleanly will get more analytics value out of Tableau in year one than a team that received a great rebuild but no enablement plan. This is why we treat enablement as the closing milestone of every Power BI to Tableau migration, not an optional add-on.
Plan Your Power BI to Tableau Migration with NeenOpal
A Power BI to Tableau migration succeeds when it is treated as a redesign opportunity, not a file conversion exercise. The visual layer is the easy part. The DAX translation, the row-level security rebuild, the data model restructuring, and the license-mix advisory are where the real work and the real risk live.
NeenOpal's Tableau-certified team has run this playbook for enterprises across multi-cloud, financial services, retail, and healthcare. We take a manual-rebuild stance because it's the only stance that protects calculation accuracy at scale. If you're scoping a Power BI to Tableau migration in 2026, we'd be glad to walk you through the readiness checklist, the calculation-complexity scoring, and the license map your procurement team will need.
Book a 30-minute Power BI to Tableau migration discovery call with our Tableau practice lead or download our Power BI → Tableau Migration Readiness Checklist to start scoping internally.
FAQs
1. What is Power BI to Tableau migration?
Power BI to Tableau migration is the process of transitioning dashboards, reports, data models, calculations, and security configurations from Microsoft Power BI to Tableau. It typically happens to take advantage of Tableau's advanced analytics or get aligned with the broader BI ecosystem.
2. Why do organizations migrate from Power BI to Tableau?
Organizations that have scalability concerns and want to access superior data exploration capabilities prefer migrating from Power BI to Tableau. Additionally, Tableau provides Sankey charts and customer journey analytics that Power BI cannot render natively, and the need for richer self-service analytics enforces an organizational effort to migrate.
3. Can DAX be automatically converted to Tableau calculations?
There is no reliable automated DAX to Tableau converter that exists in 2026. DAX logic cannot be implemented in Tableau’s query language, which uses visual-based interpretations.
4. How long does a Power BI to Tableau migration take?
Timelines depend on report count, DAX complexity, and RLS depth. A typical enterprise Power BI to Tableau migration runs 8 to 16 weeks across discovery, data modeling, calculation translation, dashboard rebuild, validation, and user training.
5. What happens to row-level security during migration?
Tableau supports row-level security via user filters and entitlement tables, but it must be manually reconfigured. RLS rules from Power BI do not transfer automatically and require validation across multiple role personas before go-live.
6. Which Tableau license do I need after migrating from Power BI?
Tableau uses three role-based licenses. Creator suits report builders and data modelers who previously used Power BI Desktop or Pro. Explorer fits users who edited shared reports in the Power BI service. Viewer covers consumers who have only opened dashboards. Audit your Power BI activity logs to map each user to the right tier and avoid overspending.
