


You built a Tableau Pulse rolling average the way you'd build one in Tableau Desktop. It looked right in the Advanced Analytics Editor. The preview even rendered a clean and smooth line. Then the live metric went flat, failed to load, or showed numbers that didn't add up.
Before you blame your setup, know this: Tableau Pulse can't compute a rolling average natively, so the metric was always going to break once it went live. The fix sits upstream in your data layer. If you are looking inside Pulse, you are troubling yourself.
This article explains the two "rolling" concepts people confuse, why the calculation fails, how to confirm this is your problem, and where the rolling logic actually needs to live.
Two Things Called "Rolling" in Tableau Pulse and Why the Difference Matters
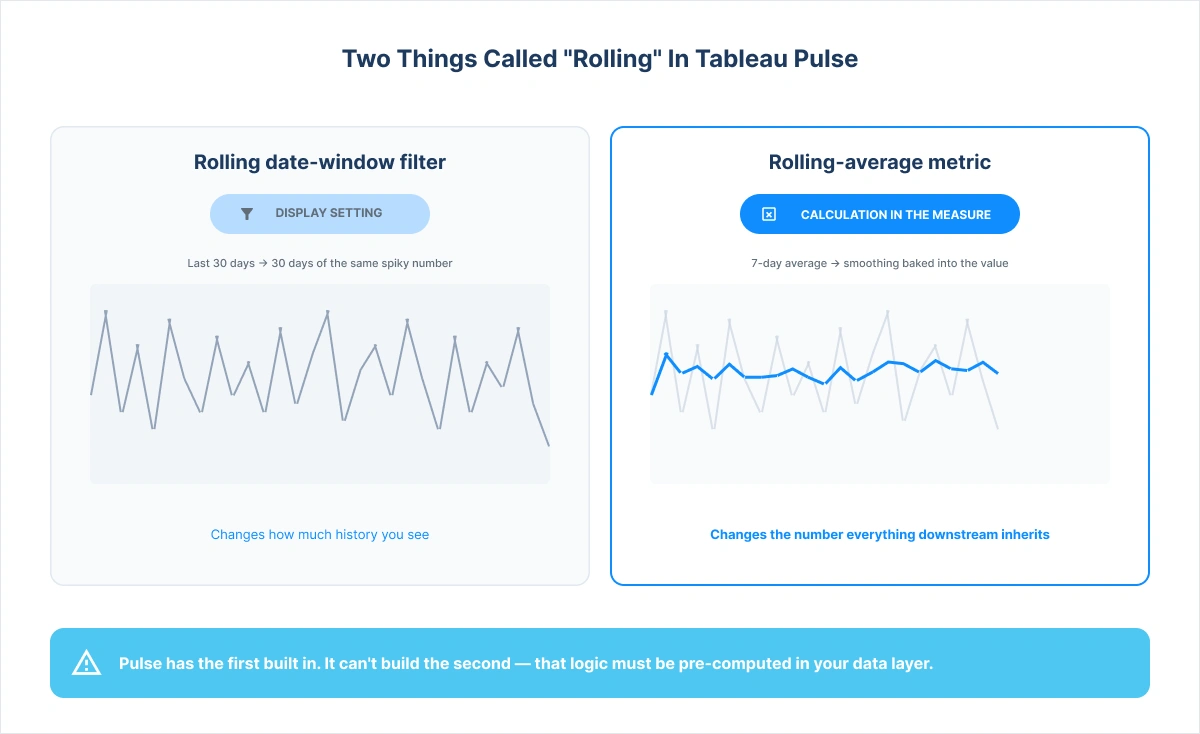
Most Tableau Pulse rolling average problems begin with a mix-up between two similar-sounding features. Pulse has a built-in rolling date filter, and most people assume it creates a rolling average. It doesn't, and that one wrong assumption is behind most of the failed setups we see.
Here's how our senior Tableau consultant Suriya Prakash M puts it:
"The rolling average we're referring to is where the metric is defined to surface a smoothed value, with the averaging logic baked into the metric or the data source calculation."
Thereby, keeping the two separate is the first step to fixing your metric.
The Rolling Date-Window Filter (Last 7/14/30/60/90 days): A Display Setting
The time-window filter shifts how much history is visible and the comparison period behind each insight. It never changes how the value is aggregated. If your daily sales number is spiky, a Last 30 Days filter shows thirty days of the same spiky number. Teams assume the filter smooths the metric, but it doesn't.
The Rolling-Average Metric Definition: Averaging Baked into the Measure
A true Tableau Pulse rolling average is a calculation, not a view setting. A 7-day moving average of daily sales recomputes each day's value as the mean of the trailing seven days. The smoothing lives inside the number itself, so everything, whether it's the digest, the insights, or Enhanced Q&A, that consumes the metric, inherits it. It's the version you want, and the one Pulse can't build natively.
When a Rolling Average Beats MTD or QTD
Before we get to why a Tableau Pulse rolling average breaks, wanting one is the right instinct. Fixed periods like MTD and QTD reset every cycle, so early in the period, they run on only a few days of data and can trigger exactly the wrong operational decision. A rolling window always looks back over the same number of days, giving a steady signal regardless of calendar position.
The stakes are real. Gartner puts the average cost of poor data quality at $12.9 million per year per organisation, and Salesforce's State of Data and Analytics report found data leaders rate roughly 26% of their data as untrustworthy.
The Day-3 trap: how fixed periods trigger the wrong action
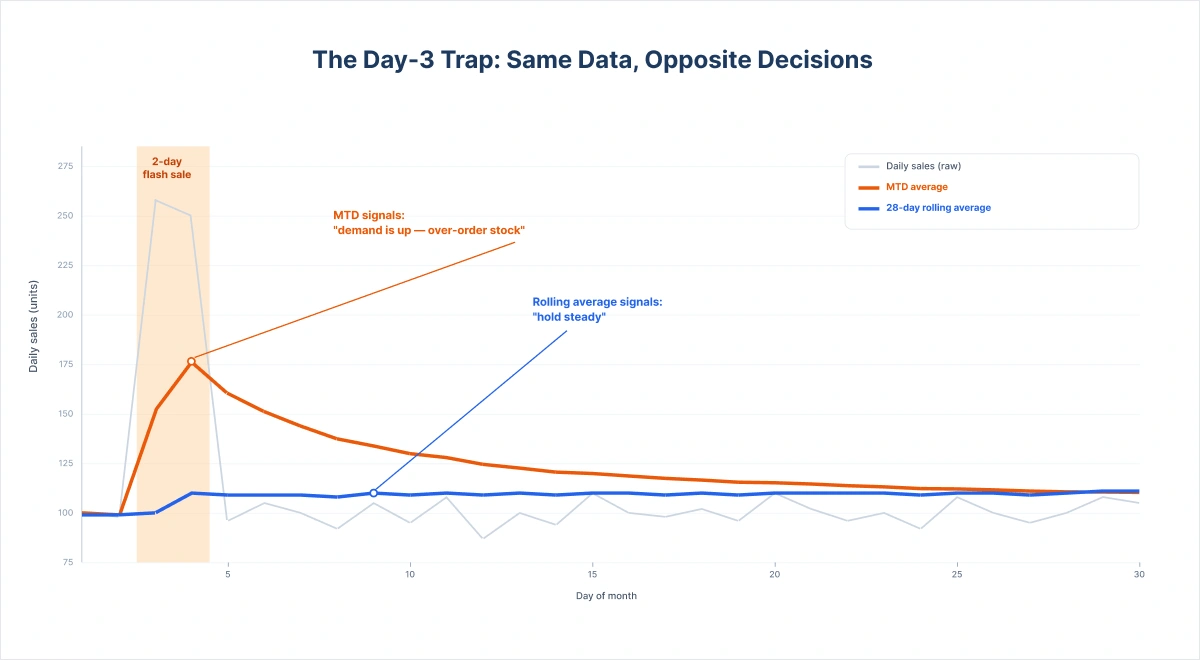
Say a retailer runs a 2-day flash sale on Day 3 of the month. MTD and QTD only have three days of data, and two of those are sale days, so both show demand shooting up. Acting on that signal, the team over-orders stock and sits on the excess for the rest of the month. When the same team started using a 28-day rolling average instead, the sales spike barely moved the number, and the restock order never went out. Same data, different calculation, opposite decision.
Which metrics actually need a rolling calculation
Not every metric earns the effort. A Tableau Pulse rolling average makes sense for volatile, high-frequency numbers that drive recurring decisions, including daily demand, win rate, active usage, and support volume. Stable, calendar-anchored totals are fine as fixed periods. If someone acts on a metric daily or weekly, smooth it; if it's reviewed quarterly, leave it alone.
If you're still deciding which metrics belong in an executive feed at all, our guide to structuring metrics in Tableau Pulse walks through what to track and what to leave out.
How Most Teams Try to Build It in Pulse (and Why the Instinct Is Wrong)
Almost everyone tries to build a Tableau Pulse rolling average the same way: open the metric definition, go to the Tableau Pulse Advanced Analytics Editor, and write the same calculation they'd use in a Desktop worksheet, usually WINDOW_AVG or WINDOW_SUM divided by the number of days. Many simply copy their Desktop calculated field across, word for word, and expect it to work the same way.
Years of tutorials reinforce that instinct, but the mental model doesn't transfer. In Desktop, a table calc runs against the view. A Pulse metric definition has no view. It's a standing definition that Pulse queries on its own schedule. Assuming a Desktop formula behaves the same inside a Pulse rolling calculation is precisely the assumption that fails.
The Hard Limitation: Tableau Pulse Does Not Support Table Calculations
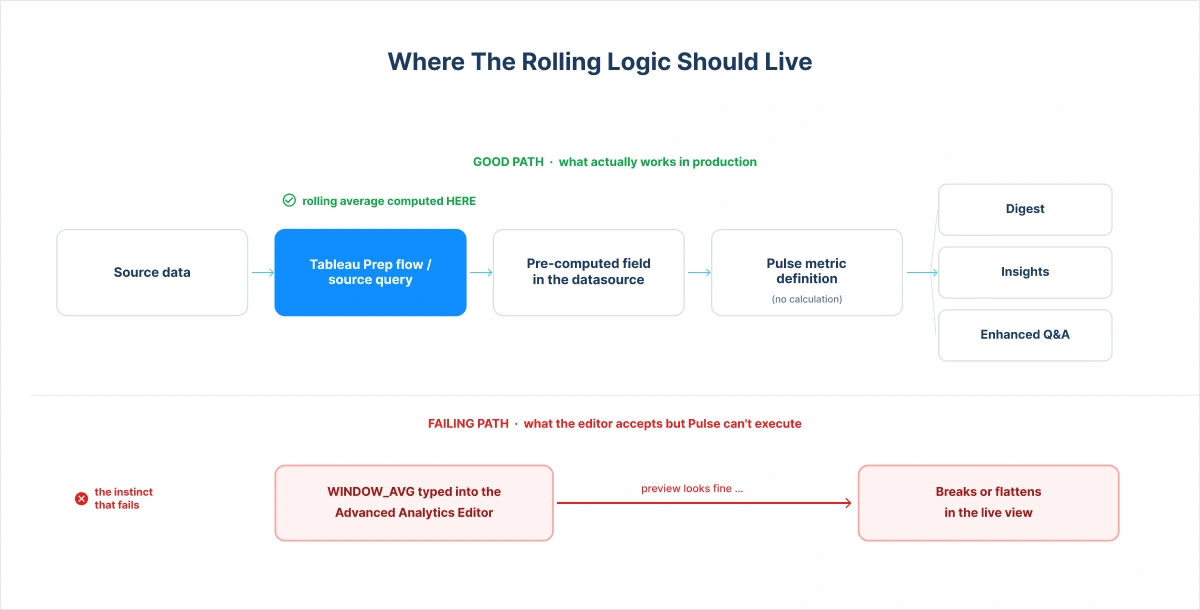
Here's the one fact no other page tells you: Tableau Pulse does not support table calculations. WINDOW_AVG, WINDOW_SUM, RUNNING_SUM, LOOKUP, none of these run in a live Pulse metric. So a Tableau Pulse rolling average built with WINDOW_AVG in the Advanced Analytics Editor will look fine in the preview and then fail once the metric goes live.
"The most common mistake is trying to build the rolling window calculation inside Tableau Pulse itself," says Suriya Prakash. "People attempt to use WINDOW_SUM or table calculations directly in Pulse's Advanced Analytics Editor, and it doesn't work because Pulse simply doesn't support table calculations. The metric appears to set up fine, but when you go live, it either breaks or shows flat, wrong numbers."
This is a platform-level restriction, not a version quirk or permissions issue. If you've been searching "tableau pulse table calculation not supported" or "rolling metric tableau pulse" hoping for a toggle, there isn't one. And nothing in the flow warns you: the editor accepts the formula without complaint, which is why teams ship a Tableau pulse moving average that was broken from day one.
The Silent Failure: Why It Looks Fine in Preview and Breaks Live
What makes this dangerous is that it fails silently. The setup completes cleanly, and the preview looks right.
"The chart renders correctly in the editor preview but fails to load or shows incorrect values in the actual live Pulse metric view," Suriya Prakash M explains. "That preview-vs-live mismatch is the dead giveaway. You think it's working, and it isn't."
The real risk isn't technical; it's trust. Pulse metrics go straight into leadership digests. A flat or wrong Tableau Pulse rolling average can sit in an executive's inbox for days before anyone questions it and once leadership catches one bad number, every number in the feed inherits the doubt.
The preview-vs-live mismatch checklist
Match your symptoms: the calculation uses WINDOW_AVG, WINDOW_SUM, or any table calc; the editor preview renders correctly; the live metric fails to load, flattens, or shows values that don't reconcile; the data source refreshes fine, and other metrics behave normally. If all four line up, you're not looking at a data problem; you're looking at an unsupported-calculation failure.
If this preview-vs-live mismatch looks familiar, you're not doing it wrong; Pulse simply wasn't built to compute this the way Desktop is. We've resolved this exact pattern on live Pulse deployments by moving the rolling logic into the data layer without letting metric sprawl take over. If you'd rather get it right the first time, talk to a Tableau Pulse expert.
Why the Advanced Analytics Editor Misleads You
Why does the editor show a calculation Pulse can't run?
"The Advanced Analytics Editor is essentially a preview environment," says Suriya Prakash M. "It shows you what your calculation looks like, but does not validate whether Pulse can actually execute it in production. The editor preview and the live metric view follow different rules, so always validate your metric in the live Pulse view before considering the setup complete."
In one line: the editor is a preview, not a validator. The practical rule for any Tableau Pulse rolling average is that setup isn't done when the preview looks right; it's done when the live view shows the right numbers to a real subscriber.
The Fix: Pre-Compute the Rolling Average Upstream of Pulse
If Pulse can't compute the rolling window, move the computation to a layer that can. It's an architecture decision, not a formula: pre-compute the Tableau Pulse rolling average in the data layer. You can shape it in Tableau Prep or build it into the datasource. So the smoothed value exists as an ordinary field. Then point the Pulse metric definition at that field. Pulse never calculates anything rolling; it simply surfaces a pre-materialised measure.
Where the calculation should live (and why not in Pulse)
Upstream, the rolling logic runs in a place that actually supports windowed calculations, such as a Prep flow or in the source query. The result lands in your data as a plain column. To Pulse, a pre-computed 28-day average looks no different from a simple daily measure, so everything downstream just works. In short, a working Tableau Pulse rolling average is not a calculation you switch on inside the product. It is a data-architecture decision you make before the metric ever reaches Pulse, and if you get it wrong, nobody notices until the wrong number is in front of leadership.
The Scaling Catch: One Pre-Computed Metric Per Slice
The catch grows teeth at enterprise scale. Because a Pulse metric definition is fixed at creation, every rolling-average slice you need, whether by region, product line, or channel, becomes its own pre-computed metric. Three smoothed metrics are easy. Thirty becomes a real governance problem: naming, ownership, refresh cadence, and drift multiply with every variant. The pattern scales cleanly only to a point, and knowing where that point sits is where design experience earns its keep.
Rolling metrics are one of the first places Tableau Pulse pushes teams into data-architecture decisions they didn't expect to make. NeenOpal's enterprise Tableau delivery team designs Pulse metric layers that stay accurate and governable as they scale. Request a Tableau Pulse architecture review, and we'll map the right approach for your metrics.
Frequently Asked Questions
1. Can you create a rolling average in Tableau Pulse?
Not natively, Pulse does not support table calculations, so WINDOW_AVG, WINDOW_SUM, and similar functions will fail in the live view even if the metric sets up fine. This is a platform restriction, not a version or permissions issue. The rolling logic must instead be pre-computed upstream in the data layer. Also note the rolling date-window filter is not a Tableau Pulse rolling average; it only changes how much history you see.
2. Why does my Pulse metric work in preview but break in the live view?
The Advanced Analytics Editor is a preview, not a validator. It doesn't verify that Pulse can execute your calculation in production, so unsupported logic passes preview but fails live. Always validate in the live Pulse view.
3. What's the difference between a Tableau Pulse rolling average and the rolling date filter?
The date filter (Last 7/30/90 days) is a display setting that changes how much history you see. A rolling average is a calculation that smooths the value itself. The filter never changes aggregation.
4. When should you use a rolling average instead of MTD or QTD?
Use a rolling window when a metric is volatile and drives frequent decisions — fixed periods reset and mislead early in the month or quarter. Keep MTD/QTD for stable, calendar-anchored reporting.
5. How do you build a Tableau Pulse rolling average the right way?
Pre-compute the moving average upstream in Tableau Prep or the datasource. So the smoothed value exists as a field; then point the Pulse metric definition at it. Plan governance early: each slice becomes its own pre-computed metric.

