×
×
Liquor Analytics Dashboards for Smarter Sales, Stocking & Compliance
Turning Liquor Retail Data into Demand, Not Just Reports
As competition in the alcohol retail sector intensifies, understanding demand is just as crucial as tracking sales. Liquor retail dashboards shift focus from inventory-only reporting to a marketing-led view, helping retailers gain real-time insights into shelf impact, brand visibility, and buying behavior.
Modern alcohol retail dashboards consolidate sales, promotions, customer data, and liquor inventory management information into a single, clear view. By connecting insights across categories, brands, and stores, these retail analytics dashboards reveal how timing, placement, and promotion influence conversions. Designed for clarity and action, a well-structured dashboard enables liquor retailers to identify which brands warrant shelf space, which promotions effectively change behavior, and how to optimize liquor store inventory management without losing momentum, while maintaining margins and staying compliant.
Key Benefits
- Translates liquor sales, customer behavior, and inventory signals into clear demand insights.
- Aligns stocking, pricing, and promotions with actual buying behavior, rather than legacy practices.
- Tracks store, category, and brand performance against intent, not just targets for deeper clarity.
- Surfaces early preference shifts across beer, wine, spirits, and premium segments with timely signals.
- Identifies revenue growth from a better mix and shelf visibility, not just volume to guide strategy.
- Enhances forecasting by linking demand patterns with promotions and seasonal trends.
- Enables faster decisions at the shelf, store, and portfolio levels with liquor retail dashboards.
- Highlights shrinkage and leakage as a lost opportunity, not just a loss for smarter controls.
- Eliminates manual reconciliation across POS, loyalty, payments, and inventory with unified data.
- Gives leadership a single, reliable view through liquor BI dashboards, focused on what to push next.
25%
Boost revenue with clearer SKU & basket insights.
15%
Cut costs with smarter, demand-aligned stocking
10%
Lift profits by protecting margins & reducing loss.
30%
Improve forecasts by aligning to buying trends
40%
Speed decisions with live performance signals
50%
Cut compliance effort with automated reporting
How NeenOpal Helps You
At NeenOpal, we help liquor retailers move from basic reporting to demand intelligence through a unified retail sales dashboard. Our analytics reflect real buying behavior through brand influence, shelf competition, promotions, and repeat purchases. By integrating POS, inventory, distributor, payment, and loyalty data, we reveal growth drivers, high-impact promotions, SKU momentum, and hidden compliance risks without adding operational complexity.

Data Integration Services
- Integrate sales, inventory, distributor, and customer data from POS, ERP, CRM, payments, and loyalty systems.
- Automate data collection and reporting to reduce manual errors and improve real-time visibility.
- Build scalable data pipelines to support multi-location growth and advanced liquor retail analytics.
01

Customizable Dashboard Solutions
- Design liquor analytics dashboards aligned with sales, customer, inventory, procurement, and compliance goals.
- Utilize automated data validation and interactive visuals to minimize errors and identify trends.
- Set KPI alerts for stockouts, age-verification failures, shrinkage, and demand shifts.
- Apply predictive analytics to forecast demand, optimize procurement, promotions, and category mix.
- Ensure secure data handling and accurate regulatory reporting for full compliance.
02

User Training and Support
- Ensure long-term liquor analytics dashboard adoption and ROI with guided onboarding and continuous support.
- Offer interactive training sessions to enhance user efficiency and enable teams to interpret liquor-specific insights effectively.
- Provide documentation, training, and support for troubleshooting, enhancements, and scaling your liquor analytics ecosystem.
03
Explore Our Dashboards
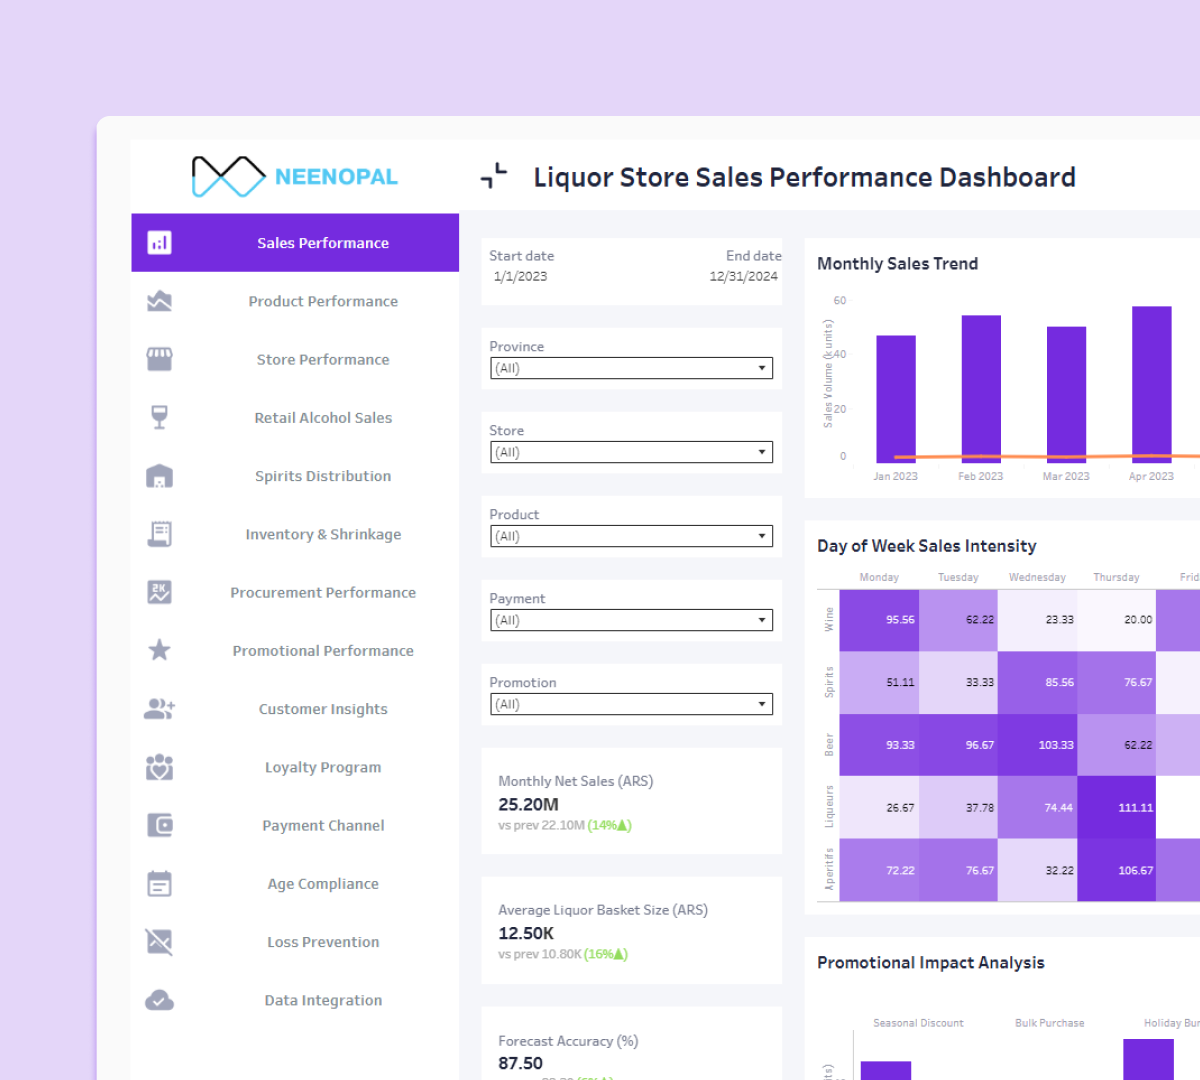
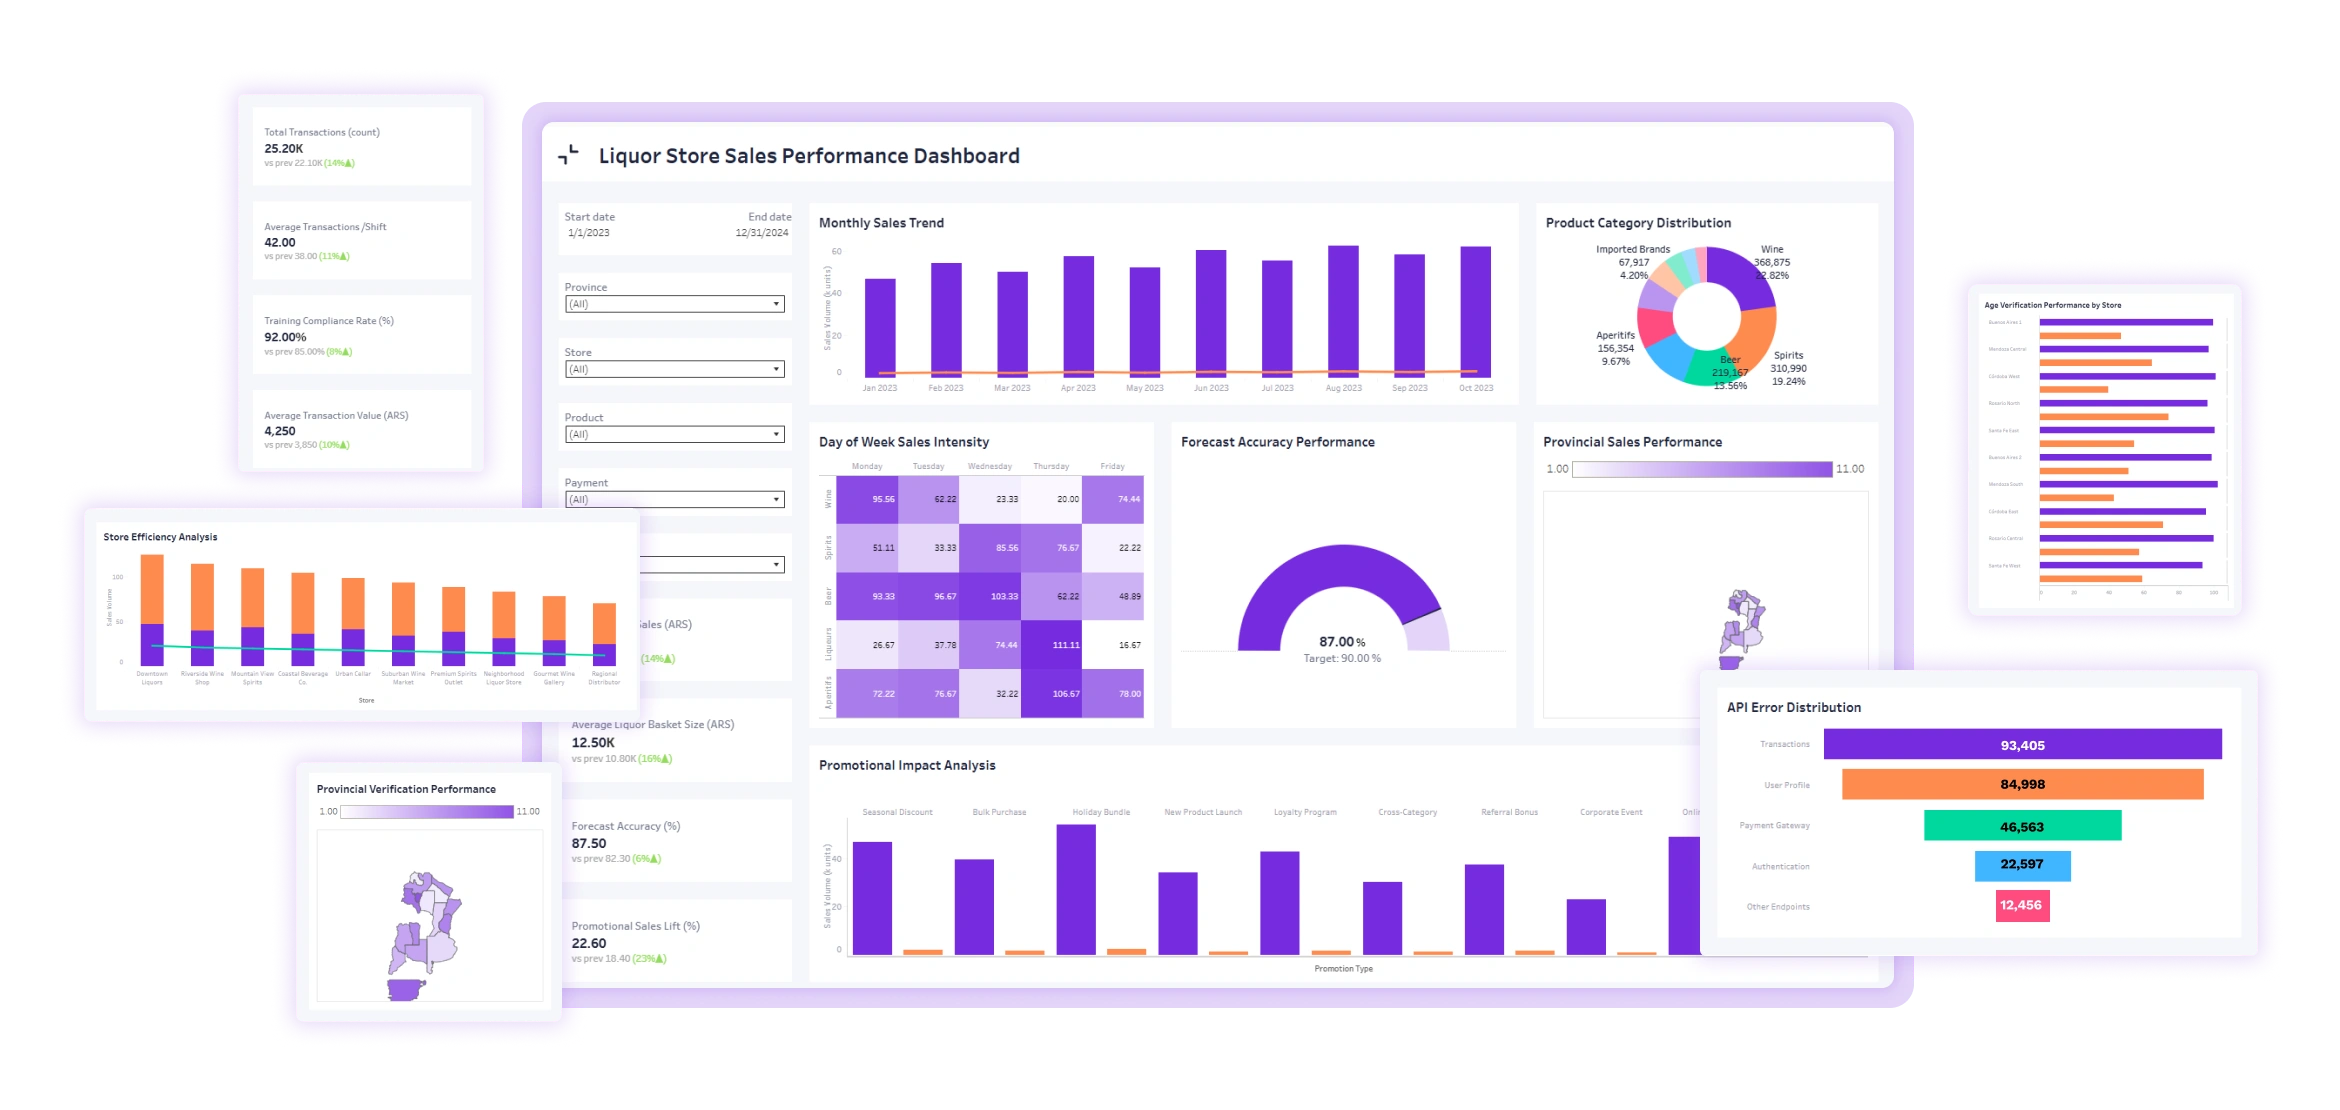
Liquor Store Sales Performance Dashboard
A Liquor Store Sales Performance Dashboard provides a comprehensive view of store-wide alcohol sales, highlighting category trends across Beer, Wine, and Spirits while showing hourly, daily, and seasonal consumption patterns.
1. Provides a clear overview of total sales and category contributions, enabling a deeper understanding of store performance and revenue drivers.
2. Tracks changes in sales volume and product mix over time, helping identify peak hours, seasonal demand shifts, and emerging customer preferences.
3. Enables comparison across categories and SKUs to support data-driven decisions for merchandising, stocking, and pricing.
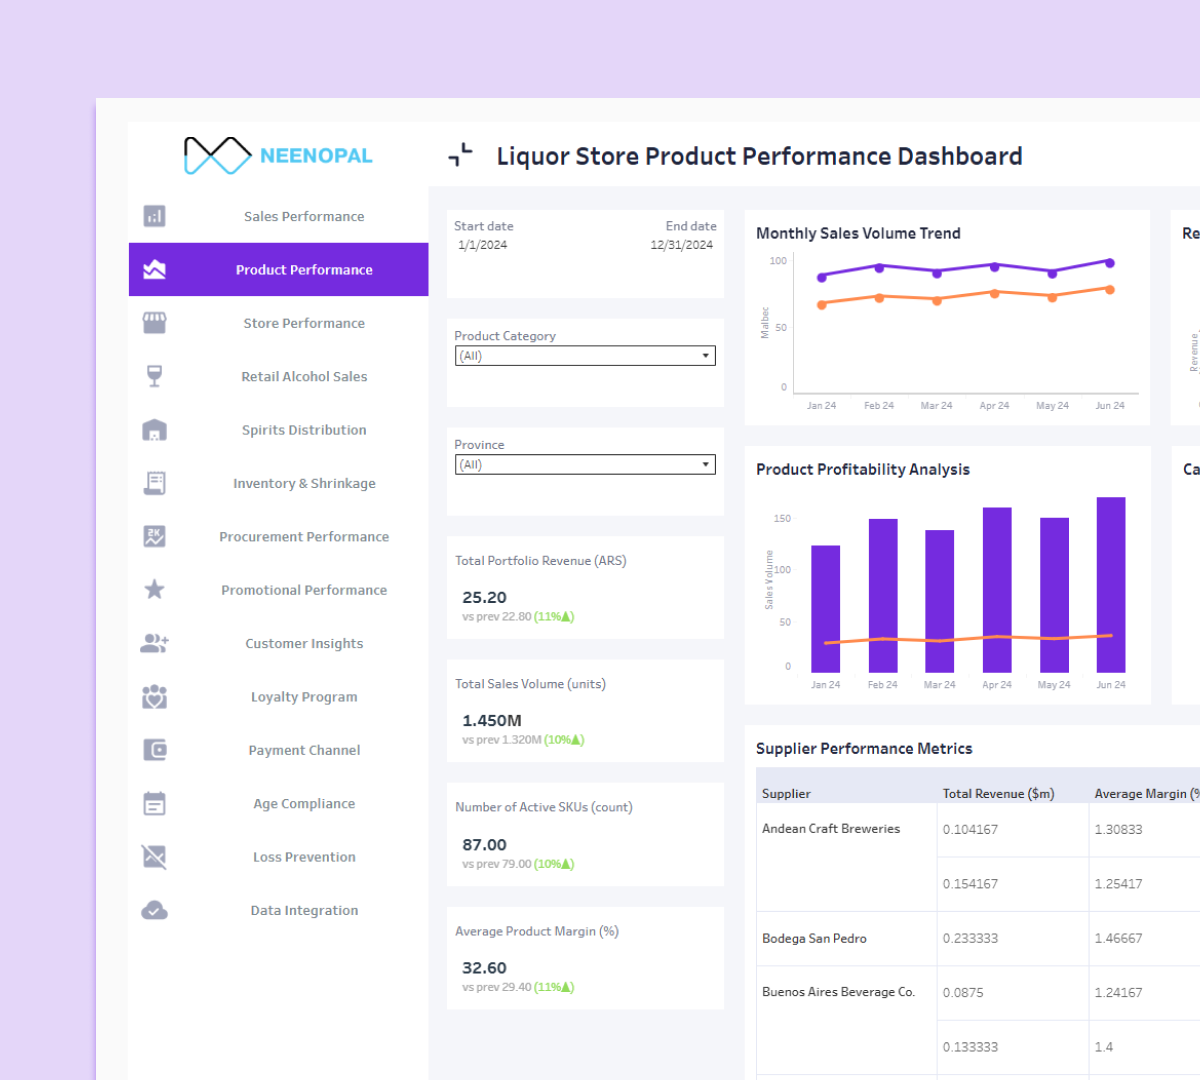
Product Performance Dashboard
A Product Performance Dashboard showcases how individual alcohol SKUs perform across revenue, velocity, and profitability, offering insight into the effectiveness of assortment and shelf placement.
1. Highlights top-performing and slow-moving products to optimize shelf space and inventory investment for better efficiency.
2. Tracks SKU-level trends over time to identify demand patterns and predict category growth or decline with greater accuracy.
3. Enables comparison across product lines and brands, supporting informed purchasing, effective promotions, and optimized vendor negotiations.
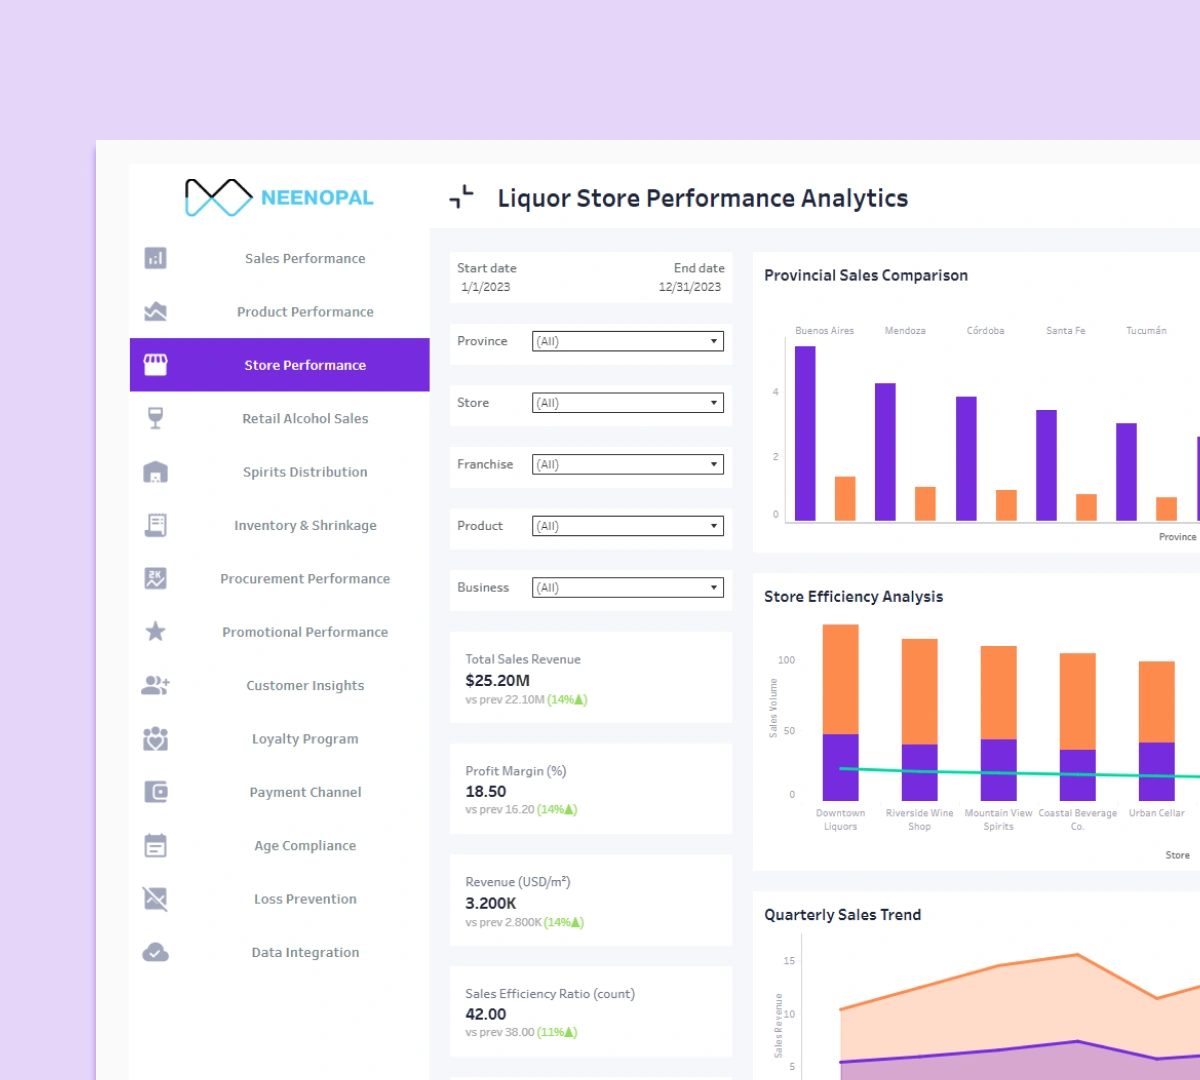
Liquor Store Performance Analytics Dashboard
A liquor store inventory management dashboard reveals how effectively a store converts footfall into sales, showing traffic patterns, conversion rates, and customer behavior metrics.
1. Provides an overview of store efficiency by analyzing visitor behavior, conversion rates, and purchasing patterns.
2. Tracks performance shifts across hours, days, and seasons to identify opportunities for staffing, layout, and operational improvements.
3. Compares store-level KPIs, helping owners enhance customer experience and boost sales performance.
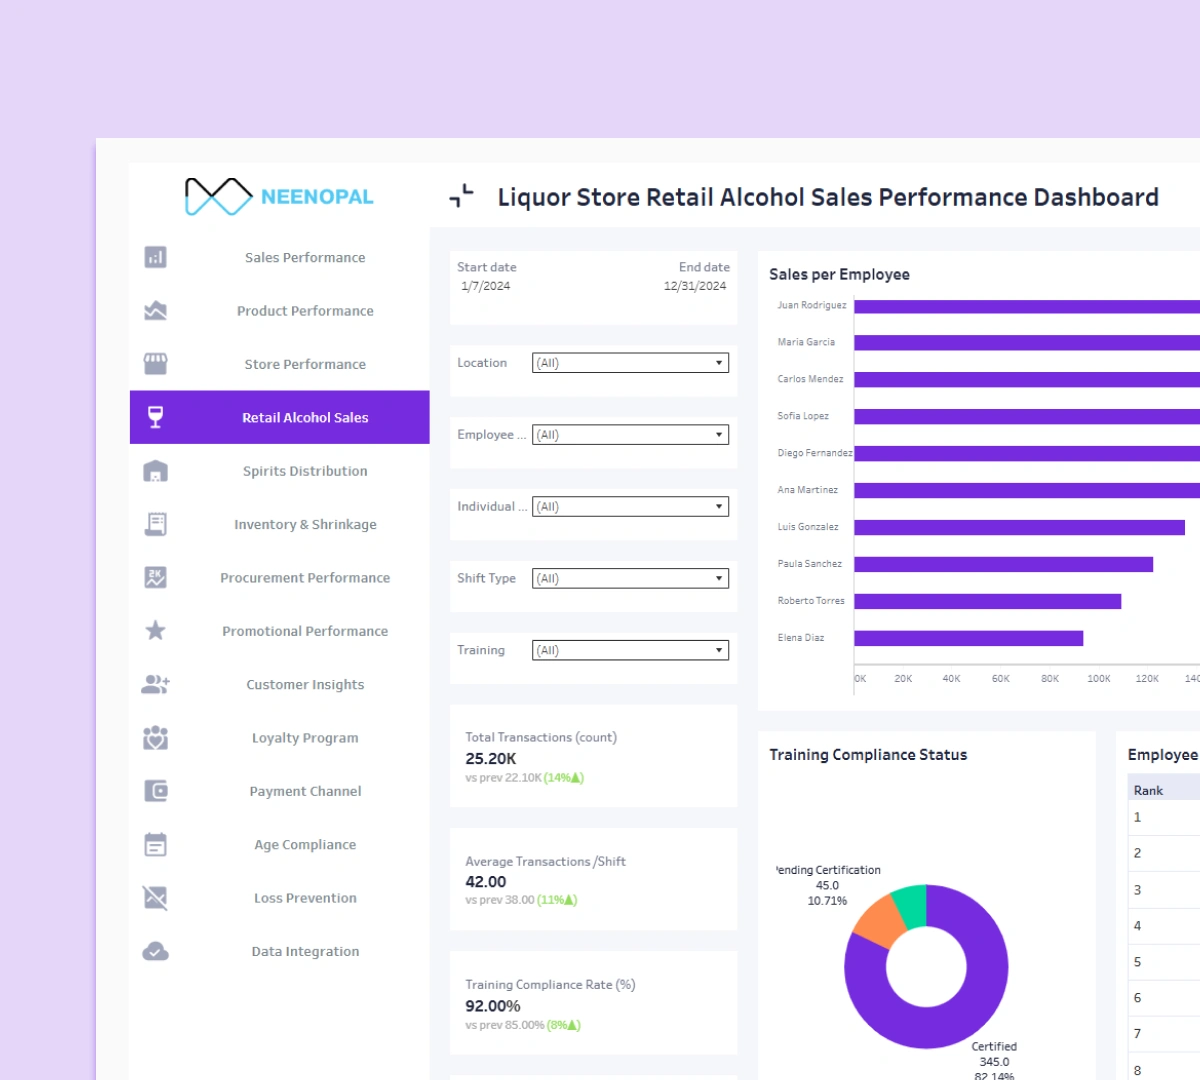
Retail Alcohol Sales Performance Dashboard
A Retail Alcohol Sales Performance Dashboard compares alcohol sales across locations and channels, including in-store, delivery, and digital platforms.
1. Offers a consolidated view of multi-store or multi-channel performance to evaluate growth opportunities with deeper clarity.
2. Tracks changes across regions and sales channels to understand what drives higher volumes and customer engagement.
3. Enables comparison between locations and categories to support informed expansion, pricing, and promotional strategies.
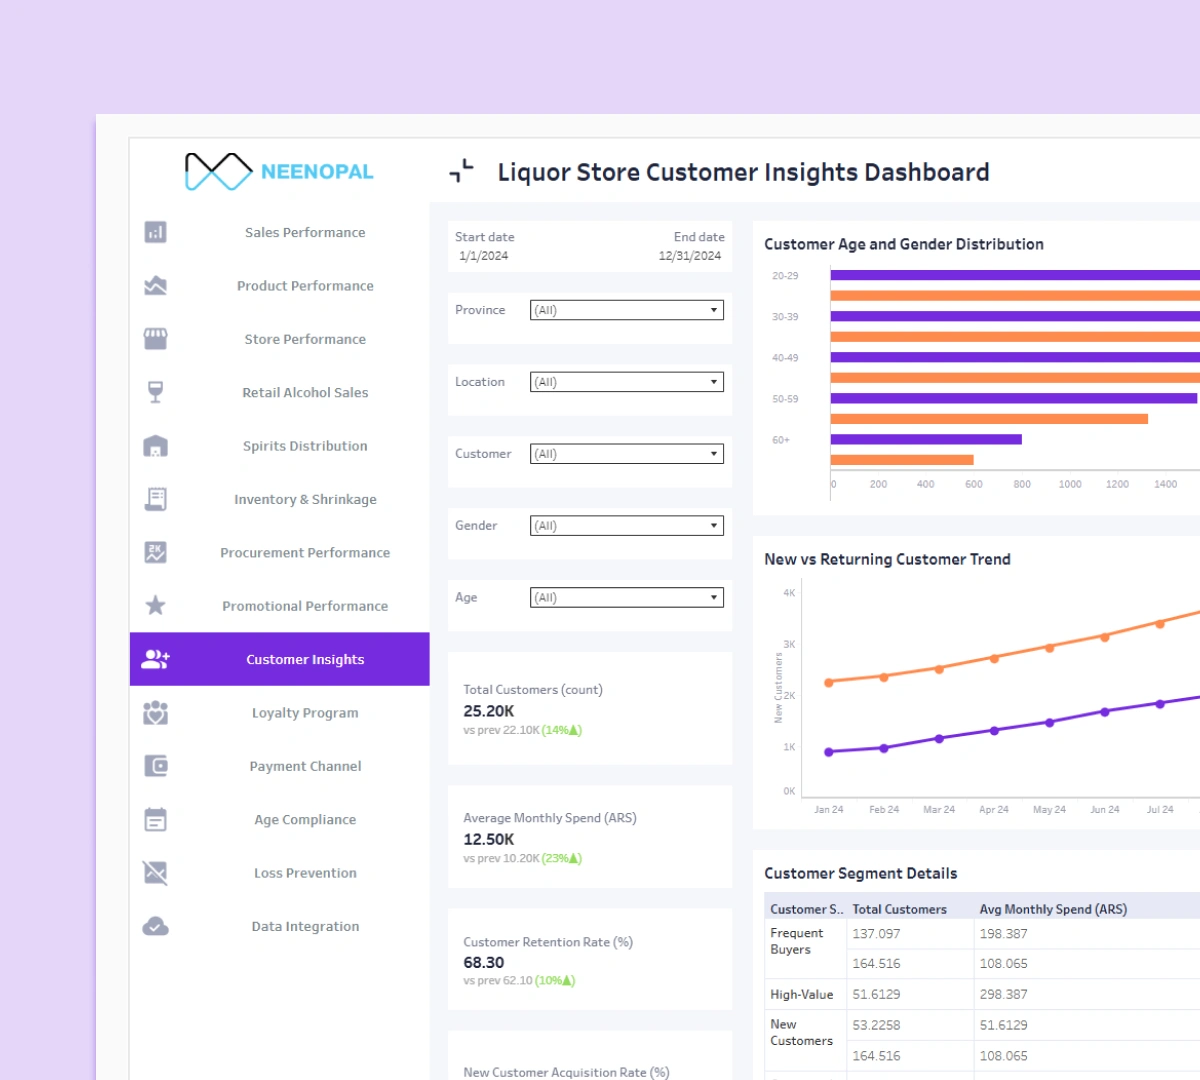
Customer Insights Dashboard
A Customer Insights Dashboard analyzes customer demographics, buying behavior, and category preferences to help liquor stores personalize experiences and optimize assortment.
1. Provides a clear overview of customer segments and their alcohol purchasing habits for targeted engagement.
2. Tracks trends in purchase frequency, category interests, and basket combinations to reveal evolving consumer behavior.
3. Compares customer groups and buying patterns to support loyalty efforts, product placement, and marketing strategies.
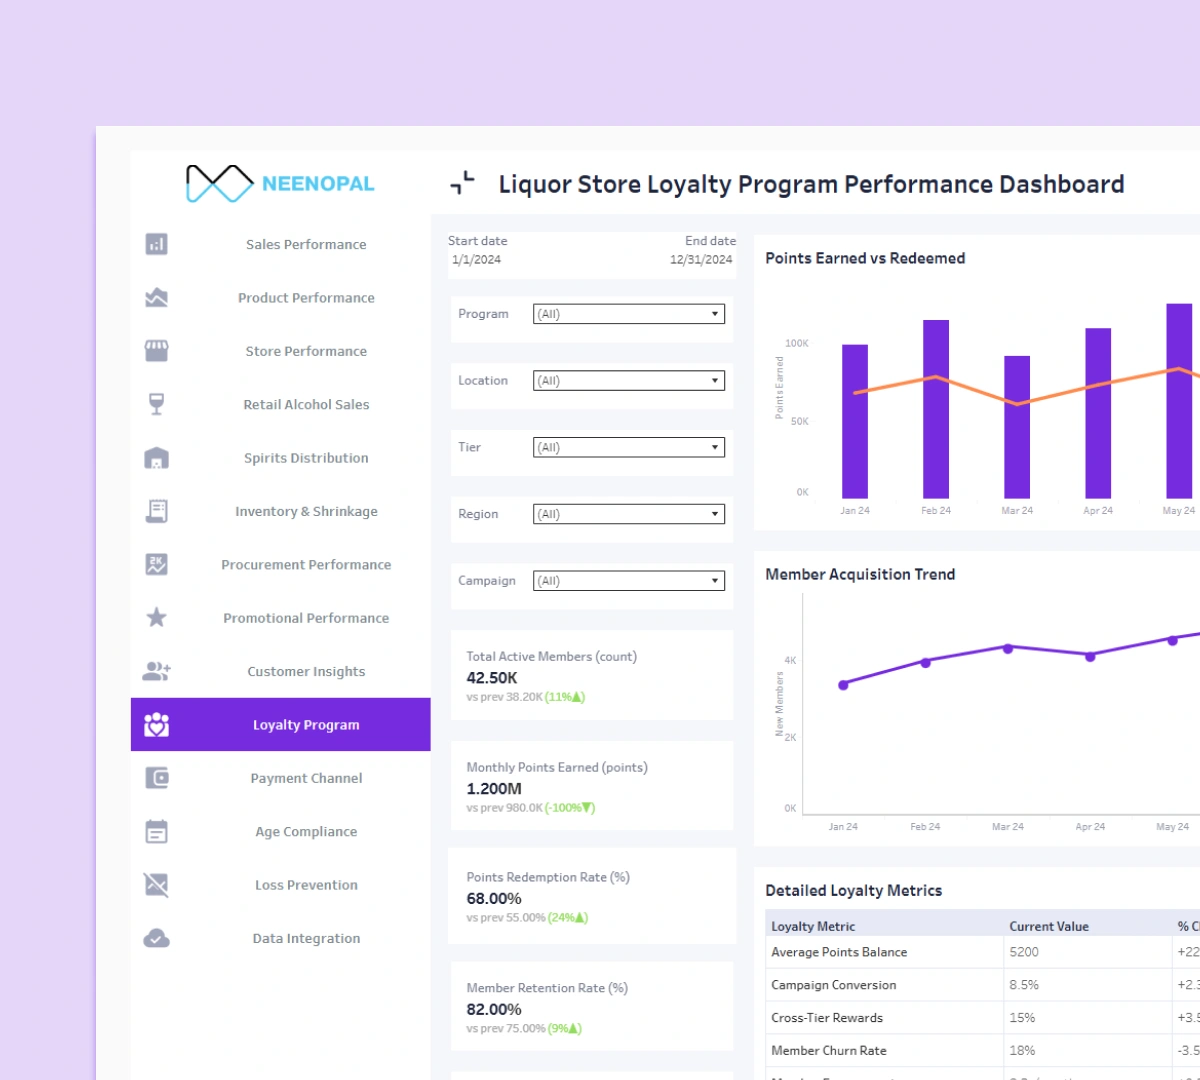
Loyalty Program Performance Dashboard
A Liquor Store Loyalty Program Performance Dashboard highlights how loyalty initiatives impact repeat purchases and customer retention.
1. Tracks changes in loyalty-driven sales and customer engagement over time to measure program effectiveness.
2. Monitors payment patterns over time to improve financial planning and predict cash flow
requirements.
3. Compares performance across customer tiers, helping refine reward structures and improve customer LTV.
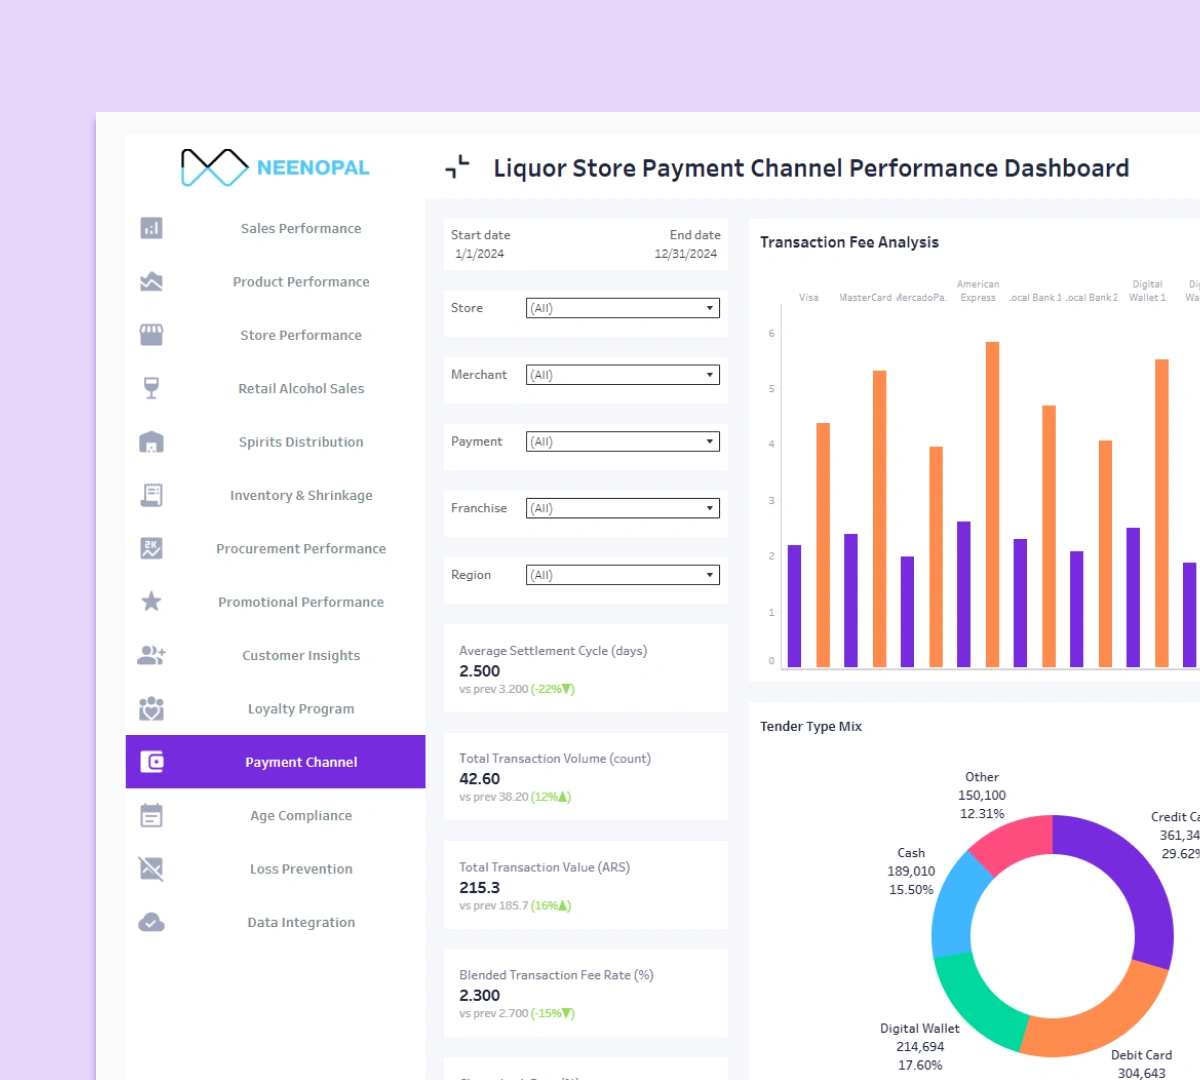
Payment Channel Performance Dashboard
A Payment Channel Performance Dashboard shows how customers pay, whether via cash, card, UPI, or wallets while identifying transaction issues and patterns.
1. Gives an overview of payment mode distribution to evaluate customer convenience and transactional efficiency.
2. Tracks success and failure rates to identify issues in billing, reconciliation, or payment infrastructure.
3. Compares payment behavior across days and categories to improve checkout operations and customer satisfaction.
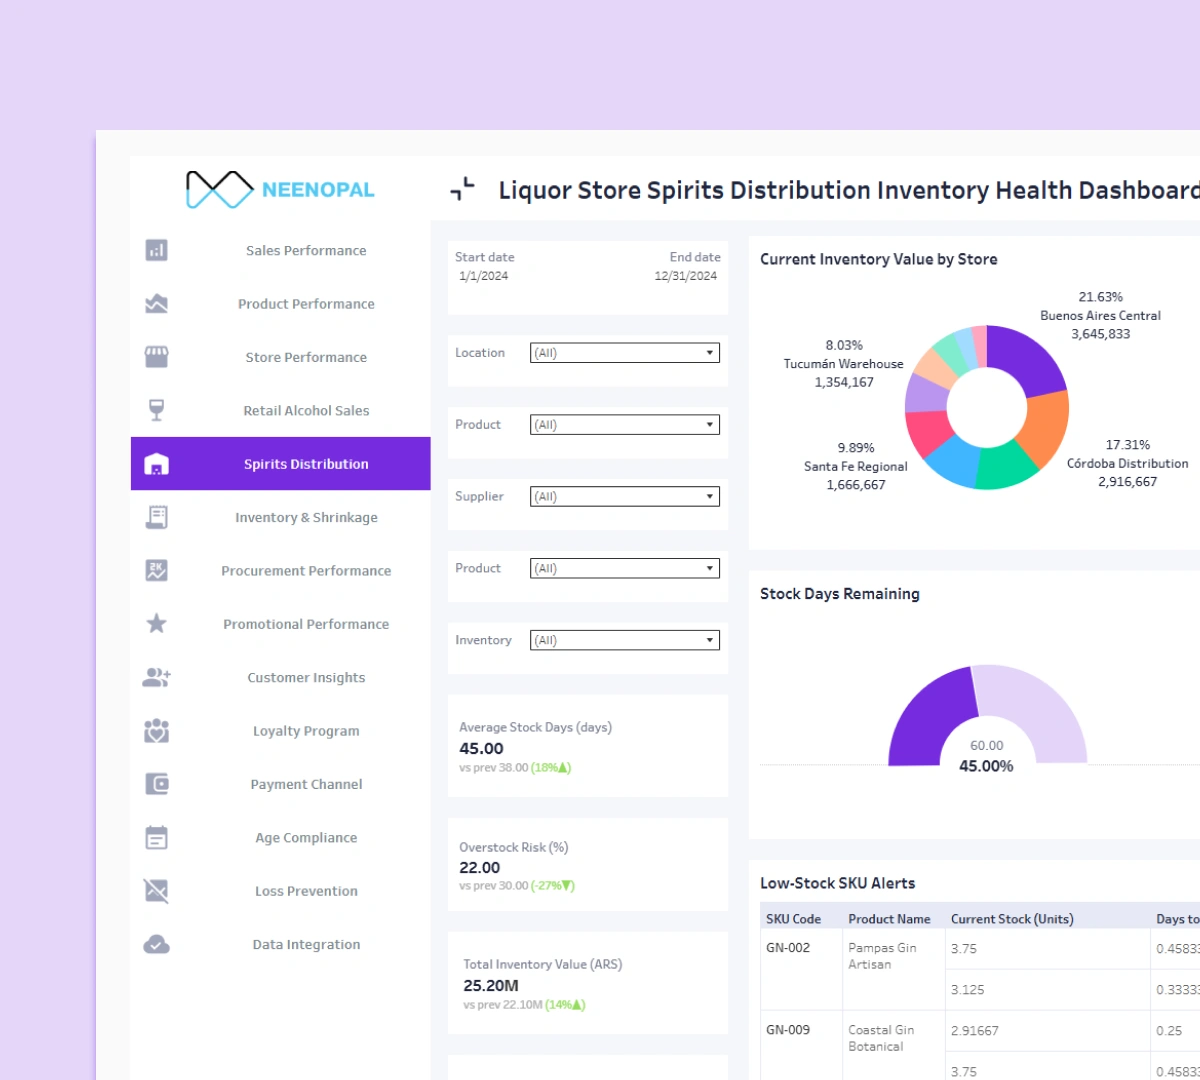
Inventory Health Dashboard
A Spirits Distribution Inventory Health Dashboard provides a real-time view of stock levels, replenishment needs, and aging across distribution and retail nodes.
1. Offers visibility into on-hand stock, safety thresholds, and replenishment cycles to prevent stockouts.
2. Tracks changes in inventory turnover and holding costs to identify slow movers and storage inefficiencies.
3. Compares category-level stock health to support smarter purchasing and warehouse planning for improved efficiency.
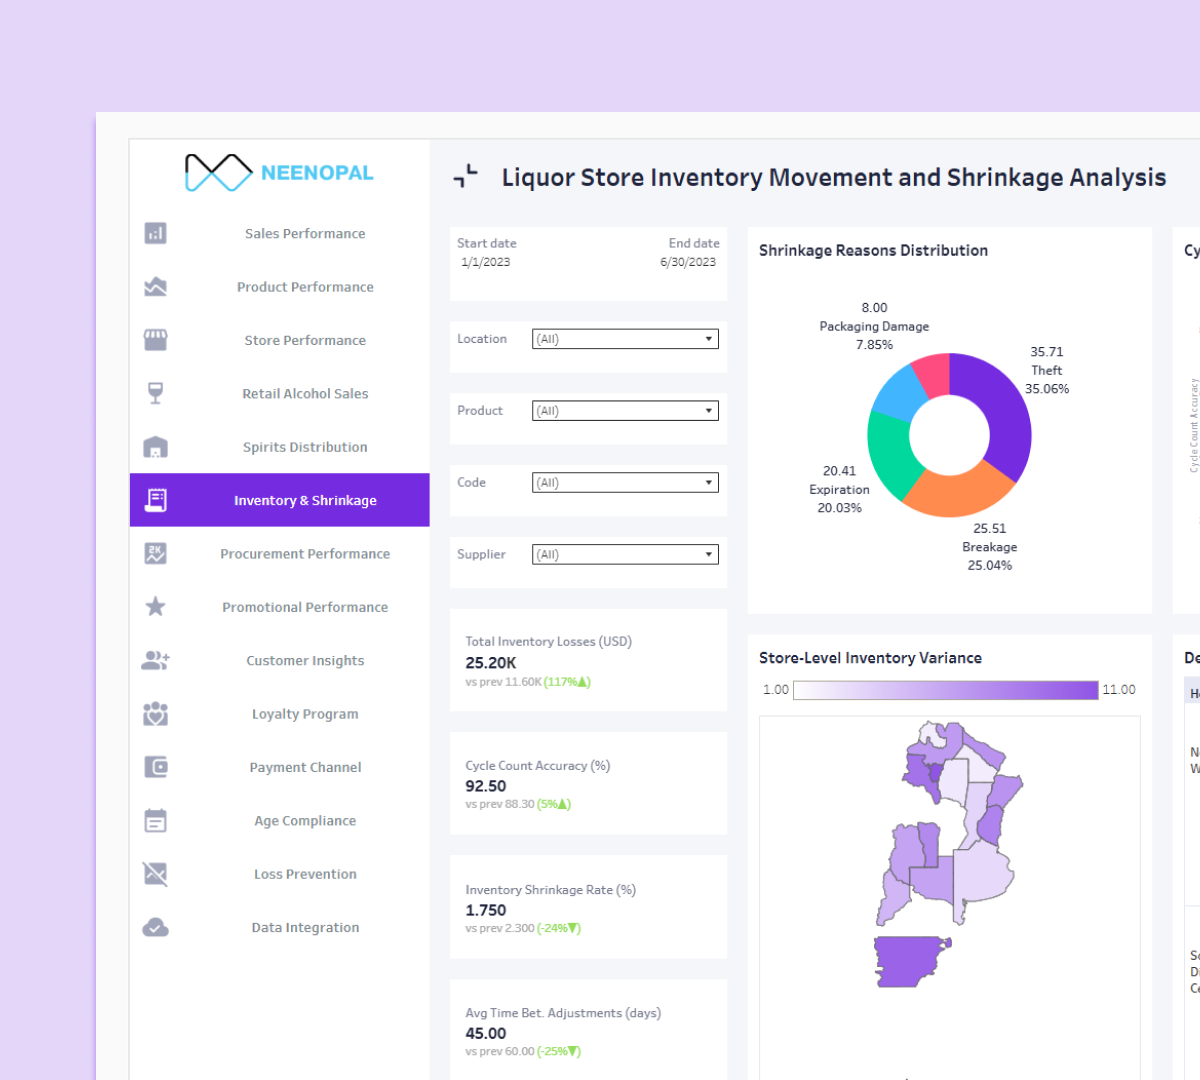
Inventory Movement & Shrinkage Dashboard
An Inventory Movement and Shrinkage Dashboard tracks stock movement from warehouse to shelf, identifying patterns of theft, breakage, or loss.
1. Provides clarity on stock reduction sources shrinkage, breakage, or miscounts to protect margins.
2. Tracks changes in order fill rates and price fluctuations to inform negotiation and sourcing strategy.
3. Compares shrinkage rates across categories, stores, or periods to strengthen loss-prevention strategies.
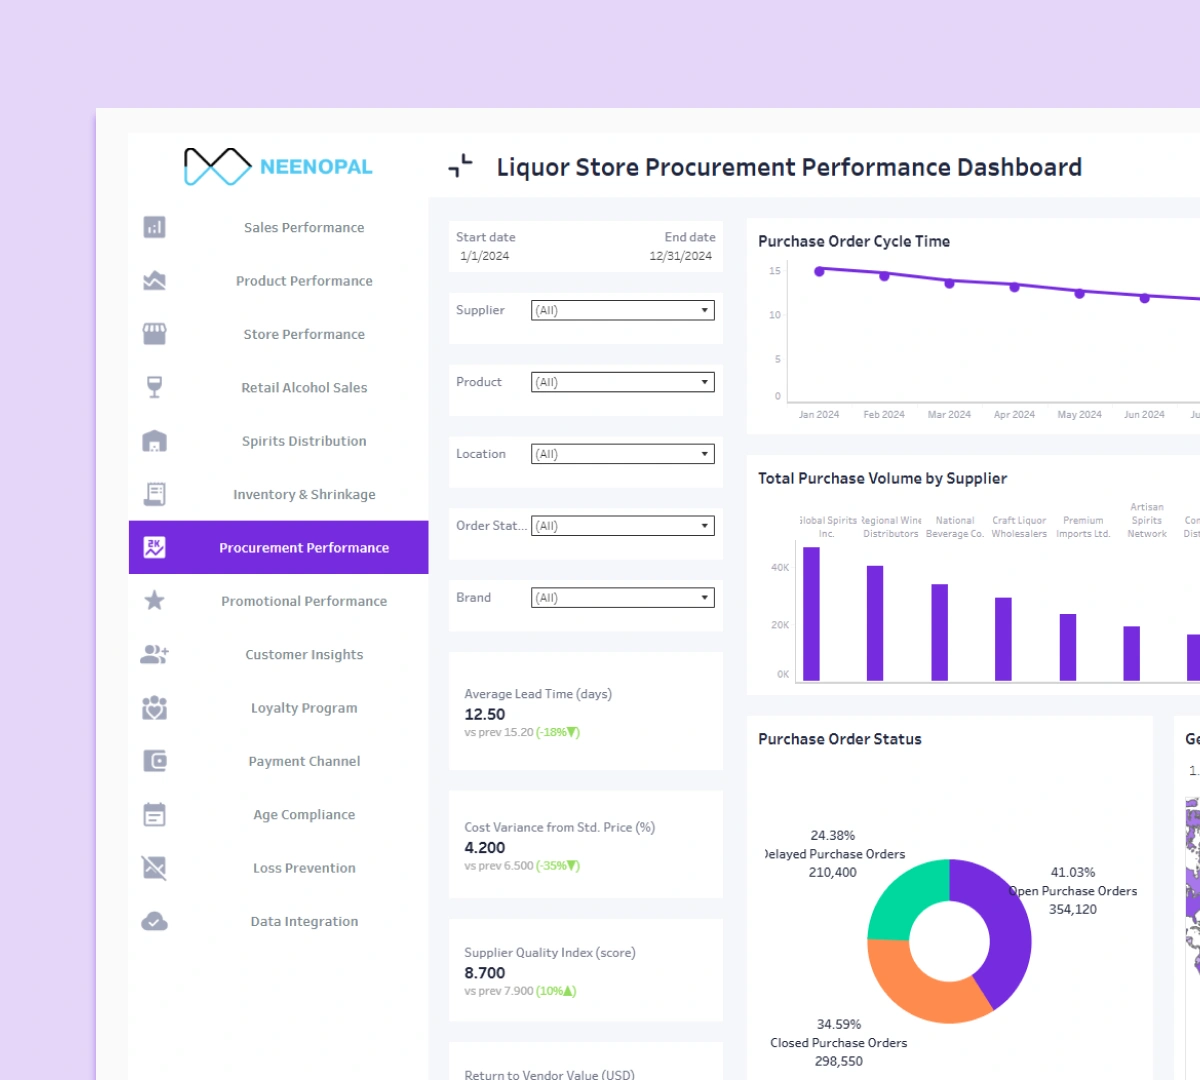
Procurement Performance Dashboard
A Liquor Procurement Performance Dashboard evaluates supplier reliability, pricing consistency, and order fulfillment to optimize purchasing.
1. Gives a consolidated view of supplier performance, cost trends, and procurement timelines for stronger decision-making.
2. Tracks changes in order fill rates and price fluctuations to inform negotiation and sourcing strategy.
3. Compares supplier metrics across product categories to ensure consistent availability and margin stability.
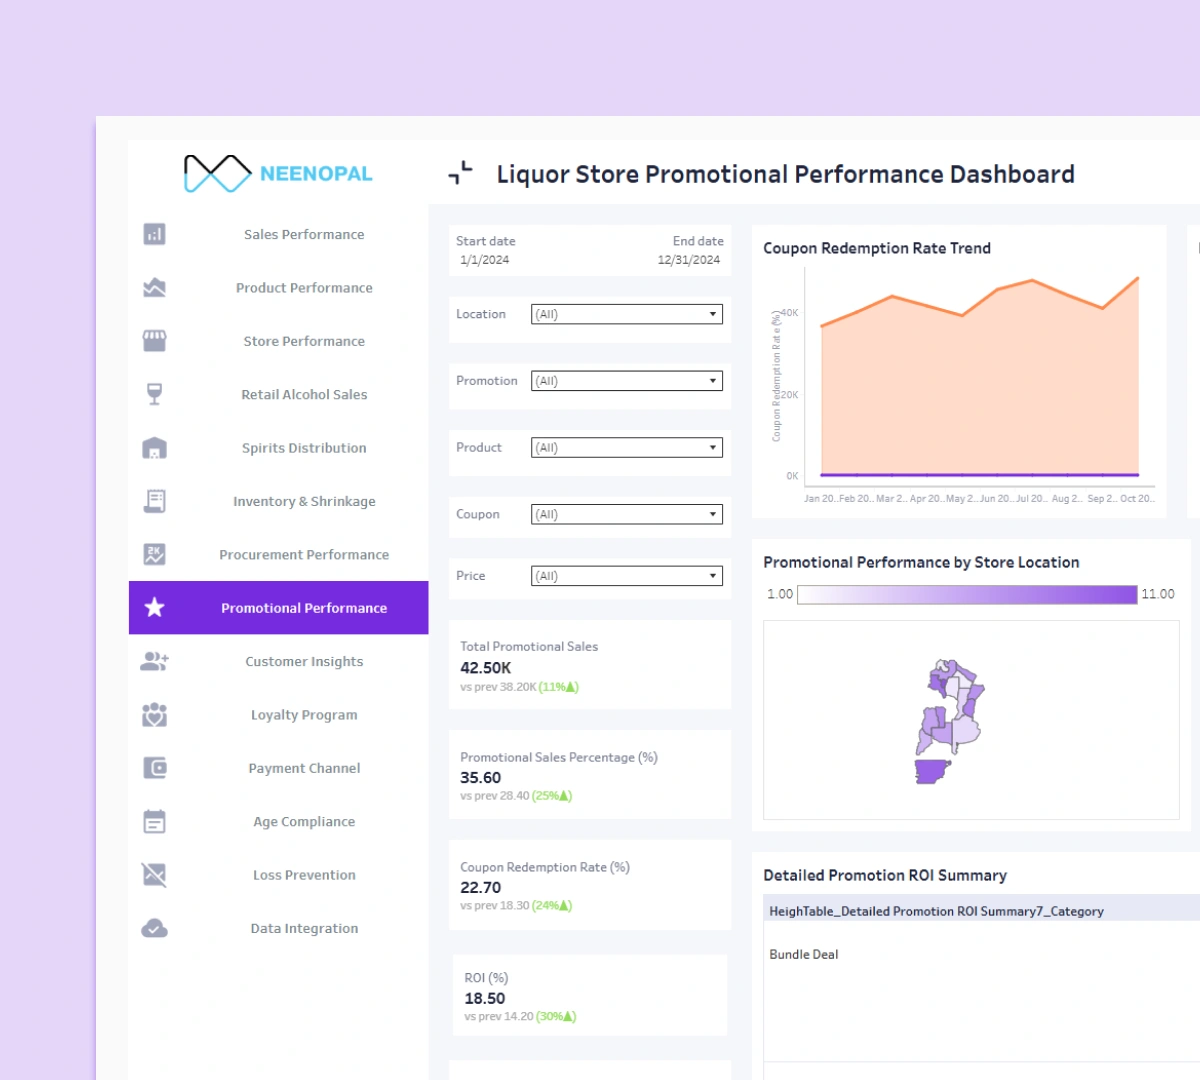
Promotional Performance Dashboard
A Liquor Sales Promotional Performance Dashboard measures the effectiveness of discounts, deals, and seasonal promotions.
1. Provides clarity on how promotions impact sales lift, category mix, and customer behavior with actionable insights.
2. Tracks promotional impact over time, revealing which campaigns deliver ROI and which do not with deeper precision.
3. Compares different promotional types and periods to refine future marketing investments for better outcomes.
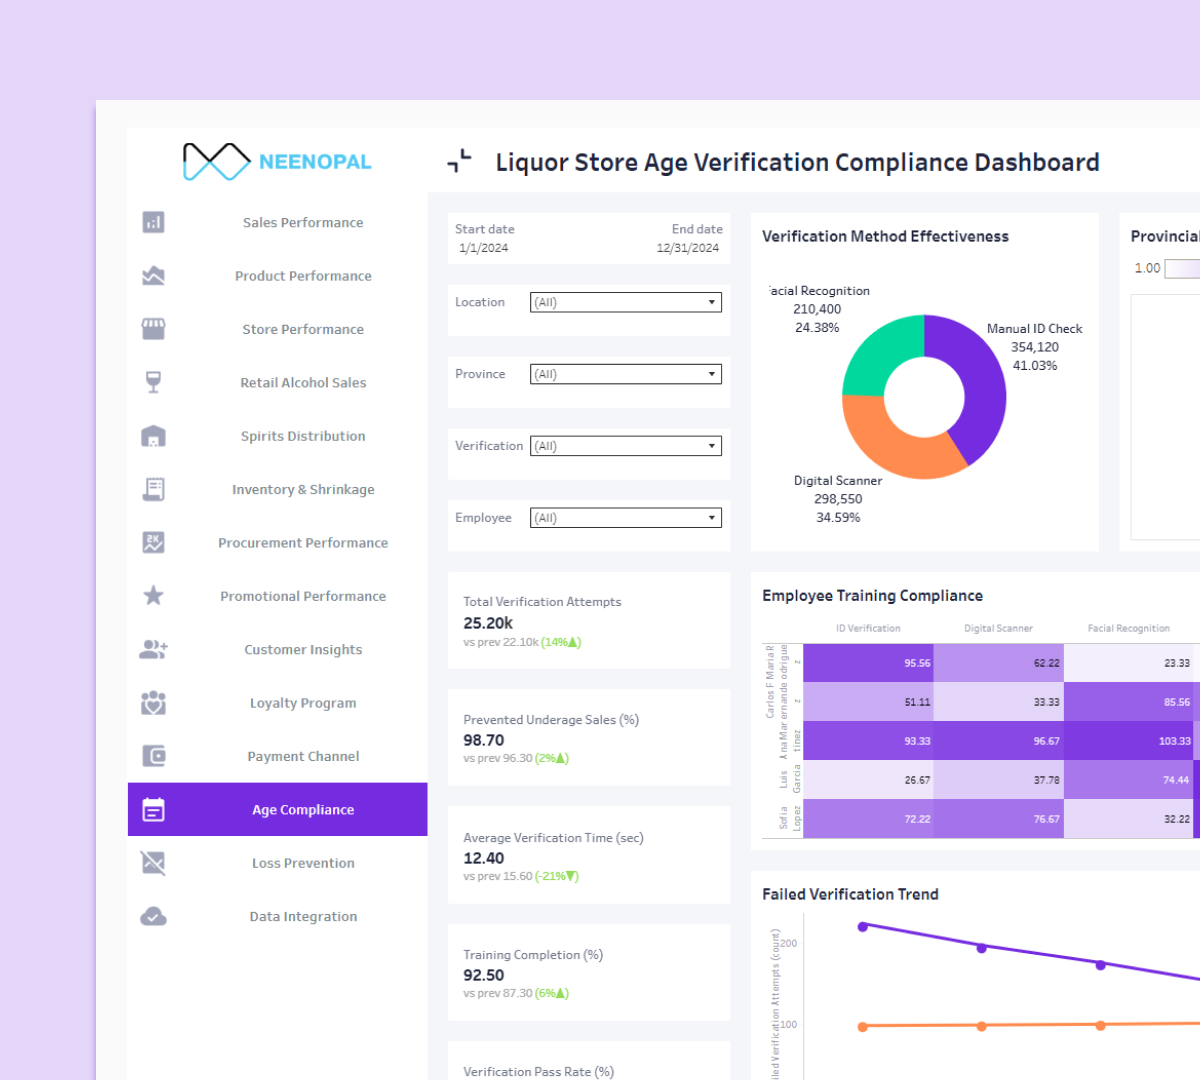
Age Verification Compliance Dashboard
An Age Verification Compliance Dashboard ensures that alcohol sales comply with regional legal requirements by tracking ID checks and validating accuracy.
1. Provides a clear overview of ID verification compliance to minimize legal and regulatory risks and enhance operational accountability.
2. Tracks failed or missed verifications over time to identify training needs and risk areas while improving overall compliance consistency.
3. Compares compliance across stores, staff members, and shifts for targeted corrective action and more substantial organization-wide process alignment.
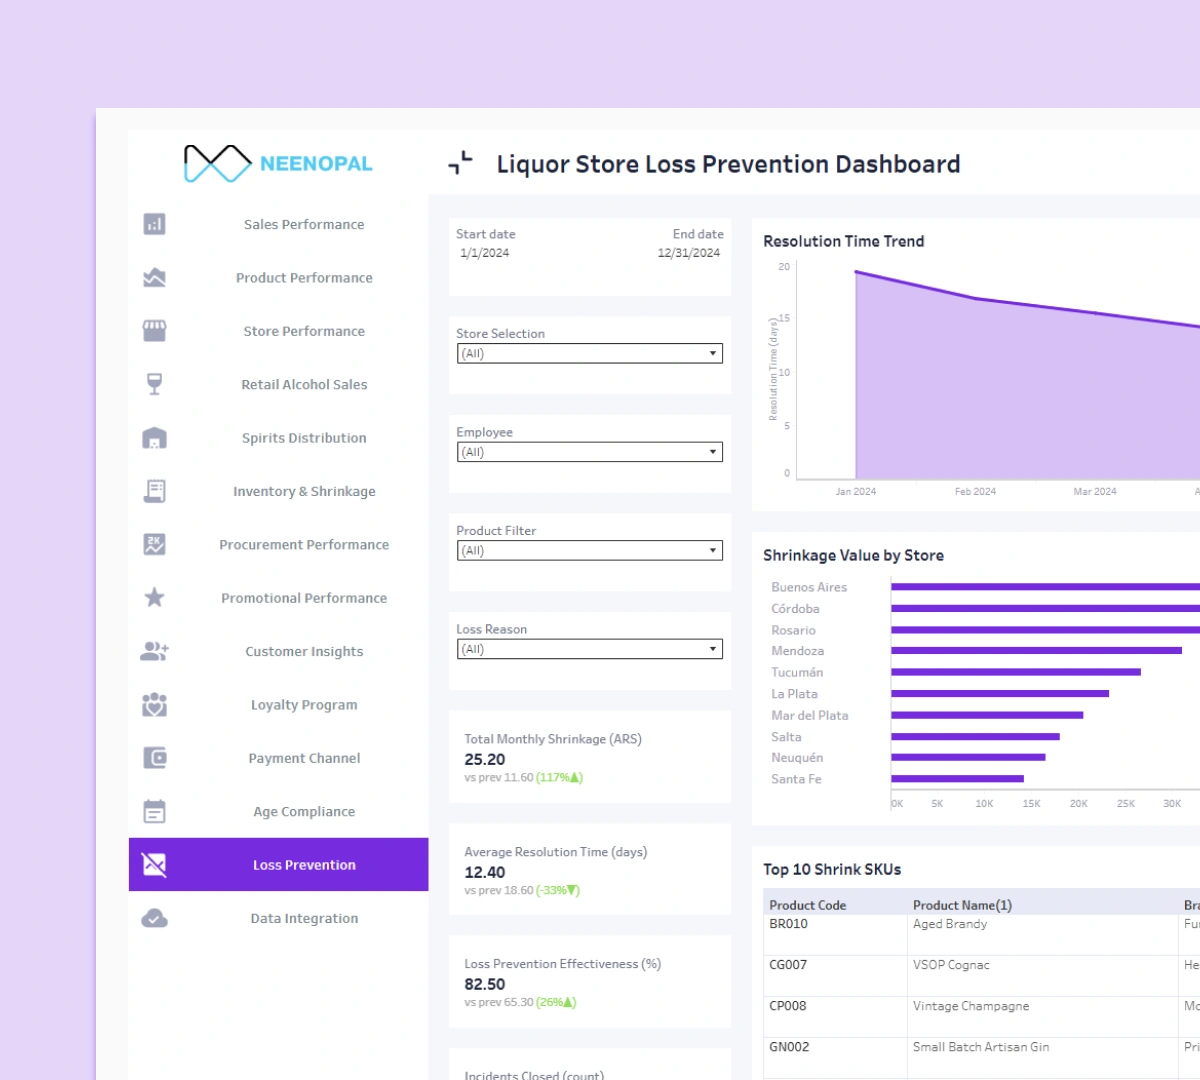
Loss Prevention Dashboard
A Loss Prevention Dashboard highlights theft incidents, suspicious transactions, and high-risk SKUs that impact the profitability of liquor stores.
1. Provides visibility into theft patterns and vulnerabilities across product categories, guiding proactive monitoring and loss prevention.
2. Tracks loss events and shrinkage trends to identify operational and security gaps and enable data-backed mitigation strategies.
3. Compares risk levels across stores and products to strengthen preventive controls and support long-term inventory protection measures.
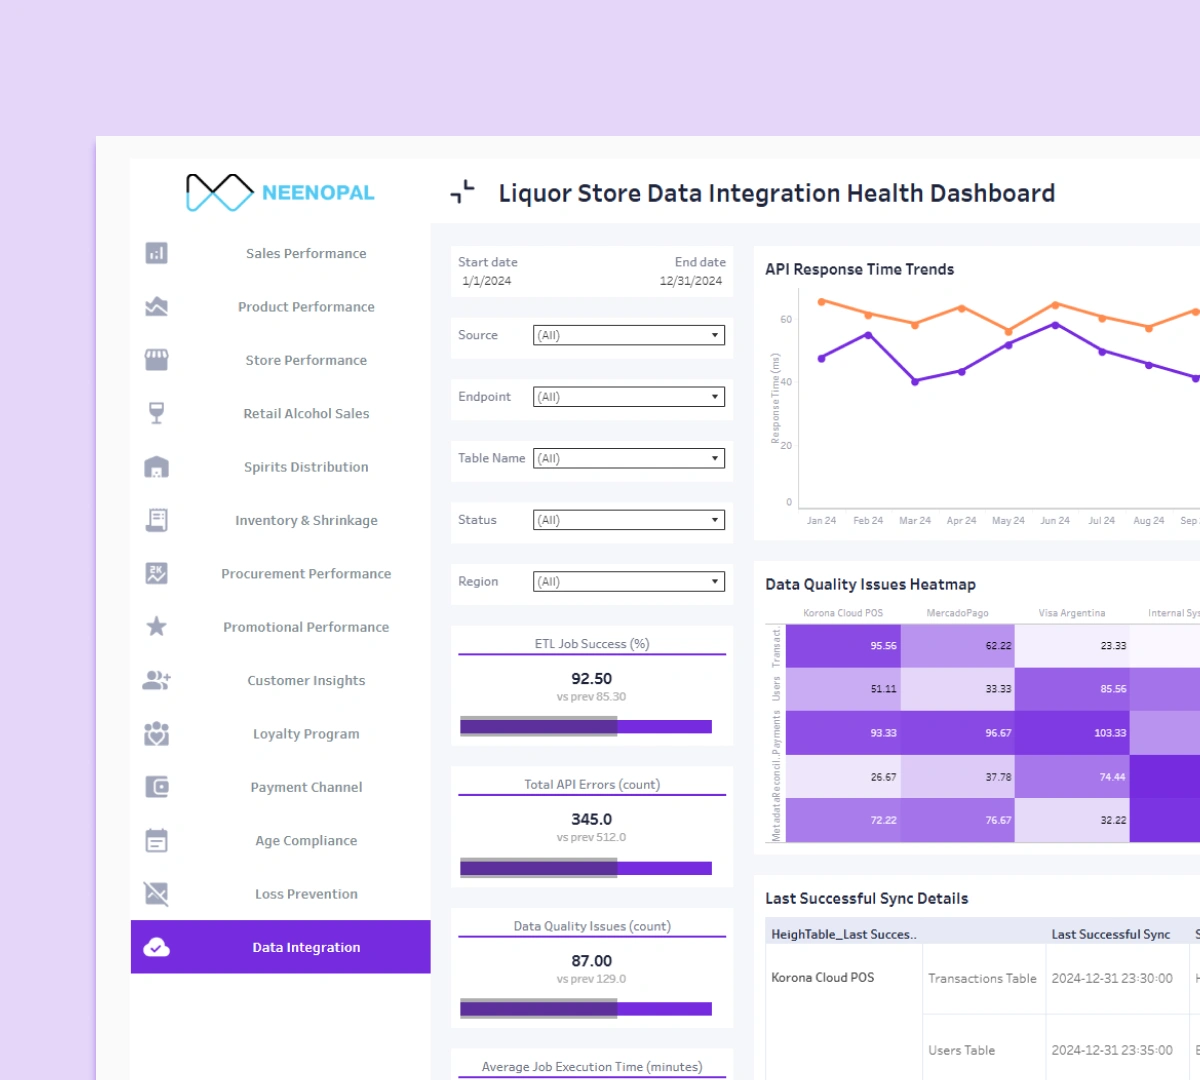
Data Integration Health Dashboard
A Data Integration Health Dashboard ensures all POS, payment, eCommerce, and ERP systems sync seamlessly for accurate reporting.
1. Gives an overview of data refresh cycles, pipeline delays, and integration errors to maintain system transparency and trustworthiness.
2. Tracks changes in data health over time to improve reliability and reporting accuracy across all business functions.
3. Compares system performance across sources to ensure end-to-end BI stability and deliver seamless analytics availability.
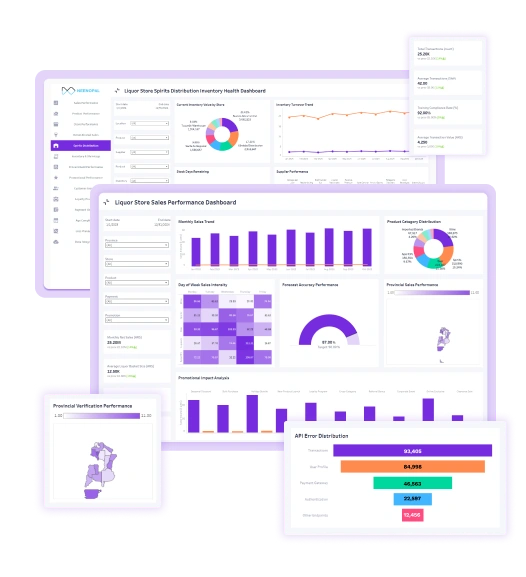
Dashboard Preview
This demo showcases the most essential liquor retail dashboards, including Sales Performance, Inventory Health, Customer Insights, and Compliance Monitoring, each enriched with real-time KPIs, category trends, and actionable store-level intelligence. Explore how our liquor analytics dashboards provide a clear, intuitive view of alcohol retail operations and help you optimize sales, reduce shrinkage, improve stocking decisions, and elevate overall business performance.

Download the Complete List of Must-Have Liquor Retail Dashboards
Services Used
We use modern ETL tools, data warehouses, data visualization tools, and cloud platforms to offer seamless, data-driven solutions. These services provide efficient data processing, storage, and analytical reporting for informed decision-making. To learn more or discuss how we can enhance your data strategy.
ETL Tools

Azure Data Factory

AWS Glue

DBT
Data Warehouses

Azure Synapse Analytics

Amazon Redshift

Snowflake
Data Visualization Tools

Power BI

Tableau

Looker

Grafana
Cloud Platform

Azure

AWS

Google Cloud
Solutions Offered
We provide specialized dashboards and analytics for the liquor industry, enabling detailed insights into sales, inventory, distribution, and financial performance. Our solutions help businesses optimize operations, maximize revenue, and make data-driven decisions. Explore how we can transform your liquor business analytics.
Sales & Revenue Intelligence

Sales Overview
Provides a clear view of total sales, revenue trends, and product-wise performance, helping identify high-performing SKUs and optimize sales strategies.

Channel Performance
Monitors sales across different channels retail, online, and wholesale to support strategic distribution and marketing decisions.

Campaign Impact
Tracks the effectiveness of promotional campaigns and discount strategies, helping maximize ROI and customer engagement.
Operations & Supply Chain Management

Stock Overview
Shows inventory levels, turnover rates, and stock-outs to support effective supply chain management and reduce lost sales significantly.

Logistics & Deliveries
Analyzes distribution performance, including delivery timelines, route efficiency, and warehouse utilization, ensuring smooth operations.

Industry Specific Insights
We provide insights aligned with key liquor industry performance indicators, helping businesses optimize sales, distribution, and profitability.
Strategic Insights

Comprehensive Analytics
Provides deep-dive analysis across sales, inventory, and finance, supporting strategic planning and broader operational optimization.

Performance Indicators
Displays critical KPIs, including sales growth, margin per SKU, inventory turnover, and channel efficiency, providing actionable insights at a glance.

Actionable Intelligence
Specialized metrics empower liquor businesses to drive growth, manage operations efficiently, and gain a competitive advantage.
A Path to BI Success
A Business Intelligence (BI) roadmap is a plan that guides how to set up and use data analytics tools and processes to gain valuable insights and make informed decisions. It helps organizations build a clear path for integrating data solutions that support long-term growth and success. By aligning technology with business goals, it fosters efficient data management and drives continuous improvement. Learn more.