×
×
Title Insurance Analytics Dashboards for Risk, Revenue & Compliance
Turning Title Insurance Data into Confident Decisions, Not Just Policies
As regulatory scrutiny increases and transaction volumes fluctuate, understanding risk is just as critical as issuing policies. Title insurance dashboards shift the focus from siloed, policy-level reporting to a decision-first view, enabling insurers to gain real-time visibility into risk exposure, claims trends, and compliance health across the entire transaction lifecycle.
Modern title insurance analytics dashboards consolidate escrow, underwriting, claims, accounting, and compliance data into a single, trusted view. By connecting insights across regions, agents, property types, and transaction stages, these title insurance BI dashboards reveal where delays originate, how underwriter performance varies, and where risk indicators may surface. Designed for clarity and action, a robust title insurance business intelligence framework enables firms to reduce risk, accelerate closings, enhance margins, and maintain audit readiness at all times.
Key Benefits
- Translates title policies, claims, and underwriting activity into clear, actionable risk intelligence.
- Aligns underwriting decisions, pricing strategies, and operational capacity with real transaction behavior.
- Tracks agent, office, and underwriter performance against risk and efficiency, not just volume metrics.
- Surfaces early indicators of claims risk across property types and geographies with timely signals.
- Identifies margin improvement opportunities through cycle-time, rework, and cost analysis.
- Enhances forecasting by linking transaction pipelines with seasonal patterns and market trends.
- Enables faster decisions across underwriting, escrow, and compliance teams with shared visibility.
- Highlights leakage from rework, delays, and claims as preventable risk, not just booked losses.
- Eliminates manual reconciliation across title, escrow, accounting, and compliance through unified data.
- Gives leadership a single, reliable view through title insurance BI dashboards, focused on risk and performance.
20%
Reduce closing delays with workflow visibility
15%
Lower claims exposure through early risk detection
10%
Improve margins by reducing rework & leakage
30%
Improve forecasting accuracy with pipeline analytics
40%
Accelerate decisions with real-time operational signals
50%
Reduce compliance effort with automated reporting
How NeenOpal Helps You
At NeenOpal, we help title insurance companies move from fragmented reporting to unified title insurance business intelligence through purpose-built dashboards. Our analytics reflect real transaction behavior across underwriting decisions, escrow timelines, agent activity, claims patterns, and regulatory obligations. By integrating title production, escrow, claims, accounting, and compliance systems, we reveal risk drivers, profitability levers, and audit gaps without adding operational complexity.

Data Integration Services
- Integrate underwriting, escrow, claims, accounting, and compliance data from core title systems.
- Automate reporting across policy issuance, settlements, and claims to reduce manual effort and errors.
- Build scalable data pipelines to support multi-state operations, high transaction volumes, and regulatory complexity.
01

Customizable Dashboard Solutions
- Design title insurance analytics dashboards aligned with underwriting, operations, finance, and compliance goals.
- Utilize automated data validation and interactive visuals to improve accuracy and surface operational trends.
- Configure KPI alerts for delays, claims spikes, compliance exceptions, and SLA breaches.
- Utilize predictive analytics to evaluate claims risk and optimize transaction throughput.
- Ensure secure data handling and audit-ready regulatory reporting to meet evolving compliance requirements.
02

User Training and Support
- Ensure long-term dashboard adoption and ROI with guided onboarding and continuous support.
- Deliver role-based training for underwriters, escrow officers, compliance teams, and leadership.
- Provide documentation, enhancements, and scaling support as title insurance operations grow.
03
Explore Our Dashboards
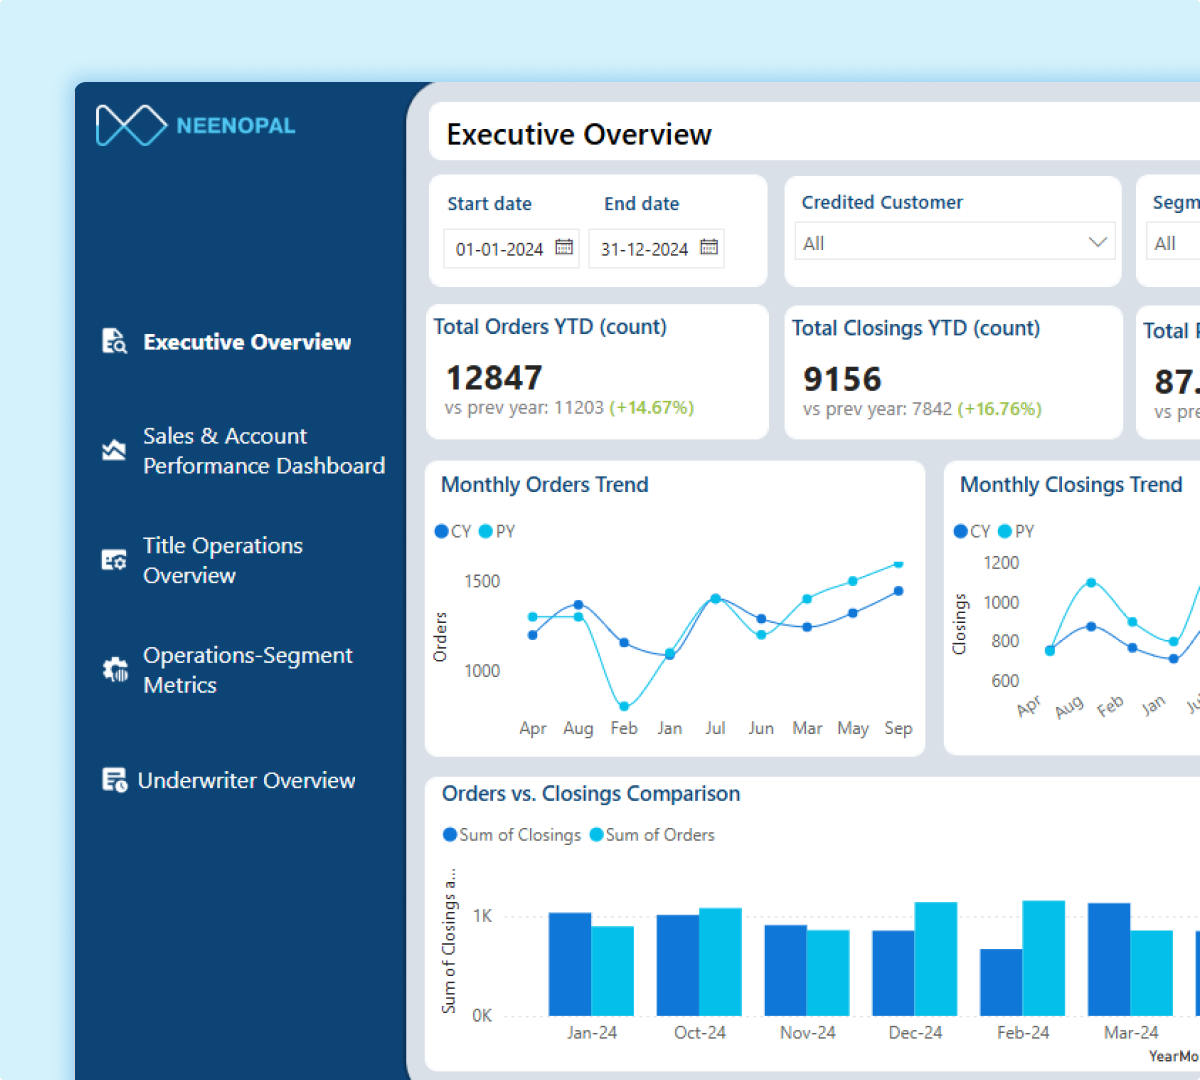
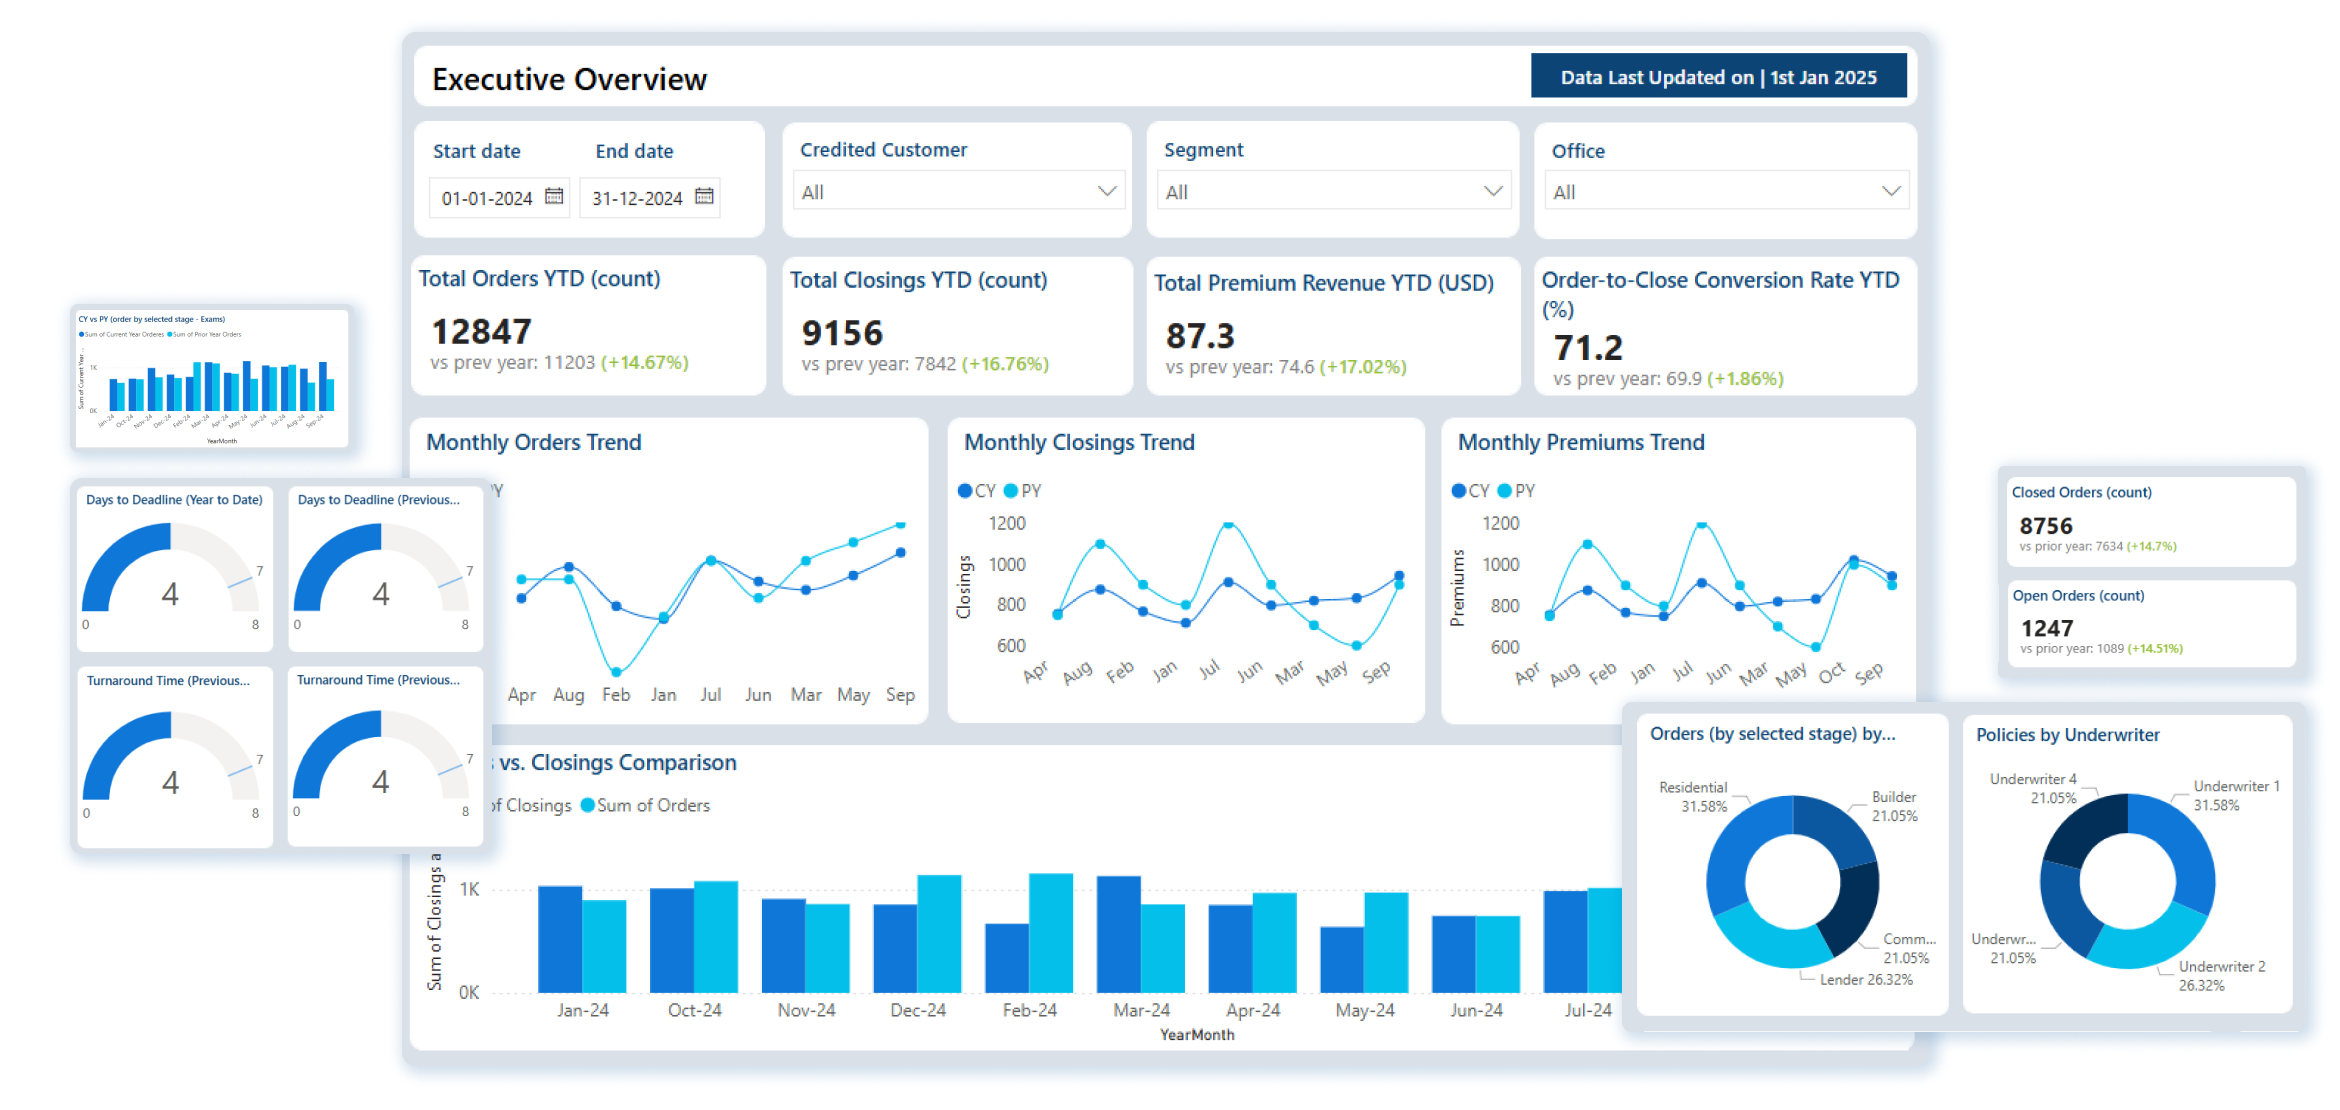
Executive Overview Dashboard
The Executive Overview Dashboard delivers a consolidated, leadership-level view of title insurance performance across sales, operations, underwriting, and risk.
1. Provides a single snapshot of revenue, transaction volume, cycle time, and profitability to understand the overall health of the business.
2. Tracks performance trends across regions, offices, and time periods to highlight growth patterns and operational stability.
3. Highlights operational bottlenecks, risk indicators, and expansion opportunities to support faster, more confident executive decisions.
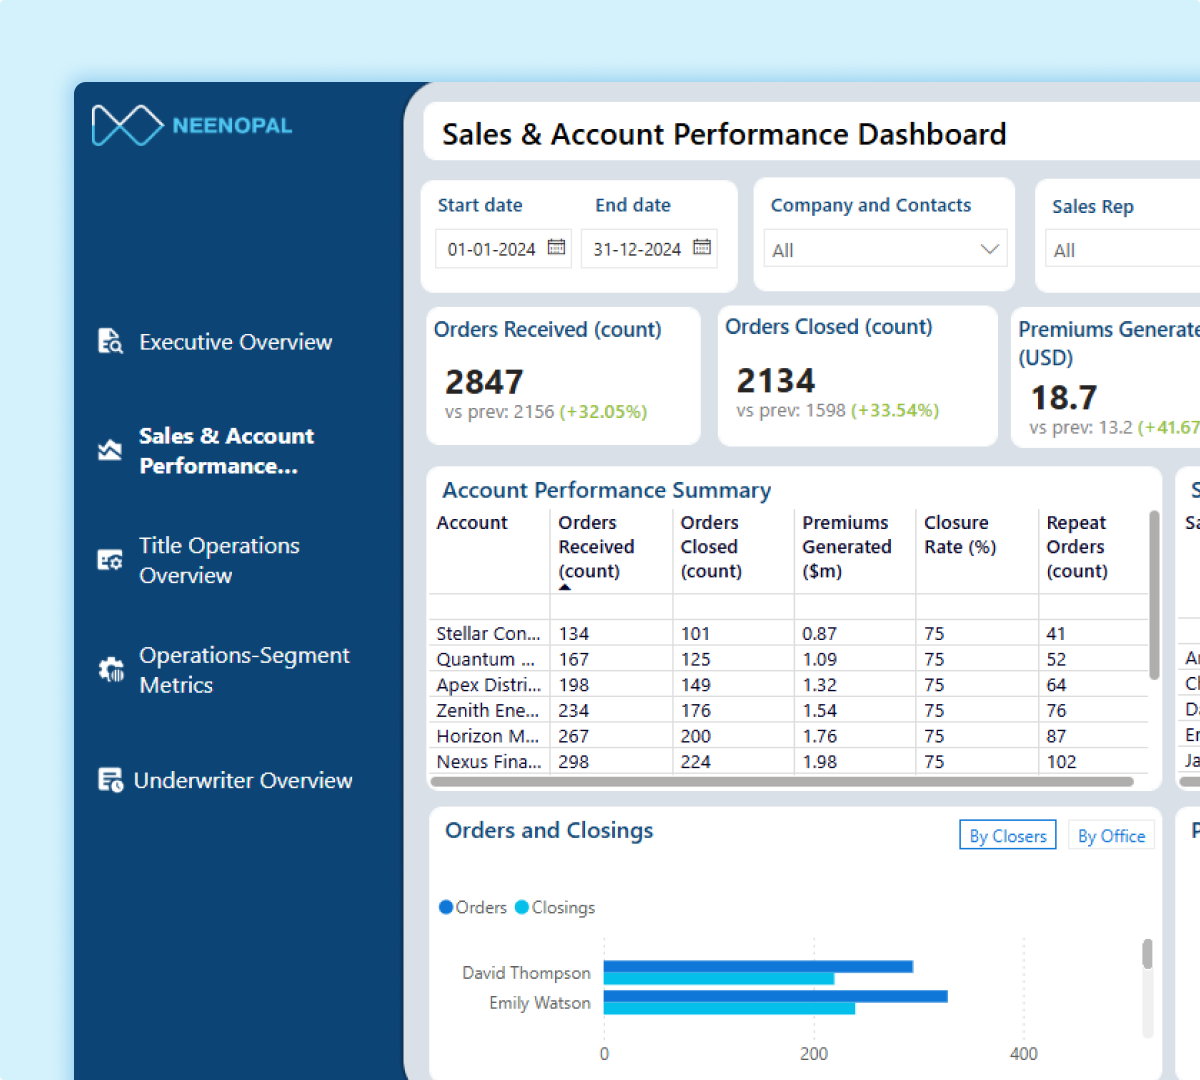
Sales & Account Performance Dashboard
A Sales & Account Performance Dashboard shows how accounts, agents, and relationships drive policy volume, revenue growth, and overall sales performance across regions and customer segments.
1. Tracks premium generation, policy counts, and account-level performance to measure sales effectiveness.
2. Compares sales productivity across agents, regions, and customer segments to identify performance gaps and strengths.
3. Identifies high-performing accounts and underpenetrated opportunities to guide sales planning and relationship strategy.
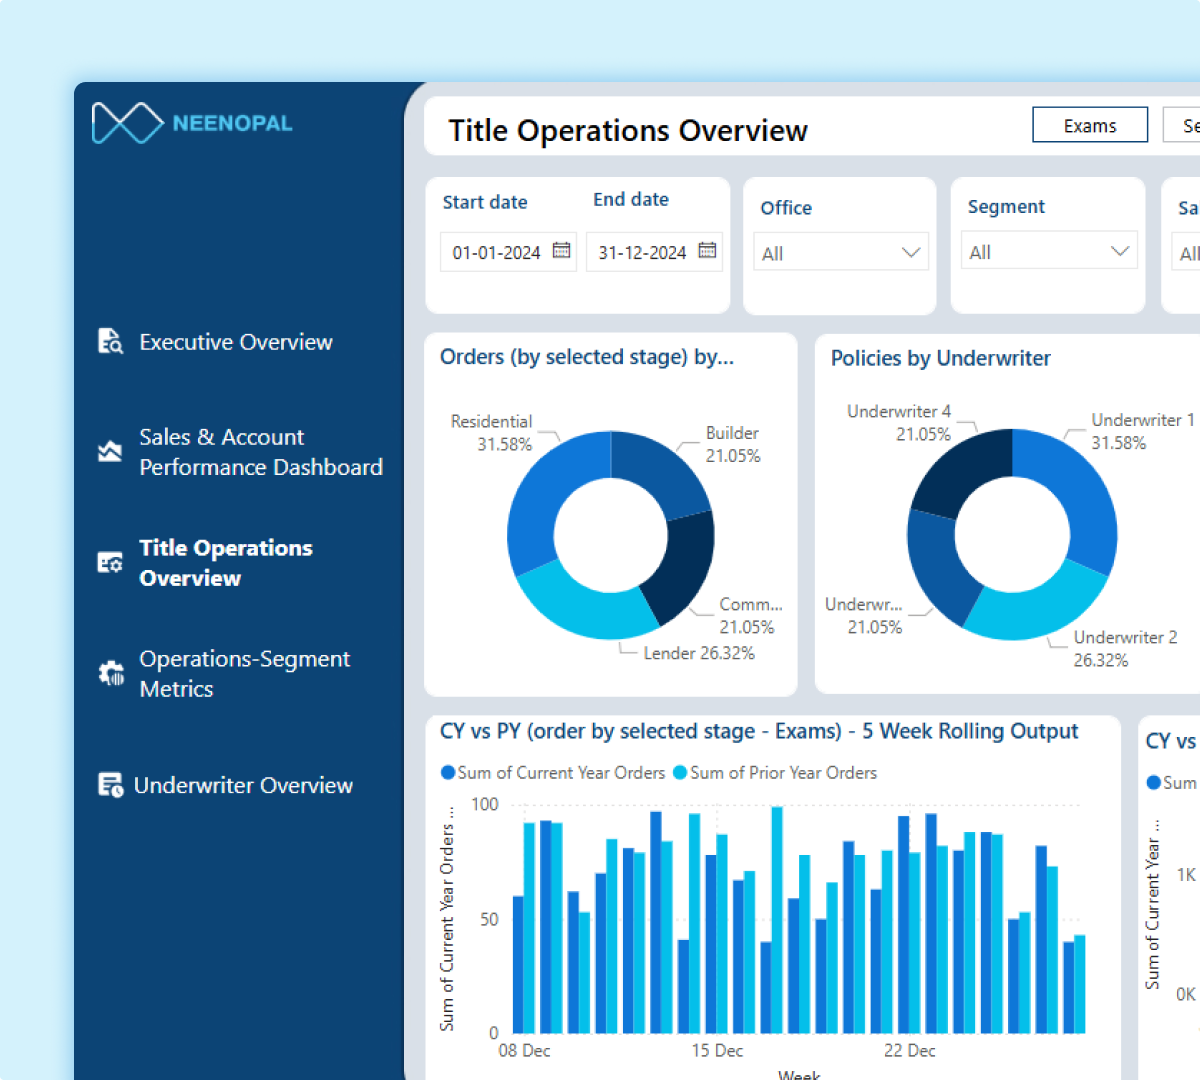
Title Operations Overview Dashboard
A Title Operations Overview Dashboard provides a comprehensive view of title production and escrow workflows, highlighting file movement across operational stages while showing volume, status, and processing patterns over time.
1. Provides a clear overview of open, pending, and closed files, enabling a better understanding of operational workload and capacity.
2. Tracks turnaround time, backlog, and throughput efficiency to identify delays, bottlenecks, and performance gaps across teams.
3. Enables the identification of operational friction points that impact closings, service timelines, and the overall customer experience.
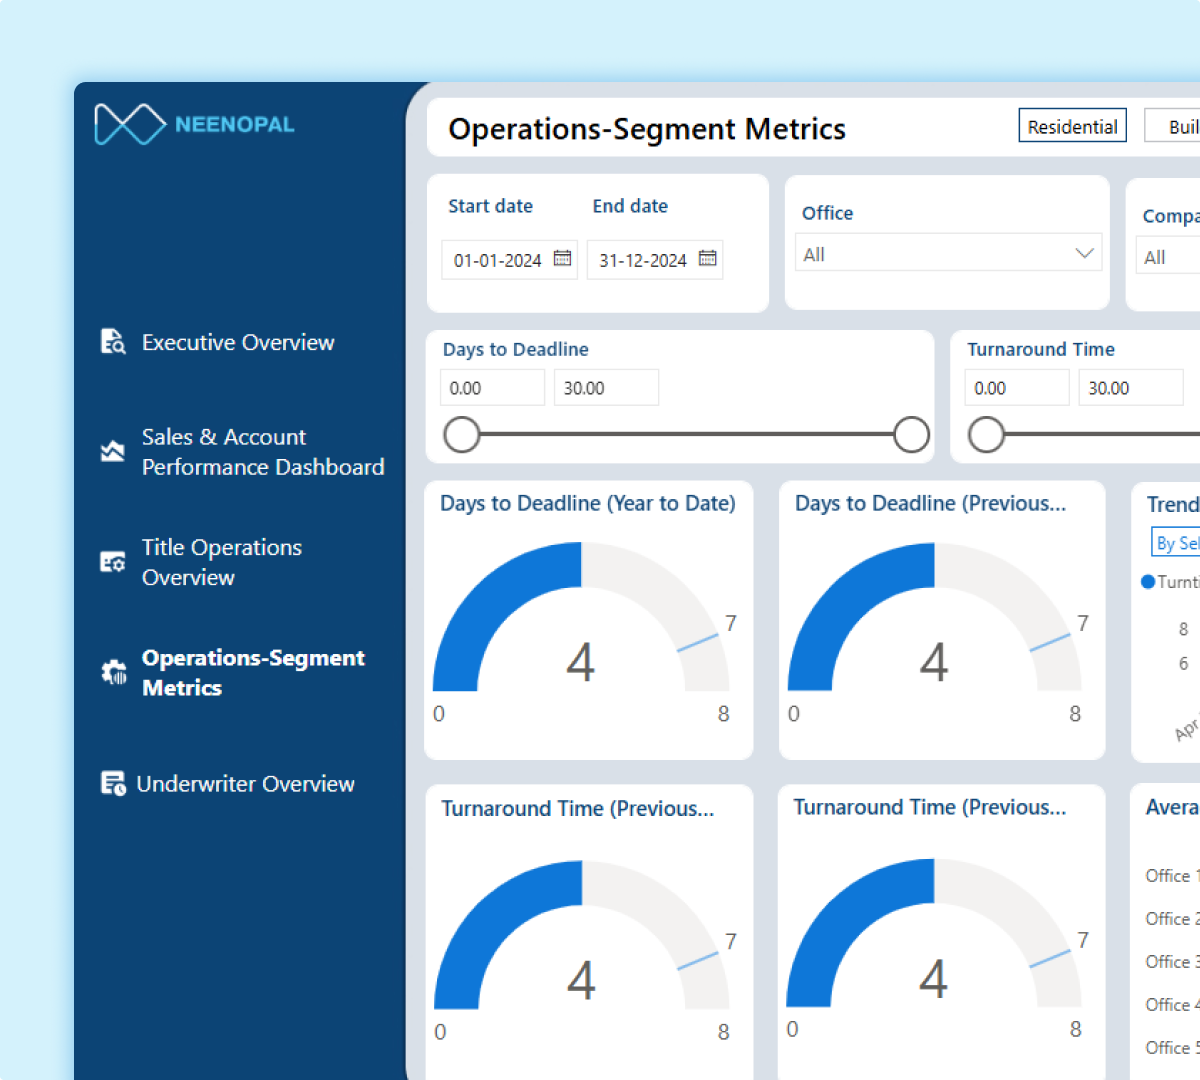
Operations – Segment Metrics Dashboard
An Operations Segment Metrics Dashboard provides a detailed view of operational performance across transaction types, geographies, and workflow segments, highlighting how different segments contribute to overall throughput and efficiency.
1. Provides clear insight into residential, commercial, refinance, and other transaction segments to understand performance variation.
2. Tracks SLA adherence, processing time, and transaction volume by segment to identify efficiency gaps and risk areas.
3. Enables targeted process improvements and smarter resource allocation across teams and operational segments.
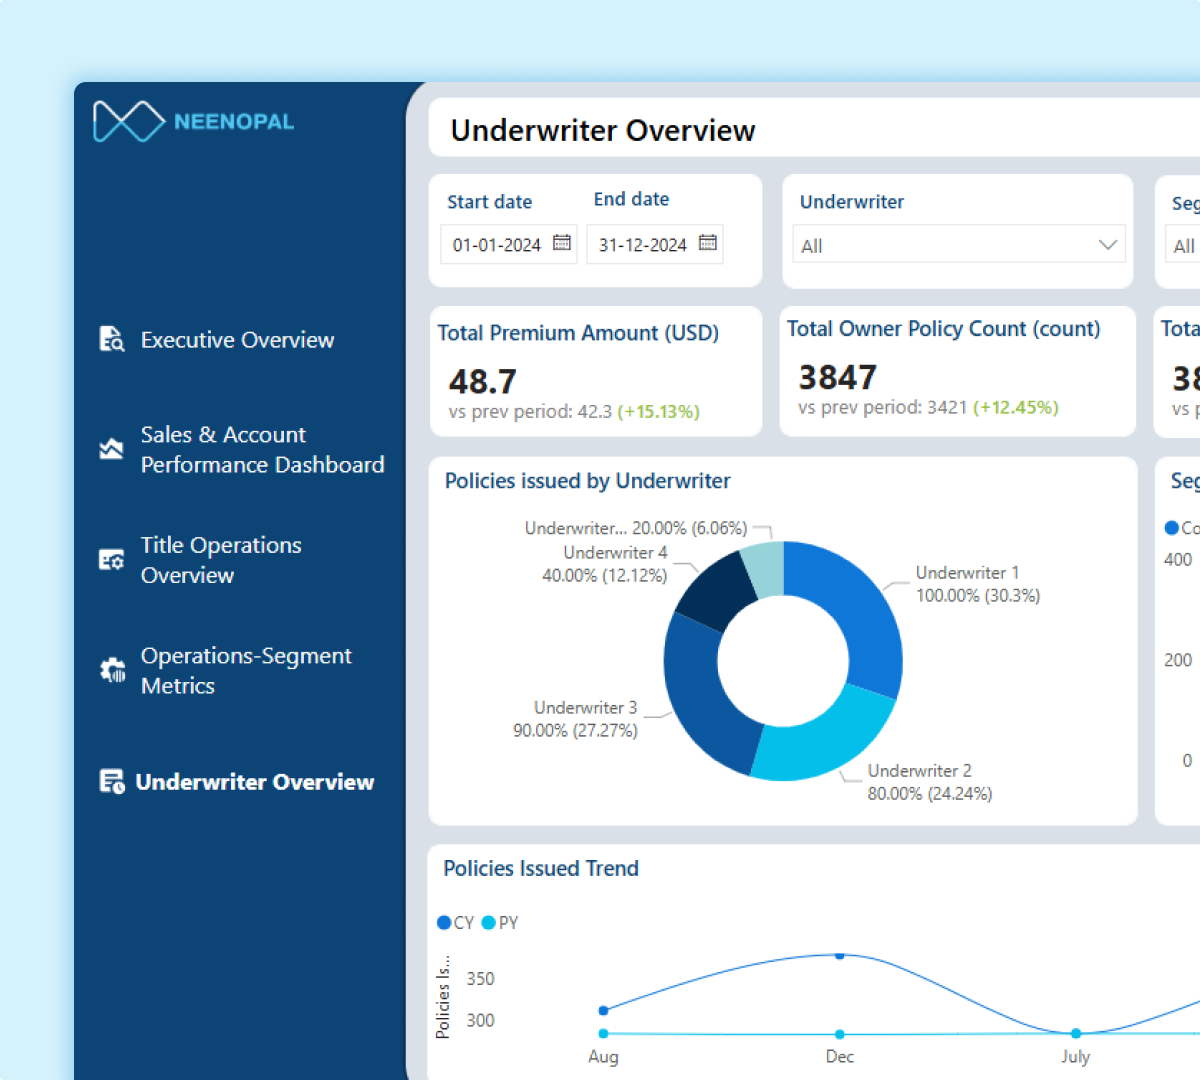
Underwriter Overview Dashboard
An Underwriter Overview Dashboard provides a comprehensive view of underwriting efficiency, consistency, and contribution to overall operational performance, with integrated title insurance risk analytics.
1. Provides clear visibility into workload distribution, turnaround time, and decision throughput for each underwriter.
2. Tracks underwriting performance across regions and transaction types to identify variations in speed, quality, and risk exposure.
3. Enables identification of risk concentration and opportunities to improve underwriting consistency and risk management.
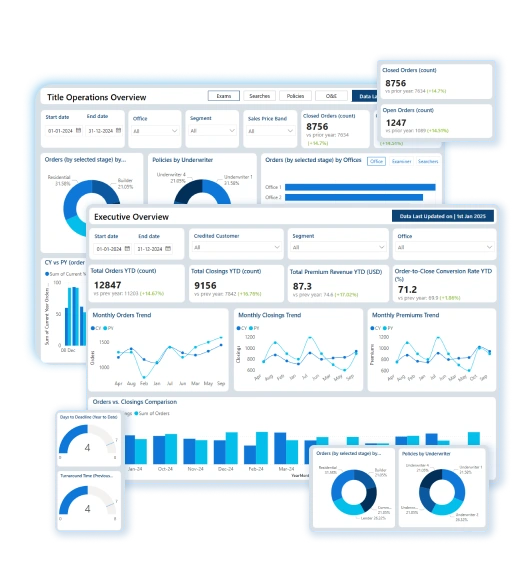
Dashboard Preview
This demo brings together the most essential title insurance dashboards—Executive Overview, Sales & Account Performance, Operations, Segment Metrics, and Underwriting. Built with real-time KPIs and clear, executive-ready insights, these dashboards enable leaders to identify delays early, balance underwriting workloads, mitigate risk, and make informed decisions that support sustainable, profitable growth.
Download the Complete List of Must-Have Title Insurance Dashboards
Services Used
We use modern ETL tools, data warehouses, data visualization tools, and cloud platforms to offer seamless, data-driven solutions. These services provide efficient data processing, storage, and analytical reporting for informed decision-making. To learn more or discuss how we can enhance your data strategy.
ETL Tools

Azure Data Factory

AWS Glue

DBT
Data Warehouses

Azure Synapse Analytics

Amazon Redshift

Snowflake
Data Visualization Tools

Power BI

Tableau

Looker

Grafana
Cloud Platform

Azure

AWS

Google Cloud
Solutions Offered
We provide specialized dashboards and analytics for the title insurance industry, delivering clear visibility into underwriting, escrow, claims, finance, and compliance. Our solutions help title companies reduce risk, streamline operations, improve efficiency, and drive sustainable, profitable growth.
Sales & Revenue Intelligence

Sales Overview
Provides visibility into premium revenue, policy volume, and file performance to identify top offices.

Channel Performance
Monitors revenue across direct, agency, lender, and referral channels to assess overall sales mix.

Campaign Impact & ROI
Tracks sales initiatives and referral effectiveness to improve agent productivity and return on investment.
Operations & Workflow Management

Operations Overview
Shows file volumes, turnaround times, and processing backlog across title and escrow workflows.

Workflow Efficiency
Analyzes processing time, SLA adherence, and bottlenecks to reduce delays and improve closings.

Capacity & Resource Use
Evaluates workloads across teams and underwriters to balance capacity and optimize staffing decisions.
Strategic Insights

Comprehensive Analytics
Deep analysis across underwriting, operations, claims, and finance to support strategic decision-making.

Performance Indicators
Key KPIs, including cycle time, loss ratio, premium per file, and compliance exceptions, are available at a glance.

Actionable Intelligence
Role-specific metrics empower title insurance leaders to improve risk control, efficiency, and profitability.
A Path to BI Success
A Business Intelligence (BI) roadmap is a plan that guides how to set up and use data analytics tools and processes to gain valuable insights and make informed decisions. It helps organizations build a clear path for integrating data solutions that support long-term growth and success. By aligning technology with business goals, it fosters efficient data management and drives continuous improvement. Learn more.