

It worked perfectly in the pilot. Twenty users, one workspace, scheduled refreshes running clean. Then you rolled it out: 200 users, six teams, daily distribution runs, and everything started breaking. This is exactly what it looks like when Power BI automation fails at scale.
-
Refresh failures with no clear error.
-
Gateway timeouts at peak hours.
-
Reports taking four minutes to load.
-
Distribution pipelines silently delivering stale data because a refresh ran long, and the export step timed out without anyone noticing.
This is not a bug. It is an architecture problem. The automation was built for a pilot and is now running production workloads it was never designed to handle. Here is the pattern, and what it actually takes to fix it.
Already know the failure mode? Skip to what NeenOpal recommends.
Why Pilots Succeed and Production Breaks
Pilots succeed because the conditions are controlled: small data, one workspace, patient users, and manual oversight. None of that survives a full rollout.
At scale, the same automation faces:
-
Concurrent users hitting reports simultaneously.
-
Chained refresh cadences across multiple datasets.
-
Datasets that have grown month-on-month since go-live.
-
A single gateway now serving 200 users instead of 20.
These are the Power BI scaling issues that stay invisible during a pilot and only surface once the system carries the real production load. When we audit deployments at NeenOpal, the same three failure modes appear almost every time: dataset limits, gateway saturation, and workspace governance breakdown. They rarely arrive alone. They compound each other.
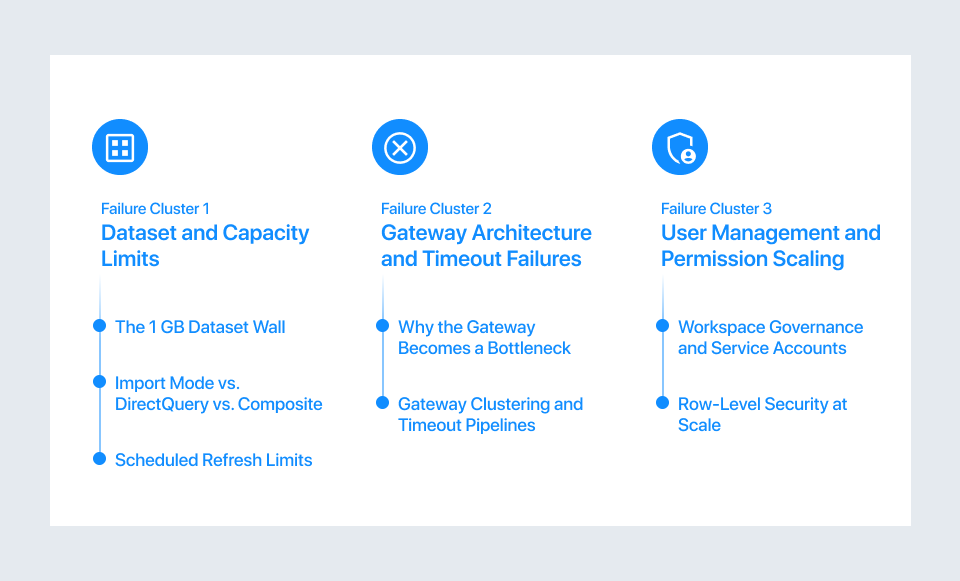
Failure Cluster 1: Dataset and Capacity Limits
1. The 1 GB Dataset Wall
Power BI dataset limits are enforced at the licence level. Power BI Pro caps each dataset at 1 GB. Premium Per Capacity raises it to 25–50 GB or 100 GB, depending on SKU; Premium Per User extends it to 100 GB. Most enterprise teams start on Pro and hit that wall without warning.
What it looks like in practice:
-
A sales dataset starts at 400 MB.
-
Six months of production use pushes it past 1 GB.
-
The refresh fails.
-
The error is generic.
-
There was no warning at 900 MB.
-
The limit is invisible until it is breached.
Incremental refresh helps but is not a universal fix. It requires query folding support, which many SQL sources with complex transformations cannot provide. If the model is already near the Power BI dataset size limit, incremental refresh buys time. The data model usually needs a redesign.
2. Import Mode vs. DirectQuery vs. Composite
Most teams start with the Import mode: fast queries, responsive reports. When they hit the size wall, the common move is DirectQuery. That removes the storage ceiling but creates a new one:
-
Every report interaction queries the source directly.
-
50 to 100 concurrent users can generate 50 to 100 live queries at the same time. However, the actual query volume is driven by visual interactions, not just the number of users. For example, 50 users interacting with multiple visuals can result in hundreds of simultaneous queries.
-
Source systems not built for this load respond slowly
This is when Power BI slow large dataset complaints begin. The composite model, Import for static tables and DirectQuery for large live tables, is the architecturally correct fix. The difference in Power BI Premium vs Pro performance is most visible here: Premium's dedicated capacity makes composite models viable at scale; shared Pro infrastructure often cannot sustain them. Composite models require careful design and specialist involvement to implement correctly.
3. Scheduled Refresh Limits
Pro allows 8 scheduled refreshes per dataset per day. Premium allows 48. Both are hard caps. Enterprise pipelines chain refreshes: Dataset A must complete before Dataset B, which must complete before the report exports. When chains span multiple workspaces, the daily cap can be hit without any single pipeline appearing over-engineered.
This is one of the most common causes of Power BI refresh failure at scale: no alert is sent, and reports simply contain stale data with no indication anything went wrong.
Failure Cluster 2: Gateway Architecture and Timeout Failures
1. Why the Gateway Becomes a Bottleneck
The on-premises data gateway is a single Windows service on a single machine. Every scheduled refresh, every DirectQuery interaction, every dataflow refresh runs through it.
At enterprise scale, this creates pressure:
-
50 simultaneous report users.
-
Six parallel refreshes.
-
Queries queue instead of executing immediately.
-
Queries that should return in two seconds take thirty.
Power BI gateway issues show up as high query wait times in the gateway performance logs: the gap between when a query is received and when execution actually starts. Most teams do not monitor these logs; they discover the problem weeks in, when users report slow reports or timeouts. The most common mistake we see is adding more reports to the same gateway without increasing gateway capacity.
2. Gateway Clustering and Timeout Pipelines
The fix is gateway clustering: multiple nodes behind a load balancer, distributing query volume rather than queuing it on one machine. Microsoft supports this natively. Most BI teams are unaware it exists until a consultant flags it.
Timeout failures compound the problem. Automated pipelines, refresh, export, email, each carry their own timeout. Power Automate HTTP actions have a default timeout of 120 seconds (2 minutes).
What happens in practice:
-
A refresh runs longer than expected
-
The downstream export fires against a stale dataset
-
The email goes out
-
No error is raised
For production pipelines: set Power Automate HTTP timeouts to PT2H (two hours), use adaptive polling intervals, and add an explicit data-freshness check before triggering the export step.
Gateway saturation and silent refresh failures are exactly what NeenOpal resolves on enterprise deployments.
Talk to a Power BI Automation Architect
Failure Cluster 3: User Management and Permission Scaling
1. Workspace Governance and Service Accounts
Power BI user management at enterprise scale carries a hard structural limit: 1,000 members per workspace. But the more common failure is not the cap; it is the governance breakdown:
-
Admin and Contributor roles get handed out informally.
-
Permissions are assigned to individuals, not security groups.
-
When an employee is offboarded and their service account loses workspace membership, every pipeline attached to it fails silently at the next run.
Service account fragility is the gap nobody talks about:
-
When a service account password rotates and the gateway credential is not updated, every refresh fails
-
When an MFA policy is applied org-wide and the service account is not excluded, non-interactive refresh calls start failing
-
When a licence review reassigns the Pro licence, every automation stops with no notification
The Fix: Dedicated service account identities, pinned licences excluded from cost sweeps, MFA handled via conditional access, and every automation documented against the account it depends on.
2. Row-Level Security at Scale
RLS does not have officially defined user limits, but its performance impact increases with concurrency, model complexity, and DAX logic.
-
With dynamic RLS, Microsoft Power BI evaluates the security context for every query, which adds overhead as usage scales.
-
Each user operates in a unique security context, which reduces caching efficiency, especially across different users.
-
As concurrency increases, report rendering times can degrade if the model and infrastructure are not optimized.
The alternative is report-per-recipient rendering via the Power BI REST API. In this approach, RLS is applied at export time, and static outputs are distributed instead of live report access. This is more complex to implement, but it is often used in scenarios that require consistent performance at enterprise scale.
What to Fix and Where the Line Is
1. What You Can Fix Yourself
Some failures have self-serviceable fixes:
-
Dataset Size Hitting the Cap: Upgrade to Premium Per User or Premium Per Capacity (raises limit to 100 GB, removes 8-refresh/day cap).
-
Slow Refreshes Where Query Folding is Supported: Implement incremental refresh.
-
Gateway Saturation Confirmed in Performance Logs: Add a second node and enable clustering.
-
Refresh Failures from Credential Expiry: Audit service accounts and implement rotation alerts.
-
Permission Breaks from Individual Assignments: Migrate to security group-based access.
These fixes are real, and they work. The question is whether they address the root cause or only the symptom.
2. Where the Architecture Needs to Change
When the automation was built for pilot conditions and is now carrying production load, patching settings does not hold. The changes required are:
-
Pipeline-Triggered Refresh (Event-Driven, Not Time-Scheduled): Eliminates chained refresh limit failures.
-
A Proper Distribution Layer via the REST API Export to File Endpoint: Replaces fragile Power Automate chains.
-
Workspaces Restructured by Business Domain, Not by Team: Eliminates permission sprawl
-
Gateway Clustering with Active Latency and Queue-Depth Monitoring: Converts a silent failure point into a managed component
These are architecture projects. They require planning and specialist knowledge. They are not settings changes. We have rebuilt Power BI automation architecture for enterprises across healthcare, finance, and retail. If you are already in production and hitting these walls, the first step is a structured audit. That is what the NeenOpal Power BI Automation Audit delivers.
Book a Power BI Automation Audit
Download: Enterprise Power BI Architecture Checklist (PDF)
Conclusion: The Architecture Behind the Failures
Dataset limits, gateway saturation, and service account fragility are predictable failures. They just need to be designed for upfront. Understanding why Power BI automation fails is the first step; designing so it does not is the work. If you are already in production and hitting these walls, the question is not whether to fix it. It is how fast.
Frequently Asked Questions
Q1. Why is Power BI slow with large datasets?
Power BI performance issues with large datasets come from three compounding factors: Import mode loads all data into memory and hits size limits; DirectQuery removes the size ceiling but creates per-user query overhead at scale; and gateway saturation increases query wait times across all connected reports. At enterprise scale, resolving this is an architecture decision, not a settings tweak.
Q2. What are the limitations of Power BI for enterprise use?
The primary Power BI limitations for enterprise use are: dataset size capped at 1 GB on Pro (up to 400 GB on Premium per SKU); scheduled refreshes capped at 8 per day on Pro and 48 on Premium; a single-node gateway that saturates under concurrent enterprise load; and workspace governance and service account fragility that creates silent automation failures at scale.
Q3. Why does Power BI scheduled refresh fail?
Power BI refresh failure has four primary causes: dataset size exceeding the licence limit; daily refresh cap reached (8 on Pro, 48 on Premium); gateway timeout due to saturation or slow source queries; and service account credential expiry or licence reassignment. In most enterprise environments, two or three of these occur simultaneously, which is why failures are hard to diagnose without a structured audit.
Q4. Does Power BI scale for large organisations?
Power BI scaling issues arise when organisations deploy without Premium licensing or without a governance framework built for production. With Premium and proper architecture, event-driven pipelines, REST API distribution, domain-structured workspaces, and dedicated service accounts, Power BI scales to hundreds or thousands of users. Without them, it does not.
Q5. What is the maximum dataset size in Power BI?
The Power BI dataset size limit is 1 GB per dataset on Pro (hard limit, no override). Premium Per User increases the dataset size limit up to 100 GB, but datasets beyond 10 GB require the Large semantic model storage format to be explicitly enabled. This setting is not automatic and must be configured to take advantage of the higher limit.
Premium Per Capacity limits are tied to the memory available per SKU. For example, a P1 capacity supports up to 25 GB per semantic model, while higher SKUs like P3 and P5 support up to 100 GB and 400 GB respectively. These limits represent maximum memory available to a model, not guaranteed usable dataset size, as some capacity is reserved for query execution and refresh operations.
