

Have you ever noticed the shifts in your cloud cost program in the first quarter of the year?
The initial savings are a real 25%, sometimes 30%. Executives are pleased, and the engineering team is cautiously cooperative. Then a production incident gets blamed on a rightsizing recommendation. A developer spins up a new environment for a feature sprint, and nobody tags it. A commitment comes up for renewal, and nobody notices. By month nine, you're back to within 10% of where you started, and the CFO is asking pointed questions about what the initiative actually achieved.
This isn't bad luck. It's the default outcome of how most organizations approach cloud cost optimization.
Sustainable cloud cost optimization isn't about finding savings once; it's about making them last. Organizations that follow the right sequence can achieve significant reductions and maintain them over time. Those who don't often see much of their initial savings erode within months.
This guide explains the 4D Cloud Cost Stack: Detect, Discount, Decommission, and Design, which is the logic behind its sequencing. We’ll also discuss the governance practices that help organizations turn short-term savings into long-term results.
Why Most Cloud Cost Programs Regress at Month 4
Here's the uncomfortable statistic that never makes the vendor slide decks:
“According to the Flexera 2024 State of the Cloud Report, organizations waste an average of 28% of their cloud spend. That number has barely moved in five years of annual reporting. Programs run, savings are declared, and then the bill climbs back up, and the cycle repeats.
McKinsey research puts the realistic yield from a well-run FinOps program at 20–30% in sustainable savings. IBM puts average cloud waste at 32%. So why aren't these numbers compounding? Why do organizations keep declaring cost-optimization wins that don't survive two quarters?”
The answer is rarely technical. It's structural.
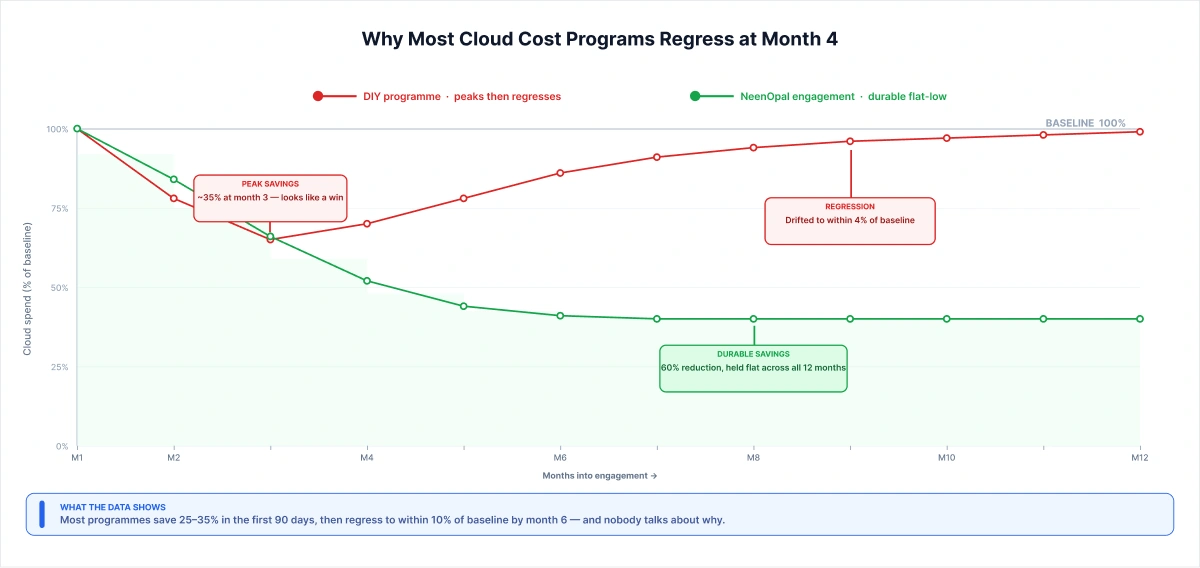
The pattern is the same across every engagement we inherit. A project gets sponsored. Someone is assigned. The team focuses for one quarter, and the bill drops 25–35%. Then the project ends, and executives move to the next priority. The dedicated resource gets pulled, and there's no ongoing function to maintain what was built.
AWS's own Well-Architected Framework is direct about what happens next: without a dedicated function with executive sponsorship, "guidance will be ignored, and cost-saving opportunities will not be prioritized." In practice, that looks like commitments expiring without renewal, tagging policies decay, non-production auto-shutdown gets disabled after one production incident, and by month six the bill is back within 10% of where it started.
The other force driving regression is political. Engineering doesn't feel accountable for a bill they didn't approve. Finance can see the number but not the workloads. The gap between visibility and ownership is where the money leaks, consistently, predictably, every time.
"The failure pattern is identical every time. We've inherited more cost-optimization programs than we've started from scratch. In almost every case, regression happened at the same inflection point: when the sponsoring executive moved to the next priority. The tagging was clean on day 90. By day 180, half the new workloads were untagged, and two dev environments were running 24/7 again. The technical fixes were still there. The function to maintain them wasn't. Durability requires a function, not a project, that's the single distinction that separates programs that hold from those that regress."
— Head of Cloud Engineering, NeenOpal
The 4D Cloud Cost Stack: Why Order Matters More Than Strategy
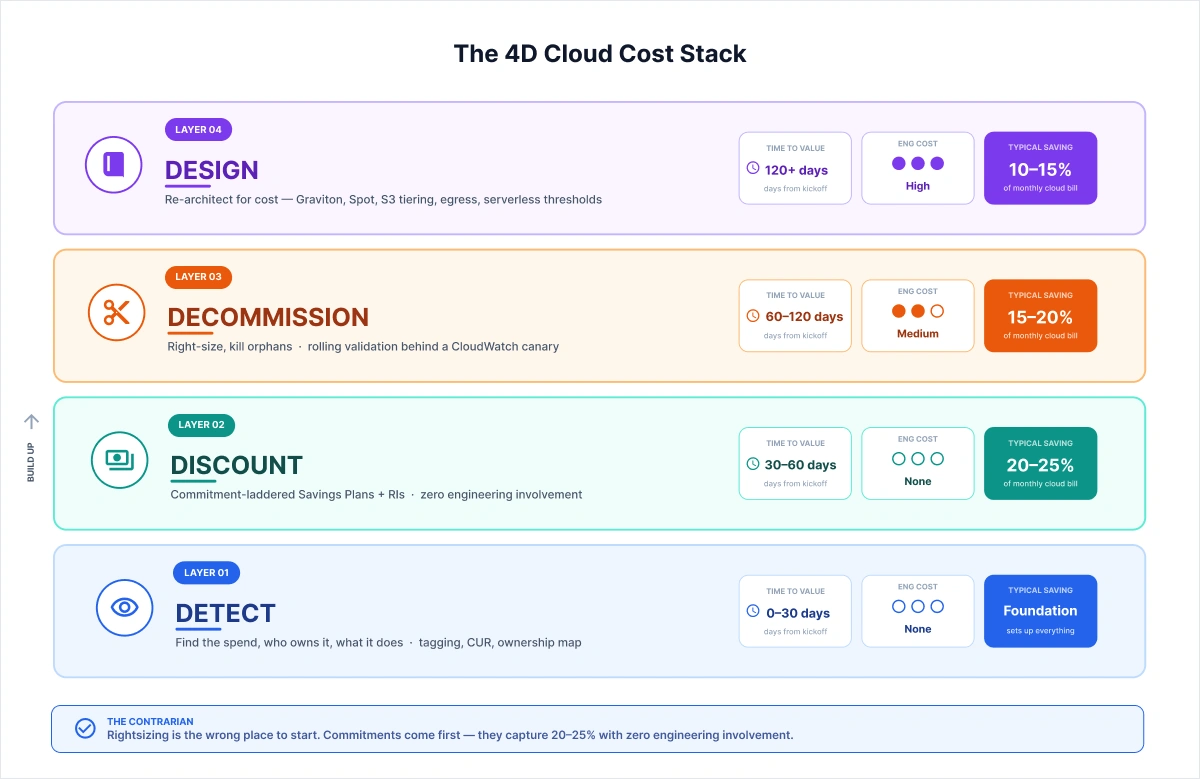
Every cloud cost engagement runs four layers in order: Detect, Discount, Decommission, and Design. The most common failure mode is running them in the wrong order, which destroys both engineering velocity and the durability of savings.
This is the framework we call the 4D Cloud Cost Stack. It isn't a strategy list. It's a sequenced architecture decision, and the engineering-cost gradient is what makes the sequence non-negotiable.
Here's why the gradient matters:
- The Discount layer requires zero engineering involvement. A FinOps team executes it in 30–60 days without touching a single workload.
- The Decommission layer requires coordination with engineering, rightsizing, auto-shutdown, and orphan cleanup. Medium friction.
- The Design layer requires real architectural work, Graviton migrations, Spot integration, egress optimization, and serverless threshold analysis. High friction, high yield.
Most teams instinctively start with design because the headline savings number is the biggest. That's the sequencing mistake. Running design before a discount means you're asking engineering to re-architect workloads before you've demonstrated a single no-friction win, and engineering pushes back. Reasonably.
The contrarian sequence is the correct one: capture zero-friction savings first, build political capital, then earn the right to ask engineering for their time.
Layer 1 - DETECT (0–30 days · Engineering cost: None)
Before you optimize anything, you need to see everything. The Detect layer establishes ownership, tagging accuracy, and cost allocation, the data foundation on which every subsequent layer depends. Without it, every optimization conversation becomes a political argument about whose workload is wasteful. Typical findings: 5–10% in immediate idle/orphan resources, plus the visibility layer that multiplies everything that follows.
Layer 2 - DISCOUNT (30–60 days · Engineering cost: None)
Commitment-based discounts such as AWS Compute Savings Plans, EC2 Reserved Instances, and Spot Instances are the highest ROI-per-hour activity in the entire program. They require zero engineering involvement and capture 20–25% of the bill within 60 days. This is where you start. Always.
Layer 3 - DECOMMISSION (60–120 days · Engineering cost: Low–Medium
Right-sizing, non-production auto-shutdown, orphaned resource cleanup. Engineering coordination begins here. Most programs trigger backlash at this layer because they arrive without the goodwill that Layer 2 builds. Sequence matters.
Layer 4 - DESIGN (120+ days) · Engineering cost: High)
Re-architecture for cost: ARM Graviton, Spot for stateless batch, S3 lifecycle tiering, data egress optimisation, serverless break-even analysis. Highest yield, highest engineering cost. Done last but always done.
Layer 1 - DETECT: Find the Spend Before You Try to Fix It
Your AWS bill has four leakage zones. Three of them have nothing to do with infrastructure; they're about who owns what, who knows what, and who's authorized to change it.
This is a harder problem than most teams expect. We regularly walk into environments where 30–40% of monthly spend carries no meaningful cost allocation tag, team name, project, or environment marker. When tagging drift exceeds 15%, governance collapses before optimization can start.
The failure modes we see most consistently:
- Inherited resources from acquisitions that have never been mapped to a current owner
- Dev and staging environments are running 24/7 because nobody's accountable for the cost
- Shadow IT workloads spun up outside the central cloud team's line of sight
- Fragmented AWS Organizations accounts where cost categories haven't been applied, and consolidation billing is obscuring the real spend picture
The tooling is solved: AWS Cost Explorer, Cost and Usage Reports (CUR), AWS Cost Anomaly Detection, and CUR-fed BI dashboards built on QuickSight. The technology isn't the problem.
Cloud cost is not an engineering problem. It is a governance problem that engineering is asked to solve without the tools, and the Detect layer is where you build those tools before anything else moves.
Layer 2 - DISCOUNT: The 22% That Requires Zero Engineering Time
Rightsizing is the wrong place to start. Commitment-based discounts capture 20–25% within 60 days with zero engineering involvement, and they build the political capital you'll need for the harder layers.
The instinct to start with rightsizing is understandable. It feels like the "real" technical work. It isn't. Rightsizing is a political negotiation. Commitments are a portfolio decision that FinOps and finance can execute without asking engineering for anything.
The three commitment levers and when each wins:
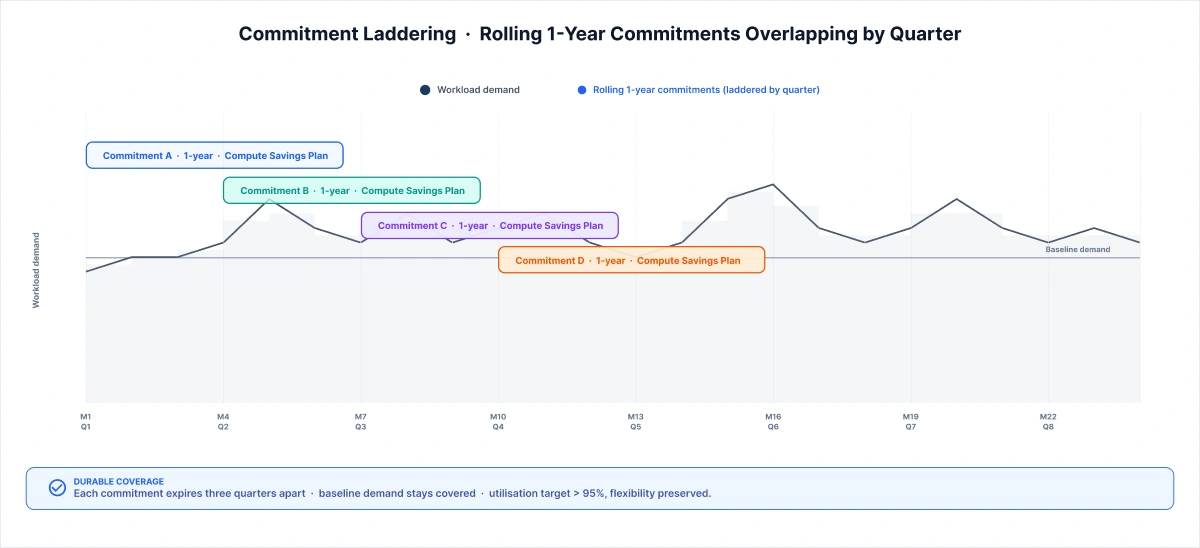
- AWS Compute Savings Plans commit to an hourly compute spend that flexes across instance families, sizes, and regions. For mixed or evolving workloads, Compute Savings Plans almost always beat Reserved Instances because flexibility prevents stranded commitments.
- EC2 Reserved Instances are the right choice when a workload baseline is fully predictable and instance-locked. Use only where that instance lock is an asset, not a liability.
- AWS Spot Instances for stateless, fault-tolerant workloads where a brief interruption window is acceptable. Delivers 60–80% off on-demand pricing on the right workload profiles; the 90% headline figure rarely holds once interruption overhead is factored in.
"Commitments aren't a one-time decision; they're a portfolio. We treat them like a bond ladder. Rolling 1-year Compute Savings Plans, staggered by quarter, so coverage stays continuous as workloads evolve. We target greater than 95% utilization per tranche. When utilization drops below that threshold for two consecutive months, we don't renew at the same level; we step down one notch. Compute Savings Plans almost always outperform Reserved Instances for mixed workloads because instance-family flexibility prevents the stranded commitments that kill RI programs. Most teams treat commitments as an annual procurement event. We run them as a monthly portfolio review."
— Senior FinOps Engineer, NeenOpal
Layer 3 - DECOMMISSION: The Right-Sizing Engineering Will Actually Approve
Here's what happens when you lead with rightsizing before building any trust: an engineer hears "we're going to shrink your instances" and mentally maps it to the last incident where capacity was the variable that prevented a P1. The conversation stops being about data and becomes about liability assignment.
Production rightsizing without rolling validation is the fastest way to lose engineering trust. We rightsize behind a CloudWatch-monitored canary window and revert automatically if p99 latency or error rate breaches it.
The non-production layer is where decommissioning starts, and it's where most programs undercount the savings. Non-production environment auto-shutdown typically recaptures 60–70% of non-prod compute cost.
The full decommission lever set, in the order we run it:
Non-production auto-shutdown schedule dev, staging, and QA environments to stop outside working hours. For teams with large dev footprints, this can represent 15–20% of total EC2 spend.
Orphaned resource cleanup: idle EBS volumes, unused Elastic IPs, abandoned snapshots, stopped instances still accumulating storage costs, and unused NAT Gateways.
Production right-sizing via Canary AWS Compute Optimizer provides the recommendations; we treat those as the starting point, never the instruction. We validate on p99 over a multi-week window and auto-revert on any latency or error rate breach.
“Rightsizing conversations blow up when engineering hears 'cut compute' and translates it as 'we'll get blamed when latency breaches.' The change is dynamic, not technical. The technical work is straightforward. We right-size on p99 over a multi-week window. AWS Compute Optimizer is the starting point, not the endpoint. Production right-sizing rolls out behind a CloudWatch-monitored canary slice with auto-revert. Once engineering sees the auto-revert work cleanly on the first deployment, usually on a dev tier first, the conversation changes completely. The trust comes from showing the safety net before they have to rely on it."
— Senior Cloud Architect, NeenOpal
The 8% average CPU rightsizing trap is real: averaging CPU utilization hides the spikes that matter. A workload at 8% on average can spike to 90% for 15 minutes twice a day. Rightsize, on average, triggers the incident and destroys the trust. Always use p99 over a multi-week window.
Layer 4 - DESIGN: The Architecture Levers (Highest Yield, Highest Friction)
The Design layer is where 11% of our 60% lives. It's also where the engineering cost is highest and where most clients want to defer because the ROI per engineering hour looks lower than Decommission.
We push back on that instinct. Architecture changes are the only levers that don't require ongoing discipline to maintain. A completed Graviton migration keeps delivering savings without a monthly governance review. Commitment renewals and rightsizing validations need continuous management. Architecture is one-time work with permanent yield.
The key design-layer levers:
- ARM Graviton migration typically offers 20–40% compute savings on supported workloads. ARM compatibility validation is the first gate; not all workloads migrate cleanly. For our holding-company client, 60% of the compute footprint migrated without dependency issues.
- Spot Instances for stateless batch data pipelines, CI/CD runners, model training, and media encoding. Where a brief interruption is acceptable, Spot delivers 60–80% off on demand.
- S3 lifecycle tiering: S3 Intelligent-Tiering for unpredictable access patterns; S3 Glacier and Deep Archive thresholds for predictable cold-data retention.
- Data egress optimization cross-AZ, cross-region, and cross-cloud transfer costs compound silently, especially in multi-cloud or hybrid architectures.
- Lambda vs. ECS vs. EC2 break-even serverless isn't always cheaper at scale. Break-even depends on execution frequency, duration, and memory profile.
AI/ML Cost Gravity: The 2026 Reality
Traditional FinOps wasn't designed for AI workloads. And the gaps are showing.
GPU spend grows roughly 5× faster than standard cloud line items. Usage is bursty and hard to forecast. Pricing is opaque compared to standard EC2. And the same model that costs X during training costs 5× more on inference once it reaches production scale.
AI workloads break every assumption of traditional FinOps usage is bursty, GPU pricing is opaque, and the same model costs 5× more on inference at scale than during training. Every layer of the 4D framework needs AI-specific treatment.
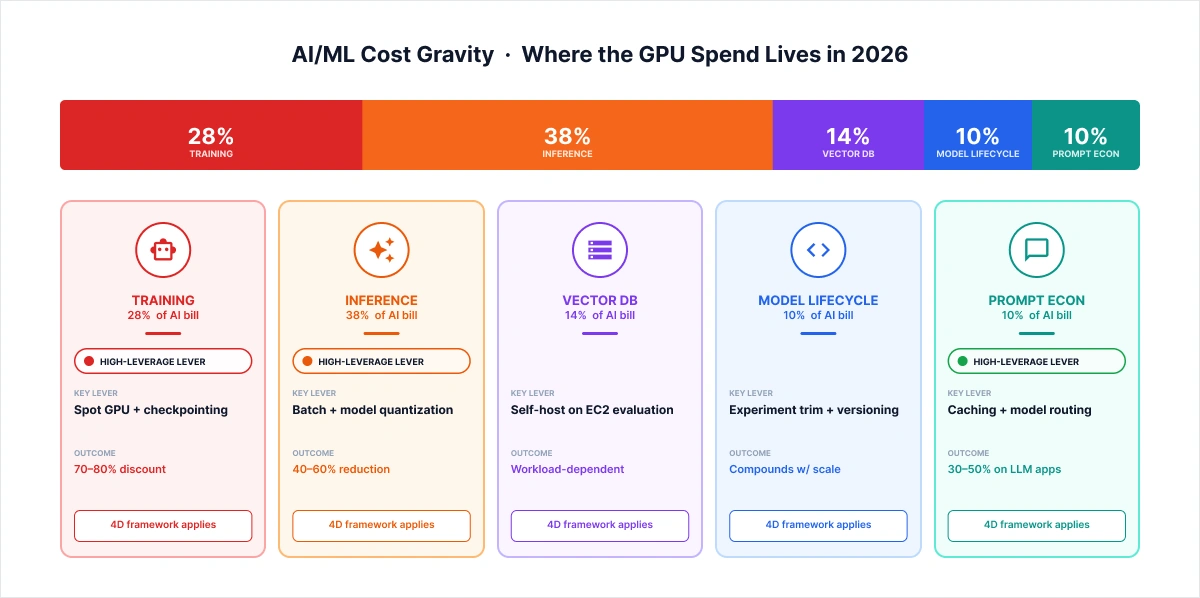
The cost composition of a typical AI/ML workload in 2026:
- Training compute: GPU instances, bursty usage, Spot-eligible with checkpointing
- Inference compute: GPU or CPU at scale, latency-sensitive, requires Savings Plans, not Spot
- Vector DB hosting: self-hosted on EC2 vs. managed services (Pinecone, OpenSearch, Weaviate), a decision with material TCO implications
- Model lifecycle overhead: experiment tracking, versioning, A/B infrastructure
- Prompt economics for LLM applications: caching, context compression, and model routing decisions that compound quietly at production scale.
"Training and inference need completely different pricing strategies, and most teams miss this because they plan costs at model-build time, when the budget is still training-heavy. For training, Spot is the right move: with 5–15 minute checkpointing and a Spot Fleet diversified across instance families, we realize 70–80% savings over on-demand. The 90% headline figure from AWS rarely holds once you factor in interruption overhead. For inference, Spot doesn't fit; you can't pause a user request for two minutes. Inference gets Compute Savings Plans, and for SageMaker-hosted models, SageMaker Savings Plans. The cost shift most teams don't plan for: within 6–12 months of production launch, inference becomes the majority of GPU spend. Most optimization programs are still built around the training budget they had during the build phase."
— Senior ML Engineer, NeenOpal
Our HIPAA-compliant DICOM imaging platform migration to AWS is concrete proof: GPU autoscaling is optimized for both cost and performance, scaling to zero between batch processing windows and right-sizing inference instances to actual throughput demand. For LLM applications, prompt economics is where cost compounds fastest. Caching repeated prompts, compressing input context, and routing simpler queries to smaller models can reduce inference costs by 40–60% without changing output quality.
Case Study: 60% Reduction, Lever-by-Lever
The 60% number deserves a line-by-line defense. Here's exactly where it came from.
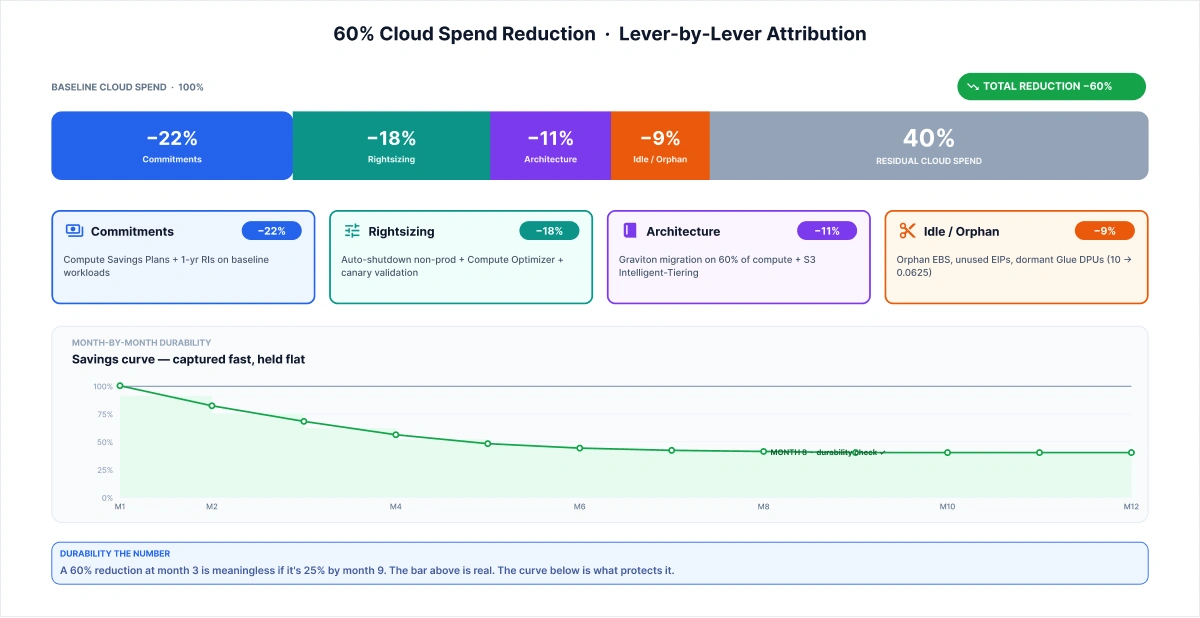
The engagement: a holding company operating across multiple business units, consolidated AWS billing, and approximately $7M annual cloud spend. We inherited an environment with 40%+ untagged spend, three prior cost-optimization attempts that had each regressed within two quarters, and an engineering team that had reasonably stopped extending trust to any consultant who arrived with a rightsizing deck.
|
Layer |
Lever |
Saving |
|
Discount |
Compute Savings Plans + 1-year RIs on steady-state baselines. |
22% |
|
Decommission |
Non-prod auto-shutdown + Compute Optimizer rightsizing behind canary |
18% |
|
Design |
Graviton migration (60% of compute) + S3 Intelligent-Tiering + Glue refactor |
11% |
|
Decommission |
Idle/orphan cleanup: EBS, EIPs, snapshots, dormant Glue DPU allocations |
9% |
|
Total |
|
60% |
Month-by-month arc:
- Month 1: Commitment audit. Coverage gaps identified on ~$1.5M annualized spend. Savings plans were laddered in; 22% was captured before we touched a workload.
- Months 2–3: Non-production auto-shutdown across five business units. Dev and staging environments running 24/7 were scheduled to stop outside working hours. Orphan cleanup sweep: unused EBS volumes, abandoned snapshots, dormant Glue DPU allocations, including the pipeline refactored from 10 DPUs to 0.0625.
- Months 4–6: Production rightsizing behind CloudWatch-monitored canary windows. Engineering approved cleanly once they'd seen the auto-revert mechanism work twice.
- Months 7–12: Graviton migration (60% of compute footprint), S3 Intelligent-Tiering on long-tail data stores. Architecture changes closed the last 11%.
"The engagement ran on the AWS Well-Architected rhythm: monthly cost reviews against budget, with AWS Cost Anomaly Detection alerts feeding the same review forum. What worked cleanly was commitments. First, we had 22% locked in before engineering had to give us anything. What didn't work on the first attempt: tagging governance. We rebuilt the tagging schema twice because the initial rollout fragmented across business units before AWS Cost Categories was applied. Cost Categories, which let you assign organizational meaning to costs without requiring tags on every resource, were the second attempt at a fix that actually held. The month-8 durability check: 58% sustained. Two points below the peak. Anything within 5 points of peak at month 8 is a healthy program. Below that is a regression problem."
— Delivery Lead, NeenOpal Cloud Practice
The Governance Layer: What Stops Savings From Regressing
A 60% reduction at month 3 is meaningless if it's 25% by month 9. Durability matters more than peak savings, and durability is what separates a project from a discipline.
The governance layer is the section most cloud cost articles skip because it has no headline savings number of its own. It's the mechanism that holds everything the optimization layers are built on, and without it, every prior layer eventually unwinds.
The specific governance mechanisms that make savings hold:
- Tagging enforcement via SCPs: a hard block on resource creation without required tags. Not an advisory policy. No tag, no launch.
- AWS Cost Anomaly Detection: automated alerts when spend exceeds a configurable threshold above the rolling average. We set alerts at 15% above the 7-day rolling baseline. This is the same anomaly-detection and Well-Architected review rhythm we deployed in our global manufacturer AWS Well-Architected engagement
- Monthly FinOps review cadence: engineering teams own their cost line items and bring data to the review. Cost KPIs are measured alongside velocity KPIs.
- Commitment utilization tracking: automated alerts when tranche utilization drops below 90% for two consecutive months. Triggers a commitment-ladder adjustment before stranded capacity compounds.
- Tagging-coverage drift dashboards: coverage percentage tracked weekly. When coverage drops below 85%, a remediation sprint fires automatically.
Cloud cost is not an engineering problem. It is a governance problem that engineering is asked to solve without the tools, and the governance layer gives them those tools and the ownership, to maintain what the optimization program built. The change-management piece is what most programs skip: engineering needs to own their cost lines alongside their velocity metrics. Not be handed a cost-reduction mandate by finance. Own it, measure it, be accountable for it. That ownership shift is what makes governance durable rather than ceremonial.
Build, Buy, or Partner: The Honest Decision (And How Not to Get Burned Again)
If you've arrived here with a prior vendor scar: junior-staffed delivery, oversold outcomes, and a great deck followed by a mediocre engagement, you're in the majority among the VP-level buyers we talk to. The scar is the reason they read the full methodology section before they look at credentials. That's the right instinct.
Here's the honest framework for three paths:
|
Build Internal |
SaaS Platform |
Delivery Partner |
|
Best for: > $5M annual spend Mature engineering org Predictable workloads Runway to hire & ramp |
Best for: $500K–$5M spend No FinOps headcount Strong on Discount + Decommission layers |
Best for: Savings + governance within 6 months AI/ML cost expertise No internal bandwidth |
The partner-evaluation criteria that actually differentiate are
- AWS Partner tier: AWS MSP accreditation means the partner has been audited on operational excellence for managed AWS environments. NeenOpal holds AWS MSP accreditation (October 2025), AWS Advanced Tier Services Partner status, AWS SaaS competency, ISO 27001:2022, and SOC 2 compliance.
- Lever-attributed case studies are not "we saved 40%" but "22% from commitments, 18% from rightsizing, 11% from architecture, and 9% from idle cleanup. Attribution is the credibility signal.
- Senior team continuity: the person who scopes the engagement should be the person who delivers it. Junior-staffed delivery is the most common cause of vendor scars.
- Sub-$25K entry point: a bounded, fixed-fee assessment path that doesn't require a procurement cycle. If a partner won't offer this, they're not confident in their diagnosis.
See exactly where your cloud spend is leaking, lever by lever.
Get a fixed fee. AWS Cloud Assessment: a lever-attributed diagnosis, commitments, rightsizing, architecture, and idle cleanup, delivered in under two weeks. Sub-$25K, no procurement cycle, scoped and delivered by the same senior team.
Frequently Asked Questions
1. What is cloud cost optimization?
Cloud cost optimization is the ongoing discipline of reducing cloud spend while protecting performance, reliability, and engineering velocity, executed as a layered program spanning visibility, pricing, infrastructure, and architecture. One-time cleanup efforts typically regress within 6 months. Durable programs pair the technical levers with a governance layer, tagging enforcement, anomaly detection, and monthly reviews that prevent drift.
2. How much can cloud cost optimization save?
Well-executed programs typically reduce cloud spend by 30–50% within 6 months. Aggressive programs with architecture-level changes can reach 50–60% over 12 months. A 60% saving that regresses to 25% by quarter-end is measurably worse than a 35% saving that holds across two years.
3. Should I rightsize before applying commitments?
No, commitments come first. Applying savings plans before rightsizing captures 20–25% with zero engineering involvement and lets you rightsize against a lower base. The common mistake is rightsizing first, which leaves savings on the table and burns engineering goodwill you'll need for architecture-layer work later.
4. How do I optimize AI/ML cloud costs?
AI workloads need AI-specific levers: Spot GPU for training (70–80% discount with checkpointing), batch inference where latency permits, model quantization for inference cost reduction, and careful vector DB hosting decisions. Apply the 4D framework with AI-specific overrides at each layer.
5. Why do cloud cost savings disappear after 90 days?
Savings regress because the optimization effort is treated as a project, not a discipline. Without a governance layer, tagging enforcement via SCPs, anomaly detection, monthly reviews, and engineering ownership of cost lines, drift restores the baseline. Most common regression patterns: commitment expiry without renewal, dev/staging auto-shutdown disabled after an incident, post-launch spend on new features nobody owns.
6. How long does cloud cost optimization take?
Meaningful savings appear within 30 days (detect + discount layers), with most program yield captured within 120 days. Architecture-level changes extend the timeline based on engineering bandwidth. Total elapsed time depends less on technical complexity and more on change management; engineering approval typically takes longer than the technical work.
