

A BI lead I know spent most of a quarter chasing one screenshot. A stakeholder had seen a slick analytics screen inside a SaaS tool, dropped it into Teams, and asked the reasonable question: can our sales dashboard look like that? Two abandoned workarounds later, the answer was still no.
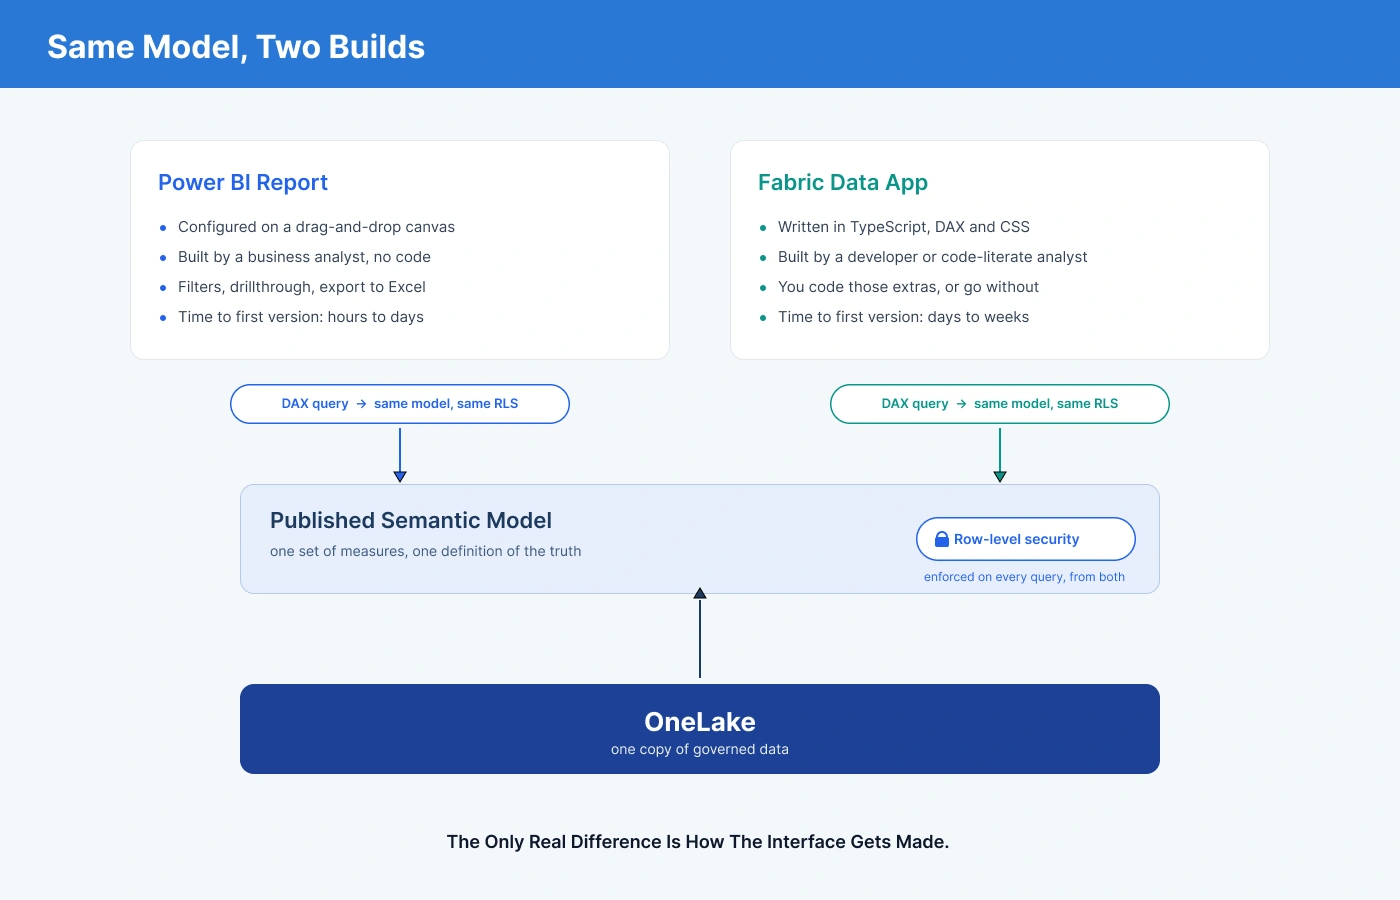
So here's the short version, up front. A Power BI report and a Fabric data app both read from the same governed semantic model. A report is configured on a drag-and-drop canvas by an analyst. A data app is written in code, with no ceiling on how it looks or behaves. Fabric Data Apps vs Power BI Reports is not a platform debate. It's a build choice on the same data, and this article gives you a framework to settle it in minutes, including the many cases where the honest answer is to keep it a report.
First, Clear the Confusion: Platform vs Tool vs Build Choice
Search for this topic, and most results answer something else. Seven of the top ten explain Microsoft Fabric vs Power BI, which is a platform versus tool comparison. Fabric is the platform. Power BI is the reporting workload inside it. That's it, and we can move on.
Your question is narrower: once the data is already modeled in Fabric, what do you build on top of it? That's the Power BI report vs app question, and the two options are far more alike than the comparison posts suggest. Both query the same published semantic model in OneLake. Both respect the same row-level security. Neither one is "the platform." The only real difference is how the interface gets made.
It matters more now that Fabric is mainstream. On Microsoft's Q2 FY2026 earnings call, Satya Nadella confirmed Fabric had passed a $2 billion annual revenue run rate with more than 31,000 customers, growing 60% year over year. Many teams reading this already own the capacity. Their decision isn't whether to adopt Fabric. It's what to build with it.
The most common evaluation mistake we see at NeenOpal is teams comparing the platform to the tool for weeks, then never deciding what to build, which is exactly where our Microsoft Fabric consulting services help teams land the decision and ship it.
Fabric Data Apps vs Power BI Reports is the decision that ships something. New to the capability itself? Our Fabric Apps complete guide covers what they are and how they're built, and this article assumes that foundation.
Practical takeaway for BI leads: if a deck or a blog is comparing Fabric to Power BI, it isn't answering your question. Yours is a build choice.
Power BI Reports: What They're Still the Right Answer For
Start here, because this is where most requirements should end.
A Power BI report gets built by a business analyst who understands the business, on a canvas, without a line of code. It ships in days. Row-level security comes from the model. Filters, bookmarks, drillthrough, and export to Excel are already there and already tested. Your team knows how to use it, governance knows how to review it, and the service desk knows how to support it.
That's not a consolation prize. It's why reports still carry the overwhelming majority of enterprise analytics and why any Fabric Data Apps vs Power BI Reports comparison that treats reports as legacy has lost the plot.
Yes, the canvas has limits. It's supposed to. Constraints are what make reports consistent, cheap to serve, and safe to hand to someone who has never opened a code editor. When people frame Fabric Apps vs Power BI as reports being outdated, they've stopped valuing the thing that made reports work.
There's a harder truth behind the debate, too. A data.world survey found that while 88% of organizations want decisions to run on data, only 35% can actually deliver.That gap is rarely about pixel-perfect visuals. It's about trust, clarity, and whether anyone acts on what they see. A prettier interface won't fix a report nobody believes.
Practical takeaway for BI leads: if your report is underused, diagnose why before assuming the answer is a fancier build.
Fabric Data Apps: When the Report Canvas Ceiling Is Genuinely Hit
So what is a Fabric data app? It's a web application that lives inside your Fabric workspace and queries your existing semantic model. You build the interface yourself: TypeScript components for the screens, query files for the DAX, a style sheet for the look, deployed with the Rayfin command-line tool. You build a web app on Microsoft Fabric without setting up hosting of your own.
What you get for that effort is no visual ceiling. If a chart type doesn't exist in Power BI, you build it. If the interaction you want isn't a slicer, you write it.
Visualization as code (plastic bricks versus a 3D printer)
The clearest way to frame the Fabric data app vs Power BI report choice: a report is plastic building bricks, a data app is a 3D printer. Bricks are fast and predictable, but you're limited to the shapes in the box. A 3D printer makes any shape you can specify, as long as someone can specify it. That's visualization as code in one sentence.
Libraries like D3, Vega-Lite, and Recharts give you the vocabulary, and a coded app can also call Fabric user data functions, hit external APIs, and hold state across a session. That's where the interesting Fabric Apps use cases live: genuinely new experiences, not nicer-looking old ones.
Governance parity: security is inherited, not rebuilt
The fear I hear most is that code weakens security. It doesn't. A data app sends DAX to the Fabric Apps semantic model through Fabric's query API, and the model enforces row-level security on every query, exactly as it does for a report. You don't reimplement permissions. You inherit them.
It's worth stating plainly because it removes the objection most likely to stall a Fabric Data Apps vs Power BI Reports review. Here's how the two compare on what actually decides projects.
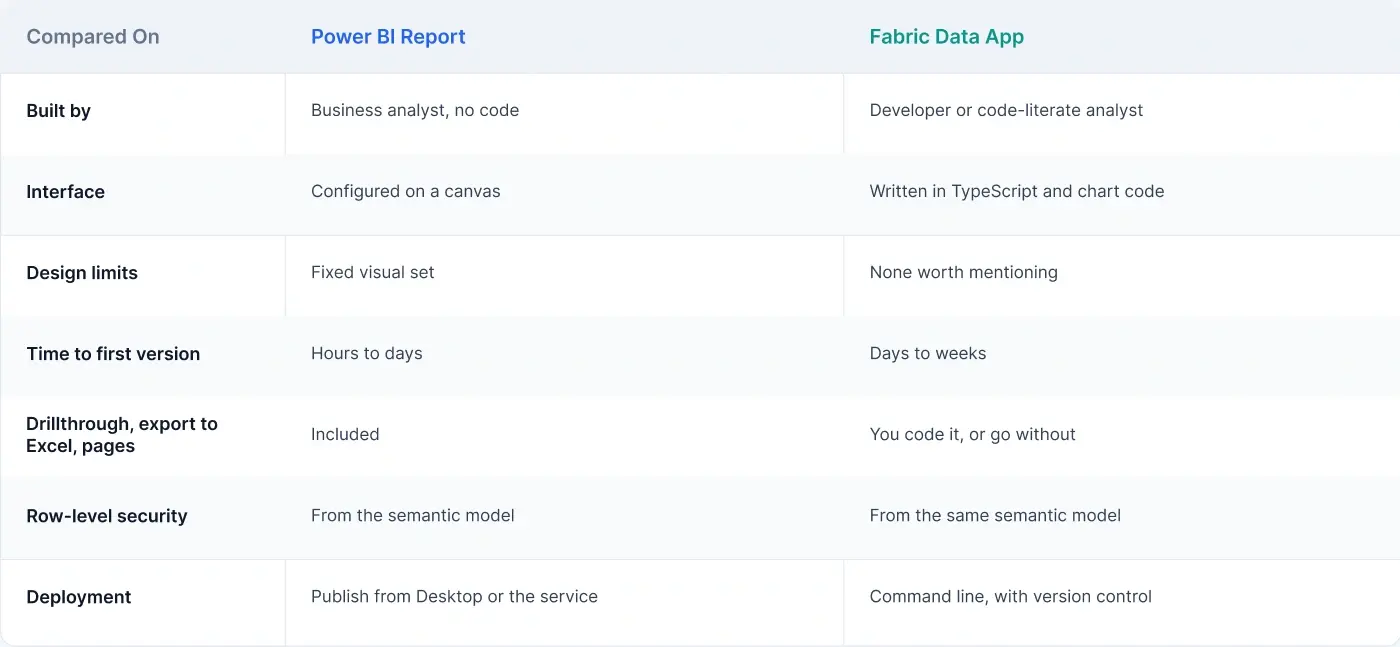
Read that fifth row twice. It's where teams get caught: everything a report gives you for free has to be built and maintained in an app, and someone will ask for an export to Excel on day one.
One real requirement where the report canvas hit a hard ceiling and an app was justified. Include what was tried on the canvas first and why it failed.
- Senior Fabric and Power BI Architect
Practical takeaway for BI leads: in Fabric Data Apps vs Power BI Reports, an app should be something a requirement forced on you, not something you picked because it sounded modern.
Operational Apps: When You Need to Store and Write Data
Here's the option almost every comparison forgets, and it breaks the debate open.
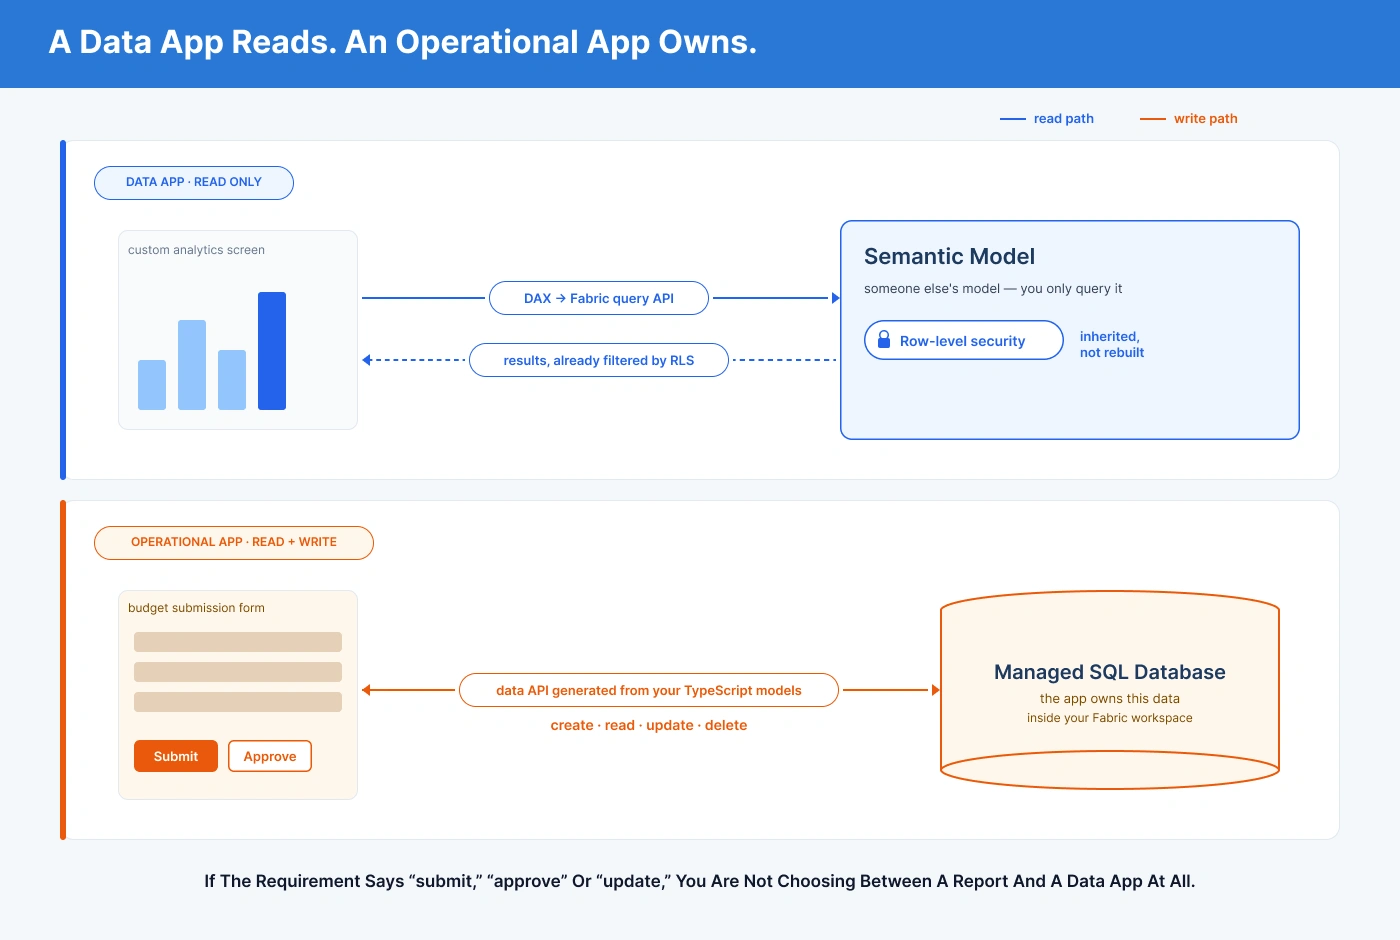
Not every request is an analytic. Sometimes the business doesn't want to look at data, it wants to enter it, approve it, or correct it. A budget submission. A data quality exception queue. A pricing approval trail. Those are tools, not reports, and no amount of design freedom on a read-only screen will satisfy them.
That's what an operational app is for. It comes with its own managed SQL database and a data API generated from your TypeScript data models, so it can create, read, update, and delete records rather than only query someone else's. The Fabric operational app vs data app distinction is simple once you see it: a data app reads a model you already have; an operational app owns data of its own. If Fabric Apps write-back is the requirement, this is the route.
This is also where Fabric Data Apps vs Power BI Reports becomes a build versus buy conversation. Plenty of organizations buy a separate SaaS product for exactly these small internal tools, then spend months integrating it back to the warehouse the data came from. Building on governed fabric data removes that round trip. Sometimes that's the right call. Sometimes the SaaS product is still cheaper than owning software.
Practical takeaway for BI leads: if the requirement contains "submit," "approve," or "update," you aren't choosing between a report and a data app at all.
The Cost and Licensing Reality Nobody Quantifies
Every article will tell you Fabric Apps need no new licence. True and misleading.
Ask which kind of app first, because the two bill differently. A data app has no database of its own. An operational app provisions one. That difference drives the Fabric Apps cost gap.
A Power BI report draws capacity mainly when someone opens it, and a data app behaves much the same. You pay storage in OneLake and then capacity when the page loads and each time an interaction fetches data. The difference is that a report leans on the engine's own caching and query optimization, while an app sends whatever queries its developer wrote. Built carelessly, it can fire three times the queries of the report it replaced. That behavior is yours to own now.
An operational app is the one to watch. Its API bills only for the reads and writes the app makes, falling to zero when nobody uses it. The SQL side stays warm about fifteen minutes after the last activity so the app feels responsive, then releases. Storage bills throughout. An idle operational app isn't draining capacity, but it carries a short tail that a data app never has.
Both land in the same place. Idle is cheap, used is not, and an app with live interaction and write-back generates steadier traffic than a report. That is the part of Fabric Data Apps vs Power BI Reports nobody budgets for.
On licensing, below F64 capacity, viewers need a Pro or Premium Per User seat; at F64 and above, a free license with the Viewer role is enough. Microsoft hasn't published whether Fabric Apps inherit that rule, so test it in your own tenant before promising procurement a number. Confident Fabric Apps licensing figures today are guesses.
Model the concurrency, not the build. Open the Capacity Metrics app during the first pilot, not after launch, and learn your Fabric capacity consumption pattern before a hundred people get the link. An app that felt free with five users behaves differently with five hundred.
Practical takeaway for BI leads: "no new license" is a licensing statement, not a cost one. Size for concurrency, not for the demo.
Every idea from your manager survived: the split by app type, the query-traffic control point, the GraphQL API dropping to zero, the fifteen-minute warm tail, storage billing throughout, the F64 threshold in both directions, and "size for concurrency, not for the demo.
Skills, Team and Governance: The Real Cost of Going Code First
This is the part that decides most projects, and it has nothing to do with features.
A report needs an analyst. An app needs an analyst plus someone who can read code. Not a full engineering team, and AI coding assistants genuinely do write most of the first version now, which is exactly why the trap is easy to fall into. The demo works. The scaffolding appears in minutes. Then a chart renders wrong for one region, or numbers go stale after a model refresh, and the agent confidently produces three fixes that don't work. At that point you need a human who can read the code and reason about it. Without one, you don't have an app. You have a liability with a nice interface.
An app needs the habits of a software team. Someone reviews the code before it goes live. Changes go through a release process, not one person clicking publish in Power BI Desktop. That is extra work a report never asked for. Count it in your Fabric Data Apps vs Power BI Reports comparison, because a feature list never shows it.
One thing to check before committing to code: AI-assisted analytics often absorbs the ad hoc demand that pushes teams towards custom builds. See whether Copilot on an existing report already answers the question being asked.
Practical takeaway for BI leads: name the person who will debug this app in eighteen months. If you can't, choose the report.
Preview Gating: When to Wait, Not Build
Capability isn't the constraint in 2026. Maturity is.
Fabric Apps preview status brings real limits worth planning around. Access runs through Microsoft Entra ID, so external users are out, which rules out anything customer-facing. Working with local data during development has limits that make the build loop slower than web developers expect. Options for external integrations and secret handling are still restricted. And conventions may change before general availability, so some of what you write now gets rewritten later.
None of that means don't touch it. Learning this properly ahead of general availability is a genuine advantage, and the teams piloting now are the ones who will know where the edges sit. It does mean scoping the pilot deliberately. Pick an internal audience. Avoid anything needing external sharing or unusual integrations. Choose a requirement where the value survives a rebuild, and treat rework as tuition rather than failure.
Read this the right way round. Those Fabric Apps limitations change the timing of a Fabric Data Apps vs Power BI Reports decision, not the logic of it.
Practical takeaway for BI leads: pilot to build know-how, not to deliver a flagship. Save the flagship for general availability.
The Decision Framework: Report, Data App, Operational App, or Neither
Here's the whole thing on one page. Match the need, not the technology.
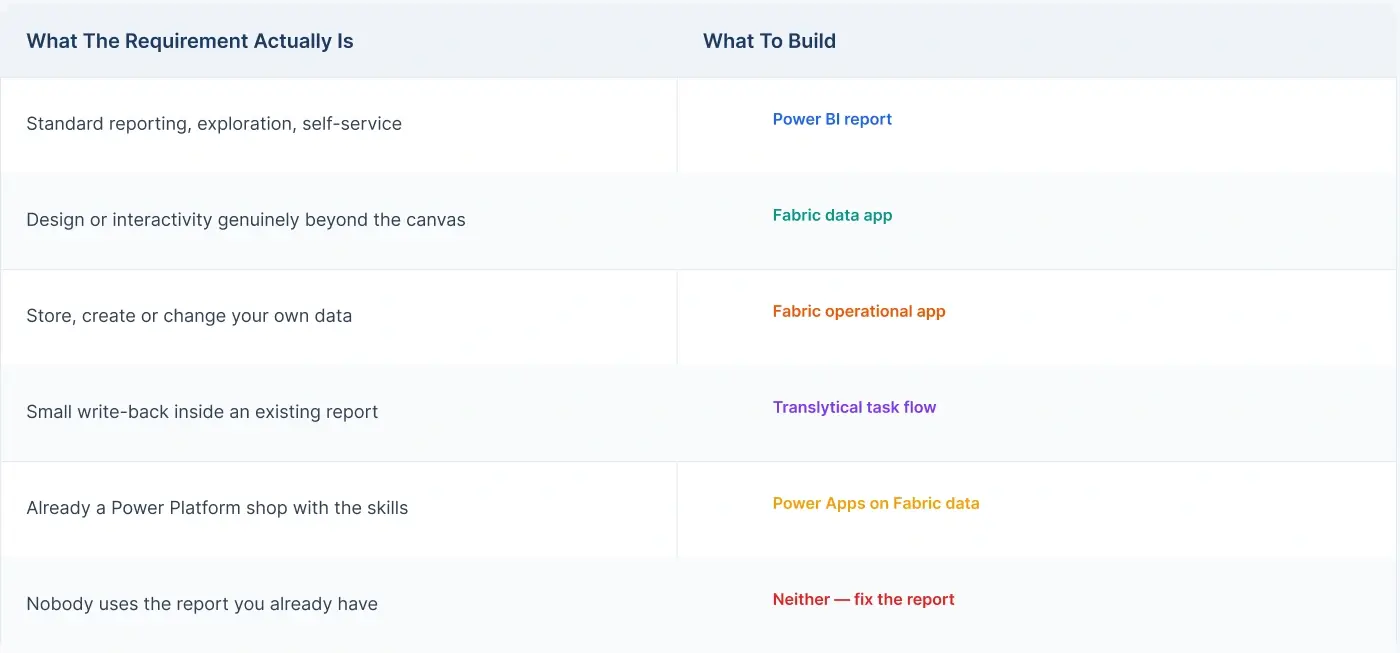
Two rows deserve emphasis because people skip them. A translytical task flow is the lightest escalation available, letting a user trigger a write-back from inside a Power BI report without building anything resembling an application. And if your organization already runs on Power Platform, Power Apps vs Fabric Apps may land on Power Apps, simply because the skills are already in the building.
So when to use Fabric Apps? When you've honestly tried the canvas, the requirement still isn't met, and you have someone who can maintain code. That's the bar. Read the data app vs report Microsoft Fabric choice as a build-your-own-report decision, because that's what it is: unlimited design freedom bought with real engineering effort.
As for when not to use Fabric Apps, the answer is most of the time, and that isn't a criticism of the technology. Most teams are one honest requirements review away from settling on Fabric Data Apps vs Power BI Reports, and the answer is usually the report.
Practical takeaway for BI leads: default to the report, escalate deliberately, and document why you escalated.
Before you commit, pressure-test the requirement
Weighing a Fabric Apps investment? Before you pick a report, data app, or operational app, talk to our Fabric and Power BI architects. We'll pressure-test the requirement, forecast the capacity cost, and give you a straight build recommendation, including "keep it a report" when that's the right call. It's the fastest way to settle Fabric Data Apps vs Power BI reports for your specific case. Book a consult or explore our Power BI solutions.
Frequently Asked Questions
1. Do Fabric Apps replace Power BI reports?
No. In Fabric Data Apps vs Power BI Reports, reports remain the right tool for the large majority of analytics work, and apps complement them for the cases a canvas can't handle. Any "goodbye reports" framing you read is overstated.
2. What's the difference between a Fabric data app and a Power BI report?
Both query the same governed semantic model. A report is configured on a no-code canvas, while a data app is written in code with a fully custom interface. Row-level security is enforced identically on both, so in Fabric Data Apps vs Power BI Reports the difference is the build method and the interface, not the data or the security.
3. How much do Fabric Apps cost?
There's no new license. Apps run on your existing Fabric capacity and bill as capacity consumption, and viewers may still need a Pro or Premium per-user seat depending on capacity size. App-specific per-user licensing was not finalized during preview, so verify in your own tenant.
4. Can a business analyst build a Fabric data app?
Partly. AI assistance lets a data-literate person get most of the way there, but a team still needs at least one person who can read and debug code when the agent can't. A Power BI report needs no such anchor.
5. What is an operational app in Microsoft Fabric?
A Fabric app with its own managed SQL database and a generated data API, built for tools, forms, and workflows that store and change data. It differs from a data app, which only queries a semantic model you already have.
6. Is Microsoft Fabric the same as Power BI?
No. Fabric is the platform, and Power BI is the reporting and visualization workload within it. That's a separate question from the Fabric Data Apps vs Power BI Reports build choice covered here.
7. What are the limitations of Fabric Apps?
It's still in preview. There's no external user access, local data development has limits, external integration and secret options are restricted, and conventions may change before general availability. Plan pilots around these gaps rather than through them.

