Ask a Power BI delivery team what actually breaks their projects, and you'll rarely hear about the technology. In our experience, a Power BI implementation rarely fails because of the build itself. The closest call we've seen came from a requirement nobody said out loud, discovered only after development was already done.
This guide is about avoiding that gap. Not how to build in Power BI Desktop, but how to sequence, time, and budget the work so a missed requirement never turns into a rebuild. Here's the six-phase Power BI implementation process as it actually plays out on client projects, the formula behind your timeline, the real cost structure, and the questions worth asking before you choose a Power BI implementation partner.
What Power BI implementation actually means (and how it differs from migration)
Power BI implementation means building new reporting from business logic that hasn't existed before. Migration means reproducing reporting that already exists in another tool, like Tableau or Qlik. Buyers routinely blur the two. As a result, three different buyers can say the identical sentence, "we want to implement Power BI," and mean three different projects.
- Net-new build – starting from business logic nobody has reported on before.
- Excel replacement– where the real work is reverse-engineering spreadsheet logic nobody documented.
- Tableau or Qlik migration – where users have already anchored on a report they expect the new one to resemble.
Get the scoping wrong here, and you’ve made the first requirement failure on call one.
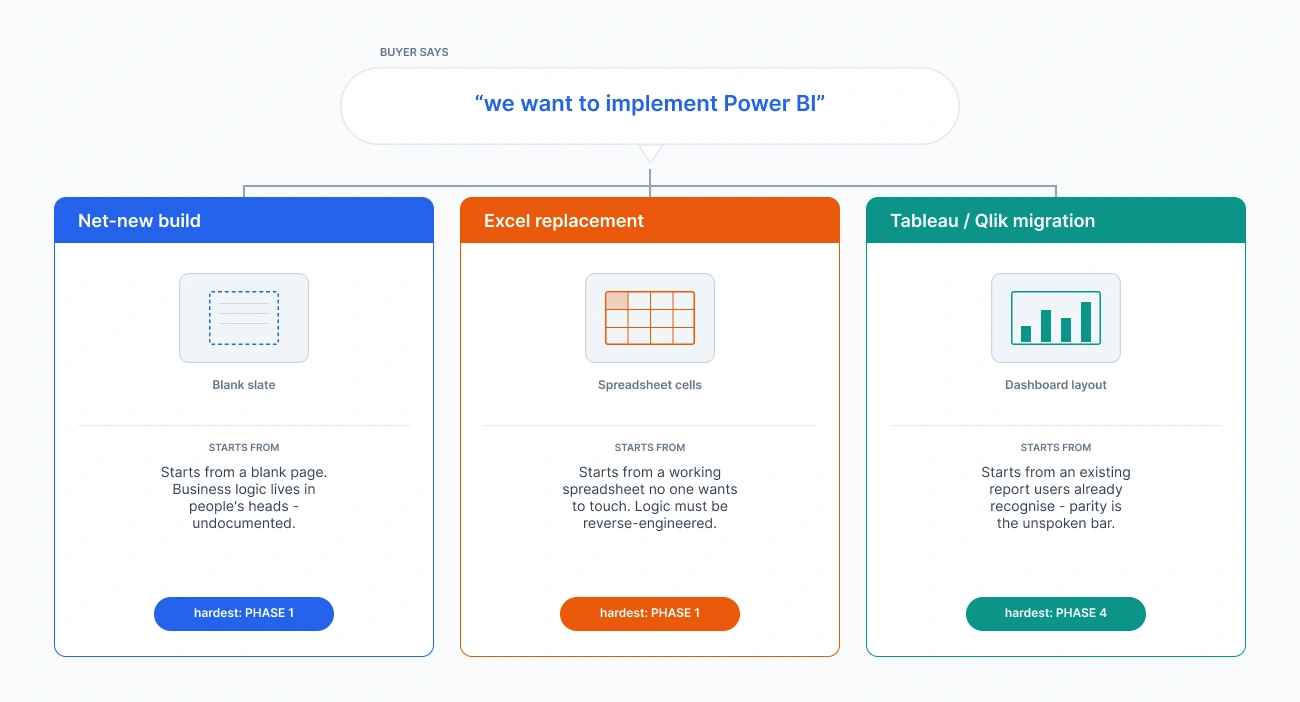
This distinction is usually clear from the delivery side once scoping starts. Clients are the ones who arrive already blending the three together, and separating them is a part of the partner's job.
Power BI Implementation vs migration vs Excel replacement
| Aspects |
Net-new build |
Excel replacement |
Tool migration (Tableau/Qlik) |
|
Starting point |
Undocumented business logic |
Spreadsheet logic that must be reverse-engineered |
An existing report users expect to recognise |
|
Hardest phase |
Requirement gathering |
Requirement gathering |
Report development (visual parity) |
|
Main risk |
Scope creep from undefined logic |
Formulas nobody can explain get lost in translation |
Unstated parity expectations |
|
Typical duration driver |
Requirement complexity |
Logic reconstruction |
Visual and structural parity |
Most resources on this topic sell both migration and net-new builds, which is precisely why none of them draw this line clearly. As a result, only a few know the two projects need different discovery conversations.
The disambiguation test
Two questions settle it:
- What does the reporting look like today, Excel, a legacy BI tool, or nothing at all?
- And is there an existing report anyone expects the new one to resemble?
Almost nobody asks that second question before scoping starts, and it’s the one that comes back later as an unstated requirement.
The 6-phase Power BI implementation process
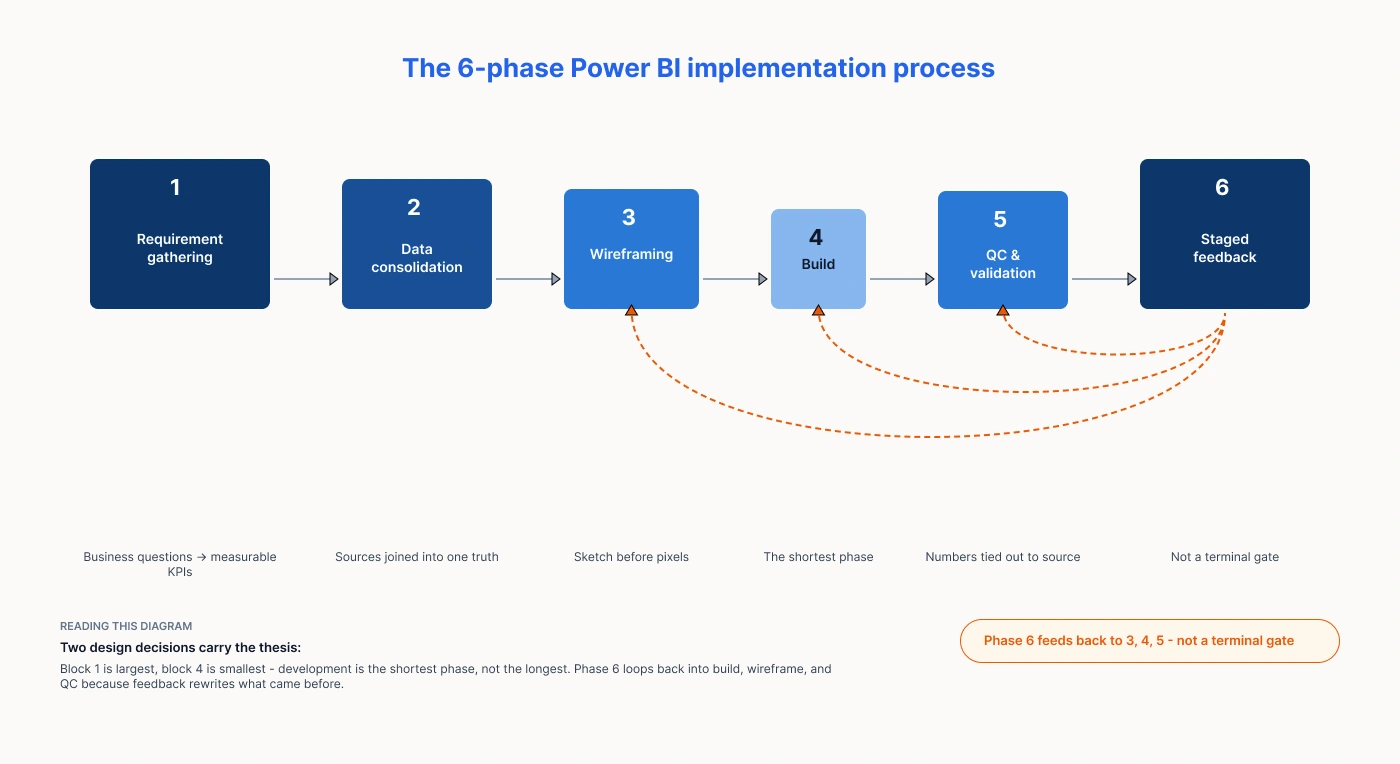
The six phases below are the Power BI implementation steps as they actually run on client engagements. This isn't a fixed 90-day timeline, and it isn't the 14-area governance taxonomy already covered in Microsoft's own documentation. It's simply the sequence these phases follow in practice.
- Requirement gathering– establishing the business logic, not collecting a chart list
- Data consolidation – unifying sources that were never designed to reconcile
- Wireframing – sometimes client-supplied, sometimes ours
- Report development – visuals and model relationships, built together
- QC and number validation – reconciling report output against source
- Staged client feedback – distributed through the build, not saved for the end
Phase 1 — Requirement gathering
This phase establishes what the business needs to achieve and the logic underneath. It goes deeper than simply listing out the charts or dashboards someone wants to see." As Aashay Mehta, part of NeenOpal’s Power BI delivery team, put it:
“Clients really want to get through to the last output stage, i.e. the reports or the dashboards.”
That pull toward the finish line is exactly why requirement gathering is the phase clients most often compress and compression here is where every later failure mode in this article originates.
Phase 2 — Data consolidation
Once the requirement is fixed, the work shifts to unifying disparate sources into a single model. The real difficulty is rarely volume, it is source structures that were never designed to reconcile with each other. This is the hardest technical phase of a typical engagement, and we return to it in detail below.
Phase 3 — Wireframing
Wireframing matters because it's where the shape of the report gets locked in before development starts. It's the bridge between what was agreed on paper and what actually gets built. It's not always ours to do; sometimes the client already has a wireframe ready. When a client supplies both the wireframe and the underlying logic, the whole engagement can wrap up in one to two weeks, because most of that groundwork is already done before we even start.
Phase 4 — Report development
Visuals and model relationships get built together, and how long this takes depends on what the report has to do. A straightforward report over a clean model moves quickly. Complex model logic, heavy DAX, or visuals that need custom work can make this one of the longer phases in an engagement, and report count scales it at minimum linearly.
What phases 1 and 2 change is not the length of this phase, but how much of it gets done twice. When the requirement and the model are settled going in, development runs once. When they aren't, this is where that surfaces. Once live, most ongoing effort shifts to refresh and distribution, covered separately in our guide to Power BI automation.
Phase 5 — QC and number validation
Validation here means reconciling the numbers on the finished report against the source system, not just checking that the visuals render cleanly.
This phase carries disproportionate weight because of what happens when it is rushed. If a business user is the one who finds a figure that doesn't match the source after the report is live, the cost is never just the fix. It is the credibility of every other number on the page. Once a stakeholder has a reason to doubt one figure, they start checking the others by hand, which fails at its purpose, however well it was built.
Phase 6 — Staged client feedback
Feedback in a well-run engagement is a loop distributed through development, not a single terminal gate at the end.
“We take feedback in between, at different stages of development, so clients can see the progress and review the look and functionality of the visuals before a change ends up affecting every other element in the report," - Aashay Mehta explained.
That single structural choice, checkpoints instead of a final reveal, is what turns a misunderstanding into a quick revision instead of a rebuild.
Why Power BI implementations fail, and it is not the technology
“In our experience, requirement gathering and proper communication have been a gap and have led to unwanted results,”
– says Preetibarna Panda, who has led Power BI delivery and escalation work across NeenOpal’s client engagements.
Most conversations about Power BI failure point to governance, licensing, dashboard delays, or weak adoption. However, all these causes tend to surface in phase 4 or later. Even Gartner projects that 80% of data and analytics governance initiatives will fail by 2027 for lack of a real business driver, and its analysts are blunt about the mechanism: a governance programme that does not enable prioritised business outcomes fails.
But in our delivery experience, governance failure is usually a downstream symptom, not the root cause. The root cause sits one phase earlier, when a requirement that was never stated clearly is discovered only once the build is finished.
The Requirement Debt Model
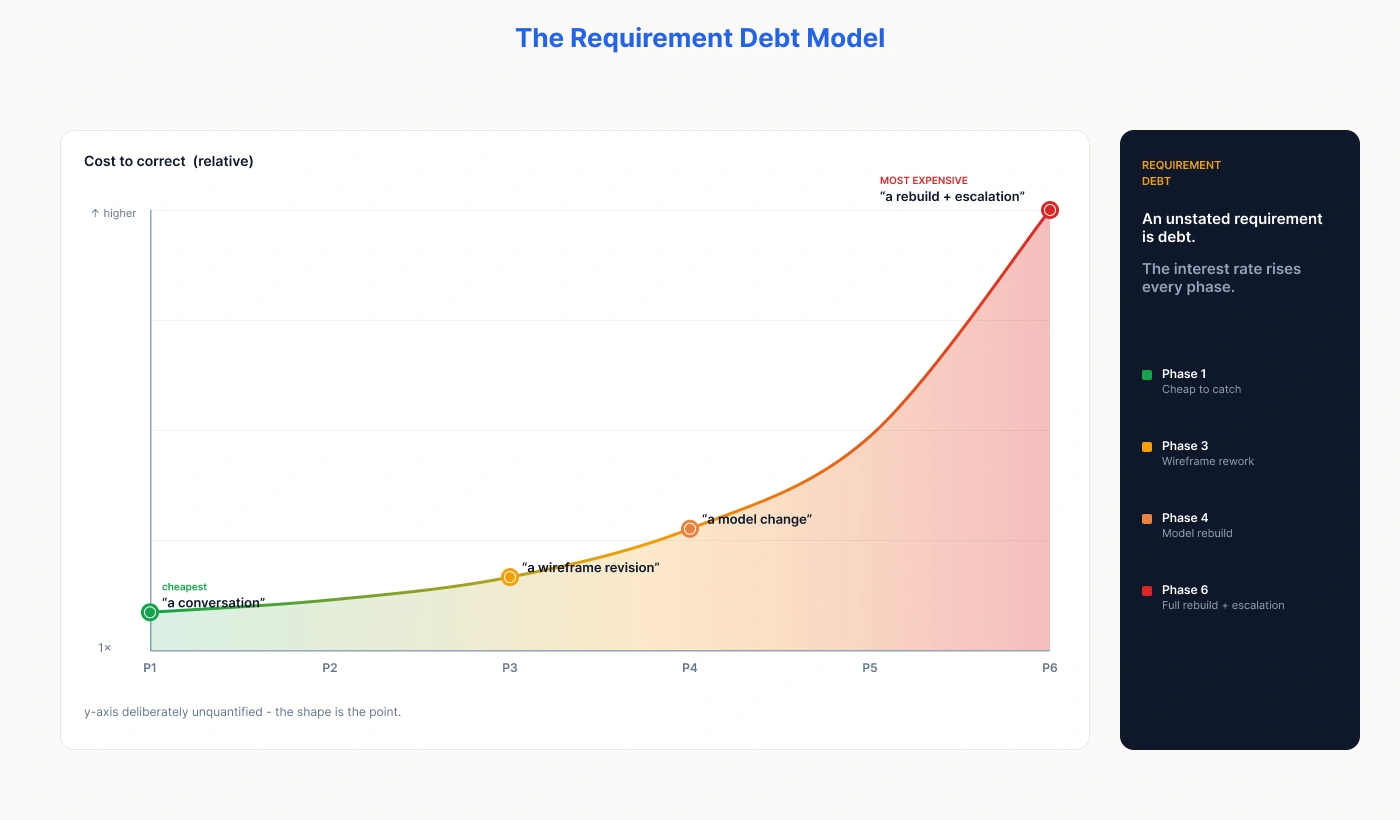
Think of an unstated requirement as debt drawn at the start of a project. The interest rate rises with every phase it survives undetected. Clarified in phase 1, it costs a conversation. Surfacing in phase 3, it costs a wireframe revision. Surviving into phase 4, it costs a model change. Discovered only in phase 6, it costs a rebuild and, as the case below shows, an escalation.
The mechanism is specific, not abstract.
“Something might not be communicated as efficiently, which might cause the entire logic to break,” - Aashay Mehta said.
The team ends up running root-cause analysis on logic that was never actually wrong. It was correctly answering a question nobody had asked.
Real Case: the Tableau-parity failure
One client’s requirement, in Preetibarna Panda’s words, was straightforward on the surface:
“They required that they have a Tableau report and they want the Power BI report to look exactly like the Tableau report. And that is something that was not clear to us.”
Here is how that unstated expectation played out. Some Tableau visuals have no direct Power BI equivalent, so the team substituted different logic to approximate the same output. That substitution was never explicitly signed off by the client, because it had never been surfaced as a decision in the first place. The first draft landed with harsh feedback. An escalation lead was brought in and rebuilt the report for parity. No moral, no recovery narrative, just the cost of a requirement that stayed undetected two phases too long.
What’s the Power BI implementation timeline
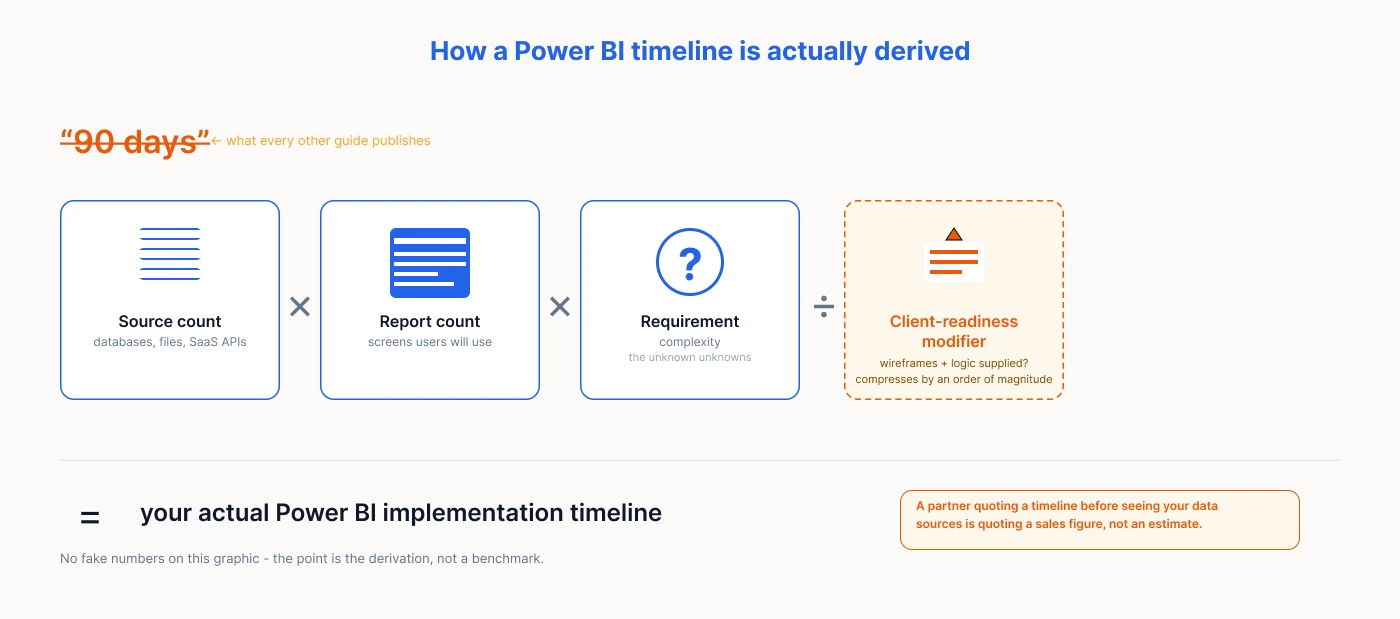
Most online sources answering this question publish a fixed range, like "90 days," "first 100 days," or "12 to 20 weeks," without showing how they arrived at it. Any partner quoting a Power BI implementation timeline before seeing your data sources is quoting a sales figure, not an estimate.
The three variables that set your timeline
Duration is a function of three inputs, multiplied together, plus one modifier that most published playbooks skip entirely.
|
Variable |
What it measures |
Why it matters |
|
Source count |
Number of systems feeding the model |
Each additional source adds reconciliation work in phase 2 |
|
Report/screen count |
Number of distinct outputs required |
Scales development and validation linearly at minimum |
|
Requirement complexity |
How well-defined the underlying logic is |
The single largest swing factor in the formula |
|
Client-readiness modifier |
Whether wireframes and logic are client-supplied |
Can compress an engagement by an order of magnitude |
Two clients, same sector, 4× the timeline
Two clients in the same education-sector vertical illustrate why industry benchmarks are close to meaningless for scoping your own project. One delivered end-to-end in one to two weeks, because the client supplied wireframes and pre-defined logic going in.
The other exceeded a month for a single report, because sources needed consolidation and the underlying logic had to be defined from scratch. Same industry, same partner, a fourfold difference in duration as scale and requirement clarity set the number.
What a Power BI implementation costs: the two-track model
A Power BI implementation really has two separate costs, and they behave very differently.
Services scale with effort. The more work involved, the higher the bill.
Infrastructure is different. It scales with your data volume and number of users, and it renews every year. This is usually the cost that catches finance teams off guard in year two.
| Question |
Track 1 — SERVICES |
Track 2 — INFRASTRUCTURE |
|
What drives it |
Effort estimated from the gathered requirements |
Measured data volume and consumer/developer license split |
|
When it’s priced |
After requirement gathering, before development starts |
At requirement-gathering stage, sized to actual data |
|
How it recurs |
One-off per engagement or phase |
Annually, as a capacity subscription |
Track 1 — Services, billed hourly
Effort is estimated from the requirements actually gathered, shared in phases, and signed off before a single report gets built. The sequencing matters as much as the number: no development starts without an effort estimate the client has approved.
Track 2 — Infrastructure, sized to your data
Capacity is sized against measured data volume, never against headcount or ambition. Microsoft’s Fabric capacity SKUs run from F2 up through F128 and well beyond, and the license mix splits between developers who author content and the far larger population who only consume it, projected across a full year. This sizing decision happens at the requirement-gathering stage, which is one more reason phase 1 carries so much weight.
The F64 threshold: where Power BI sharing costs shift
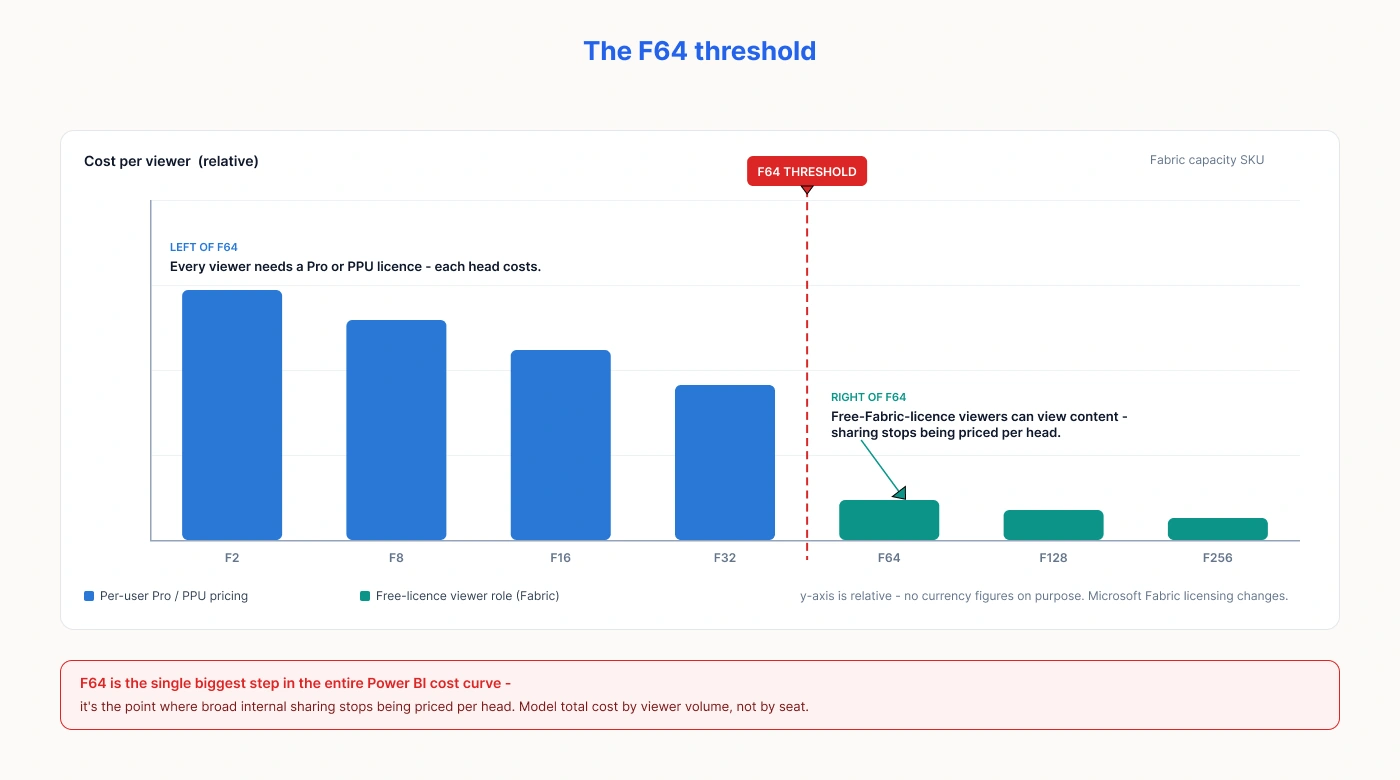
F64 is the specific benchmark documented in Microsoft’s own Fabric licensing reference: on F64 capacity or larger, users holding only a free Fabric license can view Power BI content in a viewer role. Below F64, every viewer needs an individual Pro or PPU license. That single threshold is the largest single step in the entire cost curve, because it is the point where broad internal sharing stops being priced per head.
Whether your sharing requirement can actually be met below F64 is a question to answer before you buy, and it is exactly the question our pre-proposal process below is built to settle.
The enterprise wall: where the standard process breaks
None of the three constraints below are limitations of Power BI itself. All three are consequences of what already exists in a client’s data and vendor estate, which is precisely why a partner who only sells building skill never sees them coming.
1. Sources never designed to reconcile
Consolidation is where the real technical difficulty concentrates, not development. Client source systems were built years apart, by different teams, for different purposes, and they rarely agree on what a customer ID means or what counts as one reporting period. Reconciling that mismatch is where engineering hours actually go. It is also usually where an unclear phase 1 definition first becomes visible, once two systems are sitting side by side and disagreeing.
2. Visual parity limits in migration
Visual parity is a second, separate wall, especially in Power BI to Tableau migration. Tableau and Qlik both have visuals with no direct Power BI counterpart. When a migration substitutes different logic to get close to the same look, that is a design call that needs to be surfaced and signed off, not built in quietly and found during review. The Tableau-parity case above is what happens when that sign-off step gets skipped.
3. Commitments made before verifying
The third wall is a partner-side failure mode, and it is worth naming bluntly. A capability gets agreed to in the sales conversation, promised without validation, and discovered infeasible mid-build. Telling a client something is possible before proving it is the most expensive form of requirement debt a partner can create. Reversing it mid-implementation costs the relationship, not just the sprint.
Most of the cost in a Power BI implementation is decided before anyone even opens the tool. It comes down to three things: how well your data sources fit together, how much capacity you actually need, and how clearly the requirement was defined upfront.
We've seen this play out across enterprise and mid-market projects, including migrations where matching the look of an old report turned out to be the real, unspoken requirement.
If you're scoping a Power BI implementation and want these questions checked before you commit budget, we can do that in a single call.
Pressure-test your implementation scope →
How to evaluate a Power BI implementation partner
You cannot assess Power BI build skills from a sales call, as every credible partner has them. What you can assess is whether a partner will refuse to start building on an ambiguous requirement, and whether they prove feasibility before promising it. That reframing, more than any feature comparison, is what should drive your Power BI implementation partner shortlist. The same evaluation lens applies not only to Power BI but also to broader business intelligence consulting engagements.
Five questions to ask before you sign
- How do you handle a requirement that changes mid-build? A partner who says it does not happen has not run enough projects to have seen it.
- What does your requirement sign-off look like before development starts? If the answer is a verbal go-ahead rather than a documented, phased sign-off, the requirement debt clock is already running.
- Can you show a case where you proved feasibility before proposing, rather than assuming it? Silence to this question is itself an answer.
- How do you validate numbers against source before calling a report done? “The visuals render correctly” is not the same claim as “the numbers reconcile.”
- When do you collect feedback during the build? Is it once at the end, or at staged checkpoints? End-loaded feedback is the industry default, and it is the default this article argues against.
The pre-proposal POC test
“We do a thorough feasibility check of the solution we are proposing, and a small POC on our internal systems or on sample data, so that we are fully sure the solution works,” Aashay Mehta says.
In one live example, a prospect needed to distribute Power BI reports to external users. Rather than assume the answer, the team validated whether PDF or email delivery was achievable below F64 capacity, ran a proof of concept internally, and only then proposed what had already been proven. Ask any prospective partner for a comparable case of their own, proving feasibility before promising it, not after.
A measured Power BI implementation outcome
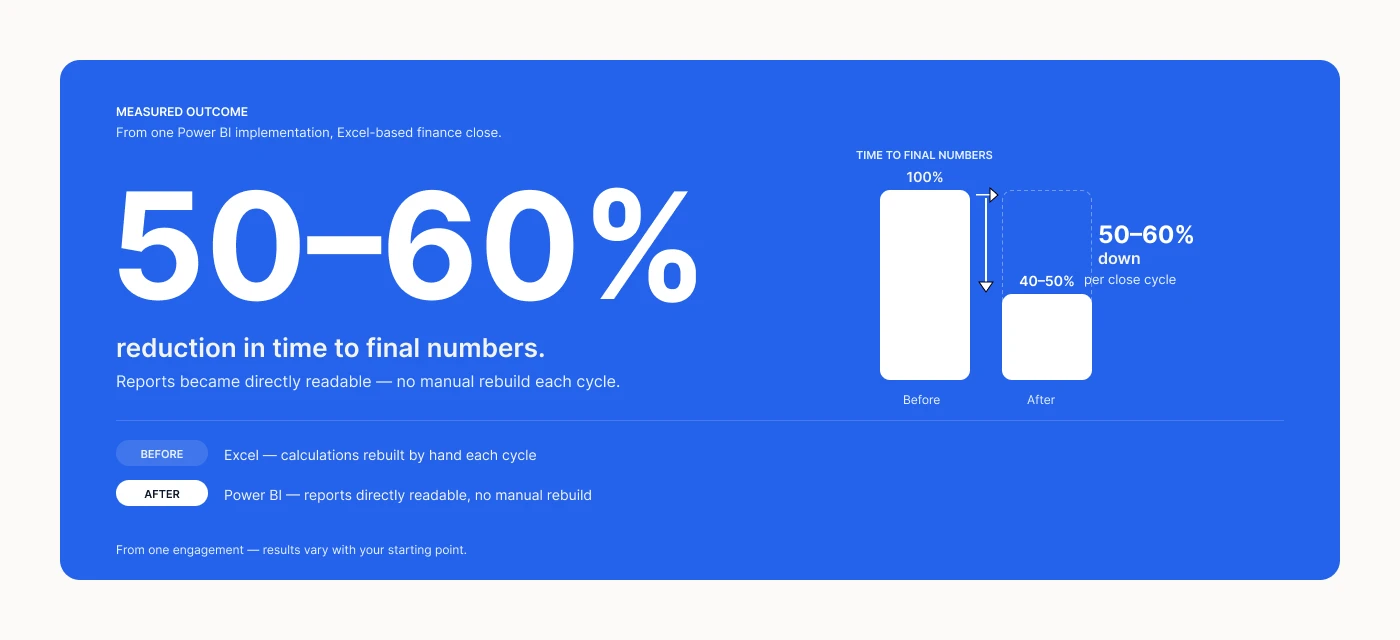
Before one engagement, the client ran everything through Excel, rebuilding the same calculations by hand each cycle. After the Power BI implementation, time to final numbers dropped 50–60%, since reports became directly readable.
That's from one engagement, so results vary with your starting point.
Want it settled before you commit?
A 45-minute scoping call gets you a phased effort view either way.
Book a Power BI scoping call →
Frequently asked questions
1. How long does a Power BI implementation take?
Anywhere from one to two weeks, where the client supplies wireframes and defined logic, to over a month for a single report on a multi-source build with undefined requirements. Duration is set by source count, report count, and requirement complexity.
2. Can Power BI reproduce a Tableau report exactly?
Not always. Some Tableau visuals have no direct Power BI equivalent, and the substitute logic used to approximate them changes what the report actually says. That substitution needs to be explicitly signed off, or the first draft is likely to fail review.
3. What Fabric capacity do I need for Power BI?
Size against measured data volume, not headcount, across the F-SKU range. F64 is the documented benchmark that allows free-license viewers to access content in a viewer role; whether your sharing requirement is achievable below that threshold is worth proving before you buy.
4. When should feedback happen during a Power BI build?
At staged checkpoints during development, not once at the end. End-loaded feedback means a fundamental misunderstanding only surfaces after the full build is complete, when correcting it costs a rebuild rather than a revision.