Embedded analytics for SaaS, where you add dashboards and data exploration directly into an existing workflow, sounds straightforward until someone asks: Should we build this ourselves or buy a platform?
Most resources on the Embedded Analytics Build vs Buy topic answer that with a comparison table and a vendor recommendation. That's a useful starting point, but it addresses a narrower version of the question than the one that actually determines success.
This guide covers the honest cost model, the scale thresholds others skip, and what your product needs in place before analytics can become a paid module.
The Build vs. Buy Question Is Framed Wrong
Embedded analytics build vs buy is not a binary decision; it's a layer-by-layer one. The question isn't whether to build or buy, but which layers to develop in-house versus license from a platform.
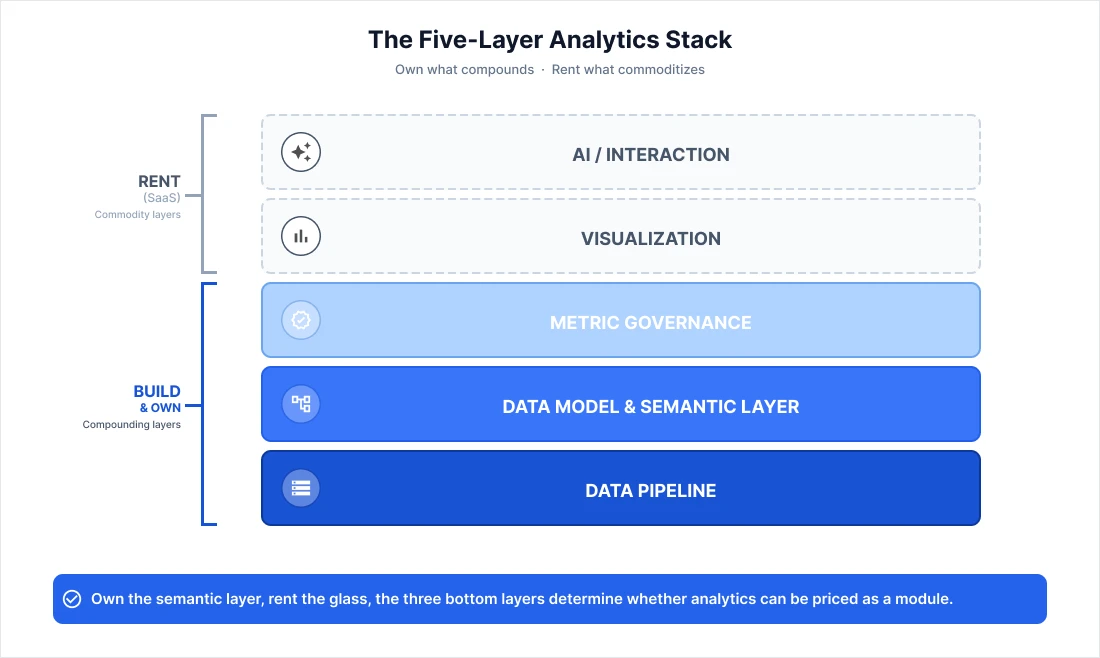
That distinction is the entire point because a production-embedded analytics capability has five layers: data pipeline, data model and semantic layer, metric governance, visualization, and AI/interaction. The "build vs. buy" framing treats all five as a single decision. They are not. Each layer has different commoditization dynamics, maintenance economics, and consequences for whether your analytics capability can ever generate revenue.
Despite that, most resources on embedded analytics cost are reverse-engineered from their publisher’s pricing models, which is roughly equivalent to asking a car dealer whether you should buy or lease. The answer is structurally predetermined.
Our position on Embedded analytics: build vs buy Is this – own the semantic layer, rent the glass.
The visualization layer – chart rendering, dashboard layout engines, mobile formatting, and scheduled delivery- is a commodity. Dedicated BI vendors have invested hundreds of millions in building it. You will not out-build Sigma or Looker on chart aesthetics, and you should not enter that race.
Own the layers that define your business:
- Data model – encodes your product's domain knowledge
- Metric definitions – what customers will eventually pay to query
- Tenant isolation logic – keeps one customer's data invisible to another
- Usage telemetry – captures what customers actually do
These layers don't commoditize. They compound. And they are the exact layers that determine whether analytics can ever be priced as a module.
That's the thesis for the rest of this article.
What Customers Now Expect and What They Will Pay For
Embedded Analytics has now become a basic requirement for Enterprise procurement teams alongside SSO and SOC2 on evaluation checklists. If your analytics are weak, you lose the deal early, often before you even get a chance to demo. And the damage is hard to spot because you never see the customers you didn't win.
The embedded analytics market reflects this shift. Mordor Intelligence projects put the embedded analytics market at roughly $169 billion by 2031, growing at a 13.65% CAGR. That's not a slow expansion; it's enterprise B2B treating in-product analytics as table stakes rather than a nice-to-have. Interestingly, that demand is not monolithic; it moves in tiers. And each tier represents a different commercial relationship between your SaaS product usage and your analytics capability.
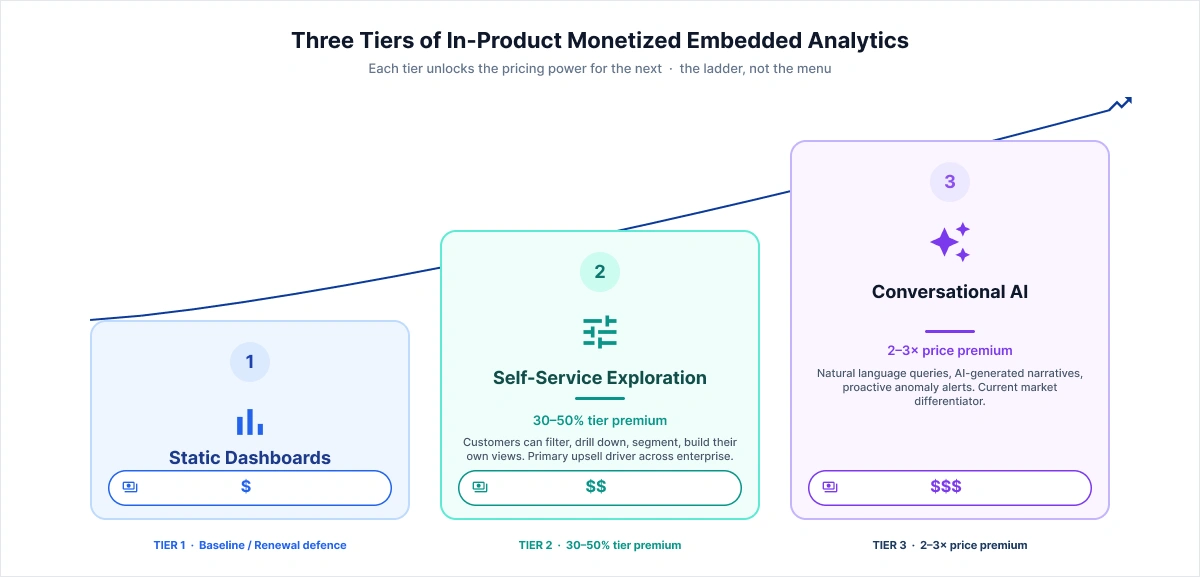
The Three Tiers of In-Product Monetized Embedded Analytics:
Tier 1 – Static dashboards: Pre-built views that refresh on a schedule. Customers can see their data, but cannot explore it. For embedded analytics for SaaS products, this is the baseline. Not having it costs you renewals, but having it won't win you deals or justify premium pricing. If this is where you are today, you're satisfying procurement checklists, not building competitive differentiation.
Tier 2 – Self-service exploration: Customers can now filter, drill down, segment, and build their own views. This is where pricing power starts. In B2B SaaS that NeenOpal has worked on, self-service analytics typically supports a 30–50% tier premium. It's the primary upsell driver across enterprise product categories. Across those accounts, users on self-service plans log in 2-3x more often than those stuck with static dashboards, and that behavior creates real retention habits over time.
Tier 3 – Conversational AI analytics: Natural language queries, AI-generated narratives, proactive anomaly alerts. This is the current differentiator. Companies shipping it reliably to command 2–3x price premiums. Most are not yet there. We'll break down exactly why in section six.
Why "Free Dashboards" Is a Strategic Decision, Not a Default
Most SaaS teams price tier 1 at zero, with dashboards included in every plan. That's often framed as a philosophy ("analytics shouldn't be paywalled") when it's actually an architecture problem.
The multi-tenant analytics architecture cannot gate basic dashboards from advanced exploration. So the default becomes "free" because there's no technical foundation to do anything else.
Giving embedded analytics away at tier 1 shapes what customers expect to pay and makes it significantly harder to charge for tiers 2 and 3 later. The companies that successfully monetize embedded analytics price it as a module at the architecture stage, not the pricing stage. By the time you're writing a pricing page, the real decision is already behind you.
For a deeper look at how analytics architecture decisions shape what you can deliver to customers, see NeenOpal's guide to modern BI implementation for growing companies.
The Real 3-Year Cost Math (Including the Line Vendors Leave Out)
Vendor TCO tables stop at the platform fee. But every time a customer loads an embedded dashboard, it runs queries against your data warehouse, and you pay for that compute. In most production environments, that bill quietly overtakes the vendor license by year two.
That sentence should reframe every Embedded Analytics Build vs Buy cost comparison you've seen. Here's the complete table with the row that no vendor includes.
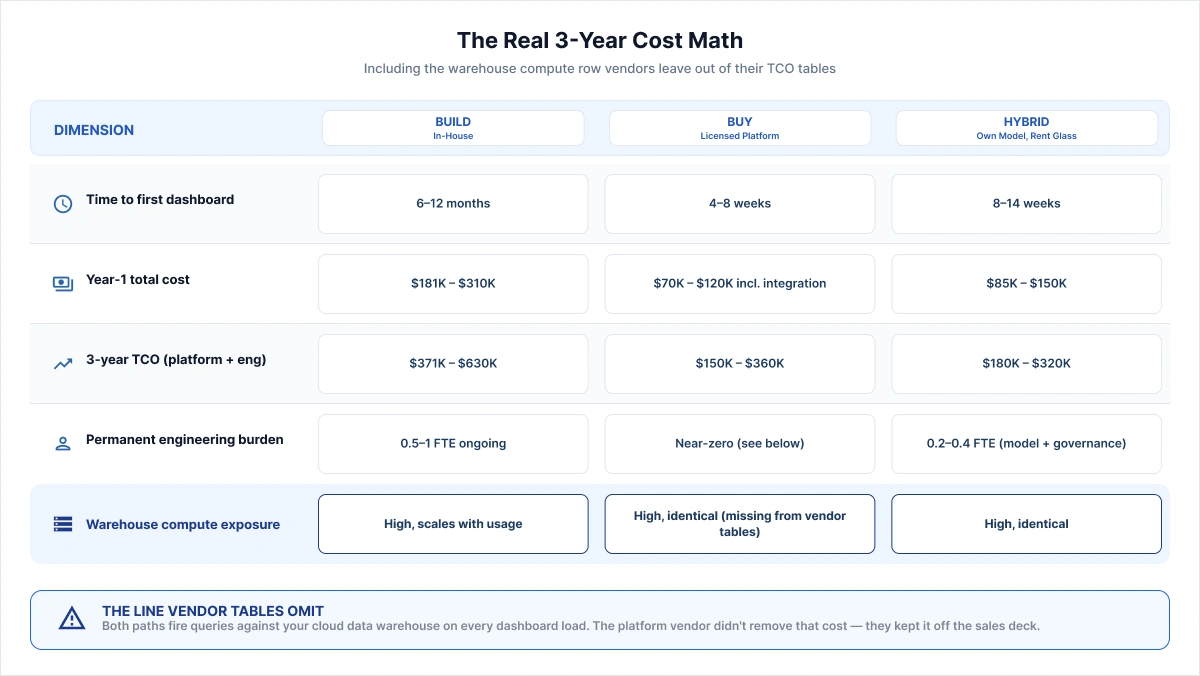
The compute row is the one nobody shows you in embedded analytics cost comparisons. Both paths fire queries against your cloud data warehouse on every dashboard load. The platform vendor did not remove that cost; they just kept it off the sales deck.
What Building Actually Commits You To
Going from zero to production-grade embedded analytics in-house means owning eight separate engineering layers: visualization engine, query and caching layer, tenant isolation, SSO integration, white-label analytics theming, a dashboard editor, an external embedding API, and compliance controls. Most teams underestimate scope on every one of those and end up tripling initial estimates before they're at enterprise standard.
Realistic timeline ranges from 12-18 months to a system you'd put in front of a paying enterprise customer, with two to three senior engineers allocated. After launch, maintaining feature parity with what dedicated BI platforms are shipping consumes 20–30% of engineering capacity permanently. Building embedded analytics in-house is a permanent half-to-full FTE tax that compounds as customers demand parity with dedicated BI tools.
What Buying Actually Costs
The platform fee is real but incomplete. Expect 6-10 weeks and one to two engineers for a production-grade integration: authentication, data source connection, multi-tenant analytics architecture configuration, white-label analytics theming, and embedding within your application shell. At roughly 100 tenants, platform fees typically run $40K–$120K per year, depending on the pricing model.
Every pricing model has a hidden trap. Per-user pricing gets expensive when customers share logins. Per-tenant pricing jumps sharply when you grow faster than the vendor's plan thresholds. Fixed-tier pricing breaks down when too many users try to access dashboards at the same time. The risk isn't that these models are bad; it's that picking the wrong one for how your product actually grows can cost significantly more than your initial estimate.
The Line Item Every Vendor Table Omits: Warehouse Compute
Every dashboard load in a customer-facing embedded product fires queries against your Snowflake, Redshift, or BigQuery instance. While internal BI workloads are relatively predictable, customer-facing analytics looks nothing like that. You have hundreds or thousands of end users spread across time zones, opening dashboards at unpredictable intervals, running similar-but-not-identical queries simultaneously.
That concurrency is spikier and less cacheable than internal BI traffic. On Snowflake or BigQuery, spiky concurrent queries translate directly to compute spend. The more successfully customers use your Embedded analytics, the faster the bill climbs. Success itself creates the cost pressure.
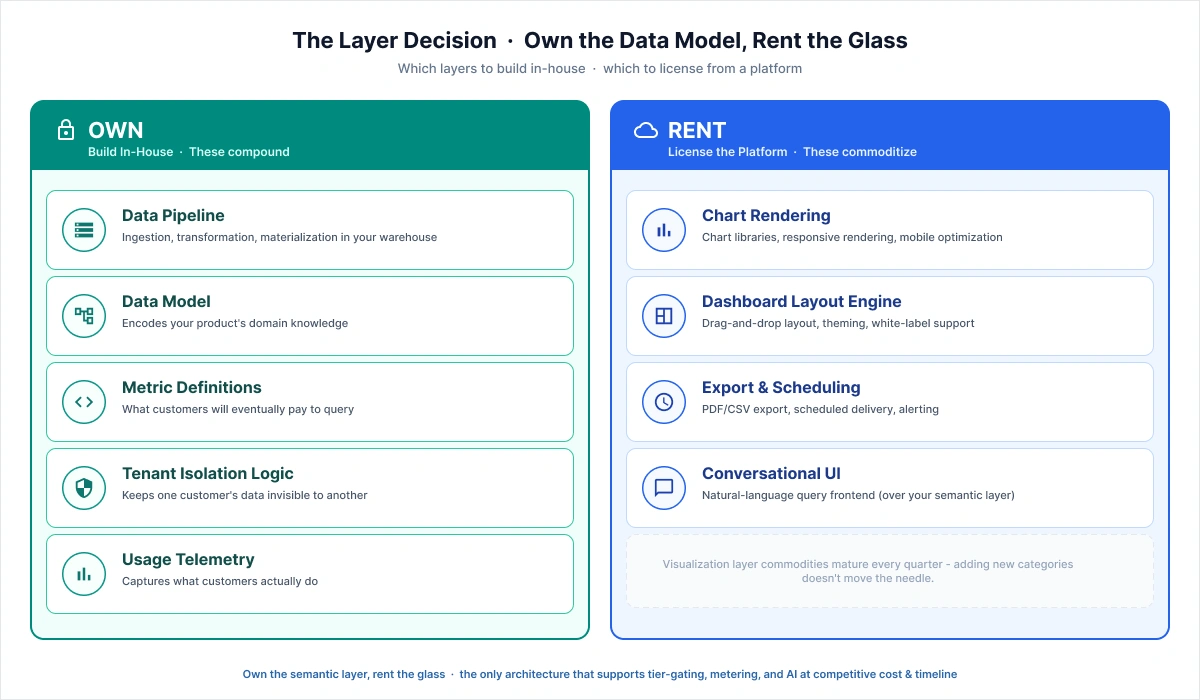
The Layer Decision: Own the Data Model, Rent the Glass
Here is the framework that most vendors do not provide by default.
Choose to OWN: data pipeline, dimensional/semantic model, metric definitions, tenant-isolation logic, usage telemetry. These are where differentiation, monetization, and migration safety live.
Choose to RENT: chart rendering, dashboard layout engines, export/scheduling, conversational UI, like commodity layers with brutal maintenance economics.
The only case for building everything is when analytics is the core product, meaning customers subscribe primarily for the analytics capability itself, not for the broader SaaS product it sits inside. For everyone else, that level of investment rarely makes sense.
The only case for buying everything is below roughly 10 tenants with no monetization ambition.
Most B2B SaaS companies belong in neither extreme. The embedded analytics build vs buy decision, for this majority, resolves to a hybrid: own the model, rent the glass.
Why the Semantic Layer Is the Asset
The semantic layer (the governed translation between raw warehouse tables and business metrics like "monthly active users," "ARR," or "at-risk accounts") is the single most valuable component in your analytics stack.
When you move from one embedded analytics vendor to another (and you will, due to vendor consolidation, pricing changes, and capability gaps, making this near-certain over any five-year horizon), your semantic layer moves with you.
More importantly, your metric definitions are what you're actually selling. That catalog cannot live inside the platform you're renting. The McKinsey Global Institute's research on data-driven organizations is consistent with this: competitive advantage in analytics accrues to the companies that treat their data assets and metric definitions as proprietary infrastructure.
Why Visualization Is a Commodity
Chart libraries, responsive rendering, layout engines, export to PDF and CSV, scheduled delivery, mobile optimization- every BI vendor is aggressively investing here. The feature gap between what a dedicated embedded analytics platform delivers and what an engineering team builds in-house widens every quarter.
Where "Buy" Breaks: The Scale Thresholds Nobody Publishes
Most online resources on the Embedded Analytics Build vs buy topic structurally skip answering "at what point does your platform break?" Here is what those conversations actually surface.
Multi-Tenant Row-Level Security: Where Projects Actually Fail
Vendor claims of multi-tenant isolation "configured in hours" hold for demos, not production. At enterprise scale, tenant isolation is an architecture decision with real consequences. A single misconfigured filter isn't a bug; it's a reportable data breach under GDPR, HIPAA, and SOC 2.
The three patterns each carry distinct tradeoffs.
- Pooled isolation is fast to configure but catastrophically risky at scale.
- Bridged isolation reduces exposure but adds latency.
- Siloed isolation eliminates cross-tenant risk but becomes operationally expensive as your embedded BI scales.
This is where customer-facing dashboard projects fail in production, not chart rendering.
The Pricing Flip: Capacity vs. Usage Models
Capacity-priced embedding becomes cheaper than per-tenant pricing somewhere between 50 and 200 tenants. Most teams model the fee and miss the flip entirely.
How it plays out:
- 50 tenants at $500/tenant = $25K/year → per-tenant pricing looks reasonable
- 300 tenants at $500/tenant = $150K/year → capacity-based models now win
- The crossover is driven by simultaneous active users, not tenant count alone
Most teams plug in tenant numbers, ignore concurrency, and discover the flip after committing to a model.
The real tradeoff:
|
Model |
Advantage |
Risk |
|
Capacity-based (e.g., Power BI Embedded) |
Cheaper at scale |
You manage sizing, autoscaling, and refresh orchestration |
|
Per-tenant SaaS |
Vendor handles complexity |
Expensive at scale |
Neither is wrong. The embedded analytics build vs buy decision ultimately comes down to which failure mode your team is better equipped to manage.
Migration Risk Is Real – Treat It Like an Architect, Not a Vendor
“Your data stays in your warehouse" is true but insufficient. Raw tables are portable. Logic isn't.
What doesn't migrate when you switch embedded BI platforms:
- Calculated fields and metric definitions authored inside the platform
- Dashboard templates that customers have customized
- Scheduled delivery rules
- Permission hierarchies
Migration means a rebuild, not an export. Three mitigations to put in place from day one:
- Own the metric layer externally – never let semantic logic live inside the rented platform
- Negotiate dashboard spec export at contract signing –not after you've decided to leave
- Document all dashboard specs in a platform-agnostic format –contracts about portability and the practical difficulty of reconstruction are two different problems
The Monetization Wall: Why Most Embedded Analytics for SaaS Dashboards Can't Be Priced
You cannot charge for analytics that you never built to track. Thus, usage metering and a governed metric catalog are prerequisites for being able to monetize embedded analytics at all.
Most SaaS product teams discover this about eighteen months too late. The pattern looks like this: a company ships solid tier-1 dashboards, customers use them heavily, and the board asks whether embedded analytics for SaaS can become a revenue line. The engineering team then discovers that nothing in the current architecture supports gating or metering.
The fix is a full re-architecture, which typically takes three to six months. And this isn’t rare, it's the most common outcome when embedded analytics is treated as a UI feature rather than a revenue system.
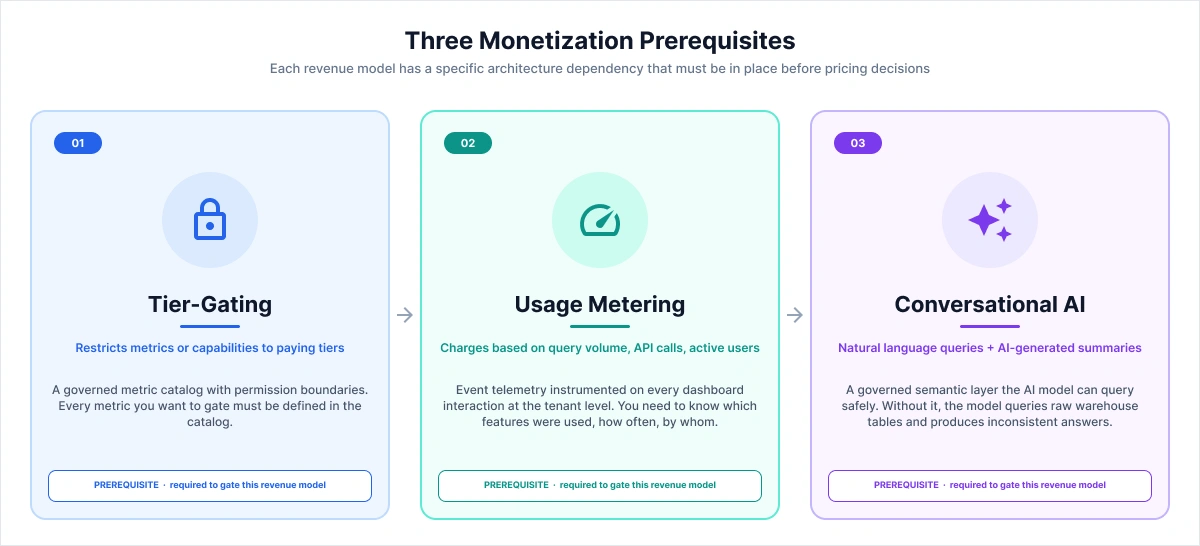
The Three Monetization Prerequisites
Each revenue model has a specific architecture dependency that must be in place before pricing decisions on embedded analytics to build vs buy are made.
Tier-gating - restricting certain metrics or capabilities to paying tiers. It requires a governed metric catalog with permission boundaries. Every metric you want to gate must be defined in the catalog.
Usage metering - charging based on query volume, API calls, or active user count- requires event telemetry instrumented on every dashboard interaction at the tenant level. You need to know, per tenant, which features were used, how often, and by which users.
Conversational AI analytics - natural language query, AI-generated summaries, proactive alerts, requires a semantic layer that the AI model can query safely. Without it, the model queries raw warehouse tables and generates answers that are sometimes accurate and often wrong in ways that are difficult to detect until a customer notices.
Why Bolting AI onto Raw Data Fails
The AI analytics demo is easy to build. Connect a language model to a warehouse schema, write prompt templates, and you have something impressive to show for 30 minutes. That demo reliably fails in production.
The same question phrased differently returns different numbers. Revenue columns with different accounting treatments resolve inconsistently.
This is where embedded analytics cost conversations often go wrong: teams price the demo, not the production requirement. A governed semantic layer is the hard requirement that separates an AI analytics feature you can charge 2–3x for from a security liability you can't ship.
Is your current architecture capable of earning revenue from analytics?
If you're unsure whether your data architecture can support tier-gating, usage metering, or AI analytics, you're in the majority. NeenOpal has assessed and rebuilt embedded analytics for SaaS platforms ranging from 20 to several hundred tenants.
Request an architecture review →
The Revenue Architecture: From Cost Center to Priced Module
The decision to monetize embedded analytics has a clear progression:
|
Tier |
Revenue Impact |
|
Static dashboards |
Defends renewals, no pricing power |
|
Self-service exploration |
30–50% tier premium |
|
Conversational AI analytics |
2–3x price premium |
Quick math: 200 tenants at a $500/month base. A self-service tier priced 30% higher, at a realistic 20–35% attach rate = $72K–$126K new ARR in year one.
Self-service also cuts support tickets like, “can you pull this report?" by nearly 30–40%, which is a hidden saving most embedded analytics build vs buy models never account for.
The companies that successfully monetize embedded analytics treat it as infrastructure from day one, not an afterthought.
Sequencing the Ladder
Each tier should ideally fund and enable the next. Here’s how:
- Tier 1 - Governed customer-facing dashboards with tenant-level telemetry create the metric foundation for everything above
- Tier 2 - Self-service generates behavioral signals: which metrics matter, which queries correlate with churn, and what users will pay for Tier 3
- Tier 3 - Conversational AI requires the semantic layer and telemetry that Tiers 1 and 2 should have already built
What happens when you skip:
- Skip Tier 1 governance → AI produces inconsistent, untrustworthy answers
- Skip Tier 2 telemetry → you can't identify who will pay for AI, making embedded analytics cost impossible to model accurately
What This Means for the Build vs. Buy Decision
Here's where it all makes sense. If you think about it, the layers you must own to support monetization ( the semantic layer, metric definitions, tenant-isolation logic, usage telemetry) are the exact same layers identified earlier as architecturally worth owning. The build vs. buy question and the monetization readiness question are the same, asked from different directions.
Companies that framed the original decision as "which visualization tool should we license?" arrived at an incomplete answer before they started. The correct question is: what do we need to own to earn revenue from this? That question leads directly to the hybrid architecture.
Decision Framework: Build, Buy, or Hybrid– and When
|
Scenario |
Approach |
Rationale |
|
Analytics is the core product (customers subscribe primarily for the analytics) |
Full build |
Differentiation lives in every layer; full control is required |
|
Under 10 tenants, no monetization ambition, must ship in under 2 months |
Full buy |
Speed and cost efficiency outweigh architecture concerns at this scale |
|
20–500+ tenants, any intent to price analytics as a module |
Hybrid (own semantic layer + telemetry, rent visualization) |
Only architecture that supports tier-gating, metering, and AI at a competitive cost and timeline |
|
Regulated industry with data residency or third-party processing restrictions |
Full build or carefully contracted buy |
Contractual processing controls are non-negotiable; verify before signing |
Before committing to any path regarding the Embedded Analytics build vs buy decision, answer these five questions.
- Have you modeled Snowflake/Redshift/BigQuery compute cost at 3× your current tenant count, at peak concurrency? Do not consider the platform fee, but the query load from customer-facing dashboard traffic.
- At your projected tenant count and concurrency profile, is per-tenant or capacity-based pricing cheaper, and have you modeled both, not just the lower-concurrency scenario?
- If you switched analytics platforms tomorrow, what would break: only the visualizations, or also your metric definitions and permission logic?
- Do you currently have (a) a governed metric catalog with permission boundaries, (b) instrumented dashboard telemetry at the tenant level, and (c) semantic-layer entitlement enforcement? Which of the three is missing?
- Have you decided whether your multi-tenant isolation is pooled, bridged, or siloed?
If questions 3 through 5 don't have clear, documented answers, those are the architecture decisions to make before the vendor decision on Embedded BI implementation.
Ready to make the architecture decision that determines whether analytics becomes revenue?
Whether you build, buy, or split the stack, the decisions you make about your semantic layer and tenant architecture in the next quarter determine whether analytics becomes a revenue line or a permanent cost. NeenOpal's data engineering and BI teams help SaaS companies design embedded analytics that customers pay for, from architecture review through delivery.