


From Dashboards to Conversations: AI-Powered Real Estate Analytics with Tableau Concierge
Talk to an ExpertOverview
As analytics evolve, so do the ways business teams interact with data. Traditional dashboards require users to navigate filters, build calculations, and interpret visuals manually, a process that slows decision-making and creates dependency on data teams. NeenOpal explored the capabilities of Tableau Concierge, part of the Tableau Next vision, by building an interactive real estate analytics experience that allows users to simply ask questions and get instant, visual answers powered by generative AI.
- 3K+
- Properties Analyzed via Conversational AI
- 100%
- Self-Serve Analytics for Business Users
Customer Challenges
Business teams in data-intensive industries like real estate face a common set of barriers when trying to extract insights from their data quickly and independently.

Manual Dashboard Navigation
Traditional BI dashboards require users to manually apply filters, adjust views, and interpret charts to find the answers they need. This creates friction in the decision-making process and limits how quickly teams can act on data, especially when dealing with large, multi-dimensional datasets.

Dependency on Data and Analytics Teams
Business users with specific, ad hoc questions often have to wait for analysts to build custom views or run queries on their behalf. This bottleneck slows down insight delivery and prevents teams from being truly self-sufficient in their data exploration.

Limited Granularity and Speed
In industries like real estate where market conditions change rapidly, the inability to instantly drill into specific locations, property types, or agent performance creates blind spots. Standard dashboards often lack the flexibility to answer nuanced, on-demand questions without significant manual effort.
Solutions
NeenOpal built an interactive Tableau Next experience using U.S. real estate data to demonstrate the full capabilities of Tableau Concierge and conversational analytics in a real-world business context.
Data Ingestion and Semantic Layer Development
Real estate data was ingested into Salesforce Data Cloud and a semantic layer was created to structure and govern the data for AI-driven querying. This ensured that Tableau Concierge could understand business context, terminology, and relationships within the dataset — forming the foundation for accurate, intent-based responses.
Tableau Next Dashboard with AI-Powered Metrics
Rather than traditional KPI cards, the dashboard was built using Tableau Metrics — dynamic, intelligent measures that respond to user intent. The dashboard covered key real estate indicators including average market price, property count by status, days on market by property type, top-performing agents, and property distribution by state and age.
Tableau Concierge Agent via Agentforce
A Tableau Concierge agent was created using Agentforce, enabling business users to interact with the dashboard through natural language. Instead of manually navigating visuals, users could simply ask questions such as which locations performed best for apartment listings, what the month-on-month growth in average house prices was for New York, or who the top agents were in California for multi-family homes — and receive instant, contextually relevant visual responses.
Conversational Analytics in Action
The Concierge agent returned accurate, sourced answers within seconds, pulling from the underlying data model to generate relevant charts and summaries on demand. This transformed the analytics experience from a static, exploration-based model to a dynamic, conversation-driven one — making insights accessible to any business user, regardless of technical expertise.
Services
 Tableau Next
 Tableau Concierge
 Salesforce Data Cloud
Benefits

Instant, Self-Serve Insights
Business users gained the ability to ask natural language questions and receive visual, contextual answers in seconds — eliminating the need to wait on data teams for ad hoc analysis and enabling truly on-demand decision-making.

Deeper Granularity Without Manual Effort
Users could instantly drill into specific markets, property types, agent performance, and time-based trends without building filters or custom views, unlocking a level of analytical granularity that traditional dashboards struggle to deliver efficiently.

Scalable Across Industries:
While demonstrated in the real estate context, the Tableau Next framework and Concierge capability are applicable across finance, retail, nonprofit, and any sector where speed and depth of insight are critical to decision-making.

Future-Ready Analytics Foundation
The combination of Data Cloud ingestion, semantic layer governance, Tableau Metrics, and Agentforce-powered Concierge creates a scalable, secure foundation for conversational analytics that can grow with evolving business needs.

Reduced Analyst Dependency
By enabling intent-based querying through Tableau Concierge, analysts were freed from repetitive, low-complexity requests — allowing them to focus on deeper, higher-value analytical work.
Conclusion
By building a Tableau Concierge-powered real estate analytics experience, NeenOpal demonstrated how generative AI is redefining the way business teams interact with data. The shift from manual dashboard navigation to natural language querying removes barriers, accelerates insight delivery, and empowers every user — technical or not — to explore data on their own terms. For enterprises looking to move beyond traditional BI and embrace AI-assisted analytics, Tableau Next and Tableau Concierge represent a powerful and practical next step.
FAQ
Here are answers to common questions about Tableau Concierge, its architecture, and how it can be applied across industries:
What is Tableau Concierge and how is it different from a traditional dashboard?
Tableau Concierge is a generative AI capability within Tableau Next that allows users to ask natural language questions and receive instant visual insights — without manually building filters or calculations. Unlike traditional dashboards that require users to navigate and interpret data themselves, Concierge understands intent and delivers contextually relevant answers on demand.
What role does Salesforce Data Cloud play in this solution?
Salesforce Data Cloud serves as the data ingestion and unification layer, bringing together structured real estate data and making it available to the Tableau Next ecosystem. A semantic layer built on top ensures that Tableau Concierge understands the business meaning of the data, enabling accurate and relevant responses to natural language queries.
Can this solution be applied to industries beyond real estate?
Yes. While this POC was built using U.S. real estate data, the Tableau Concierge and Tableau Next framework is applicable across any data-intensive industry — including finance, retail, healthcare, and nonprofit — wherever business teams need fast, self-serve access to granular insights.
Authors


Case studies
Related case studies

Unifying Marketing, CRM, and Revenue Analytics Using HubSpot, GA4, BigQuery, and Power BI
A group of real estate–focused service businesses partnered with NeenOpal to unify their marketing, CRM, and revenue analytics. Data was fragmented across platforms like HubSpot, GA4, and advertising tools, making it difficult to track how marketing efforts translated into leads and revenue. NeenOpal designed an integrated analytics ecosystem using HubSpot, GA4, BigQuery, Coupler.io, and Power BI to create a scalable, reliable, and decision-ready reporting layer without disrupting the existing stack.
Read case study
Making Data Conversations Real: Using Tableau Concierge for Analytics
Analytics is rapidly evolving, and Tableau Next is redefining how users interact with data. With the introduction of Tableau Concierge, business teams can now ask natural language questions and receive instant, visual insights without navigating complex dashboards. At NeenOpal, we have been early adopters of these new capabilities, applying them to real-world use cases. One of our recent implementations demonstrates how conversational analytics can support faster and more intuitive decision-making in the U.S. real estate sector.
Read case study
Tableau Dashboard Development for a US Insurance Organization: 4 Data Sources Unified
Our client, an insurance organization with field teams spread across every US state, partnered with NeenOpal to replace a manual, spreadsheet-driven reporting process with a consolidated Tableau dashboard environment governed by row-level security. Operational data lived in four separate systems covering Airtable, Salesforce, Google Analytics 4, and Google Search Console, and bringing them together meant exporting and stitching the data by hand, which left leadership without a single reliable view of performance. NeenOpal consolidated all four sources into an Azure SQL Server layer, reviewed and corrected the data quality issues that surfaced along the way, and delivered three Tableau dashboards across seven screens that refresh automatically every day. Row-level security was implemented across all fifty states and the independent districts, driven by an entitlement model the client maintains through a single Google Sheet, so every representative sees the states they are responsible for and nothing more.
Read case study
Unifying Multi-Region Sales Pipeline Analytics with Power BI and Power Query
Our client, a global healthcare company with commercial operations across Africa and Western Europe, partnered with NeenOpal to build a unified sales pipeline dashboard spanning more than six regional teams across two continents. Pipeline data was managed in isolation by each region, reported in inconsistent formats, and pulled from different systems including Salesforce and SAP, leaving leadership without a consolidated view of opportunities, orders, and revenue. NeenOpal designed and delivered a centralized sales pipeline dashboard in Power BI, powered by an automated Excel and Power Query ETL layer, that standardizes data from every region into one live view. The solution tracks each opportunity from lead to shipped order, benchmarks performance against multiple internal targets, forecasts revenue from existing customers, and lets non-technical users refresh the entire report in one to two clicks.
Read case study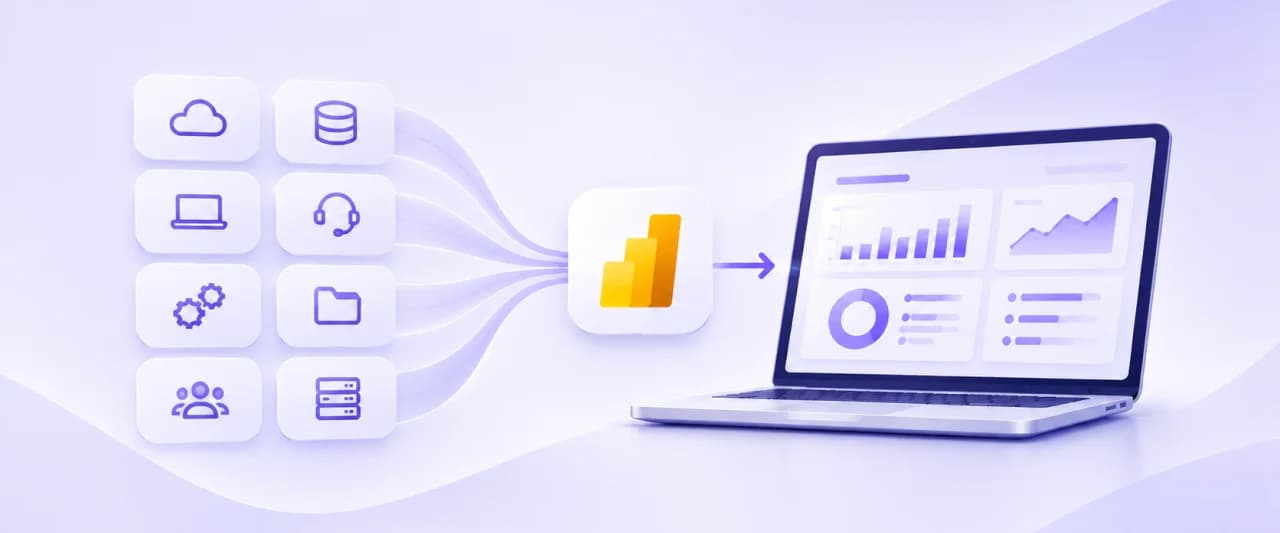
Unifying Eight Disconnected Business Systems into Centralized Power BI Dashboards
Our client, a managed technology services provider (MSP), partnered with NeenOpal to replace a fragmented, siloed reporting process with a centralized Power BI dashboard environment. Business-critical data was scattered across multiple disconnected systems, from the CRM and PSA to the service desk, client surveys data, and network monitoring tools, leaving leadership without a single view of sales, customers, operations, or the workforce. NeenOpal designed and delivered a centralized Power BI reporting solution that unifies data from all of these sources into an automated, daily-refreshed analytics layer on AWS. By ingesting each source, staging it in a PostgreSQL warehouse, and modeling it into governed Power BI dashboards across every business function, the team turned manual, spreadsheet-bound reporting into interactive, self-service insight the client can filter and act on in seconds.
Read case study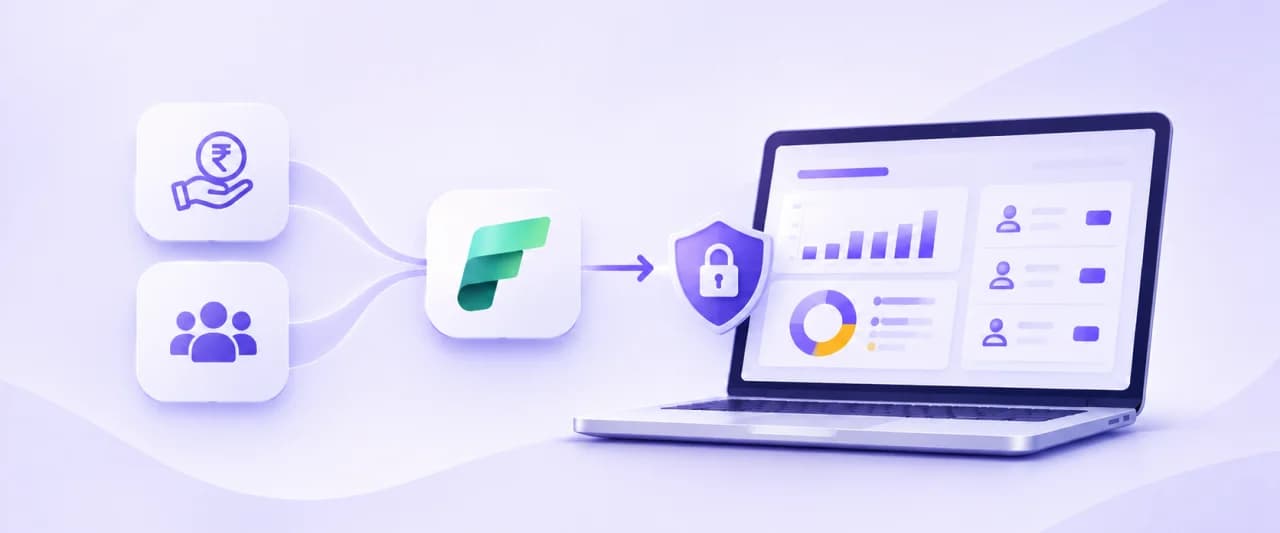
Microsoft Fabric Migration with Row-Level Security for Multi-Client Analytics
Our client, a B2B financial wellness and HR technology company, where we have worked on their data that delivers reporting to multiple business customers, partnered with NeenOpal to consolidate a fragmented reporting stack into a single, secure analytics platform. The client's finance and user-engagement data lived across MongoDB, AWS RDS, Google Sheets, and HubSpot, and was surfaced through standalone Power BI dashboards built on AWS. Serving each downstream client meant securely embedding a per-user filtered dashboard for external users logging into the client's portal, and app-owns-data embedding at that scale requires dedicated capacity. On shared, standalone Power BI the team had worked around this by building and maintaining a separate dashboard and semantic model for every client, which increased infrastructure cost and slowed delivery. NeenOpal designed and delivered a four-week Microsoft Fabric migration that unified every source into one governed semantic model with dynamic row-level security. By rebuilding the pipeline on a medallion architecture inside a Fabric Lakehouse and enforcing access with a single Power BI security role, the client replaced many duplicate dashboards with one unified report that automatically shows each user only the data they are permitted to see.
Read case study