
Empowering a Texas-Based Real Estate Insurance Provider: A Redshift Data Warehouse Success Story
Talk to Our ExpertsOverview
Our client, a real estate insurance provider, ensures protection for brokers, agents, and home sellers from legal liabilities. As it expanded across US locations, integrating various tools led to data silos, hampering information access. Leadership faced challenges in decision-making due to fragmented insights, while the technical team struggled to maintain 16 disparate data sources.
- 20%
- Significantly Reduced Broker Churning
- 33%
- Substantially Reduced Client Acquisition Cost
- 40%
- Successfully Increased Market Penetration
Customer Challenges
As the organization expanded, its growing tech stack led to inefficiencies in data management and decision-making. Siloed systems and a lack of integration hindered operational efficiency, making it difficult to extract valuable insights.

Data Fragmentation Across Platforms
The organization faced considerable challenges in effectively managing data scattered across different platforms. Managing multiple systems posed a formidable challenge, compounded by the need to integrate them to gain a comprehensive view of their information landscape, ultimately hindering the organization's decision-making capabilities.

Lack of a Single Source of Truth
The lack of a centralized repository presented a critical hurdle, leading to discrepancies and data inconsistencies across the organization. Different departments had varying interpretations of the same metric values, causing interdepartmental inconsistencies. This absence of a unified source of truth compromised data accuracy and reliability, thereby complicating operations.

Difficulty in getting Actionable Insights from Data
Gaining actionable insights was nearly impossible due to data fragmentation across multiple platforms, compounded by the challenge of integrating them. The absence of a visualization tool further complicated navigating this fragmented data landscape, especially for non-technical stakeholders aiming to derive meaningful insights.
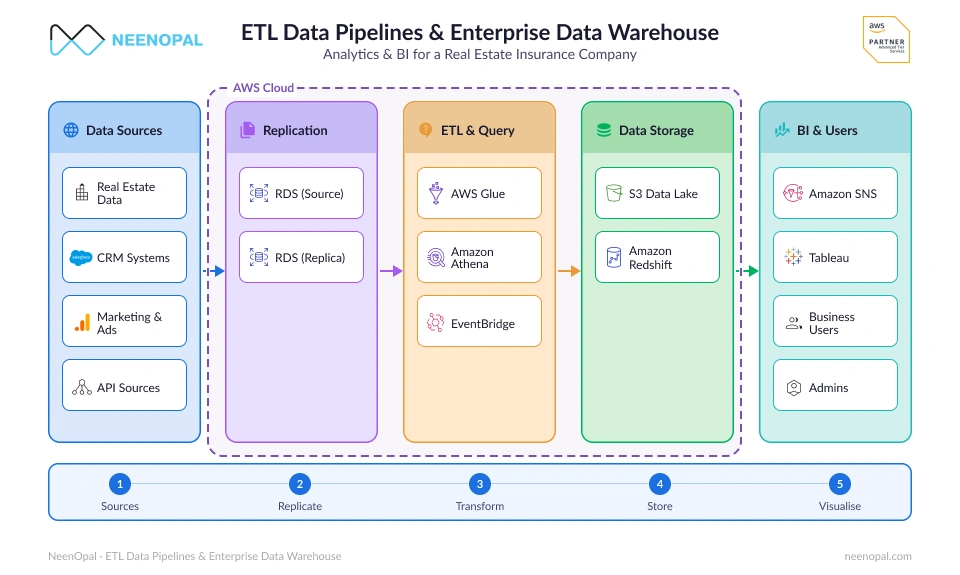
AWS Data Warehouse Architecture for Unified Analytics
An AWS-based architecture that integrates multiple data sources using Glue and Lambda, centralizes data in Amazon Redshift, and enables leadership dashboards for actionable insights.
Solutions
In today's dynamic business landscape, Neenopal stands out for its meticulous analysis of client systems and pain points, aligning solutions with overarching visions and KPIs. By harnessing cutting-edge technologies, Neenopal not only addressed current challenges but also empowers clients with actionable insights.
Holistic Approach - Where Business Meets Tech
NeenOpal's team of experts conducted an in-depth analysis of the customer’s existing system, carefully understanding the pain points of both the tech teams and CXOs. This analysis was aligned with the company’s ultimate vision and desired key performance indicators (KPIs), ensuring we develop a holistic approach with the best tech stack tailored to meet the business requirements.
Centralized Repository with a Reporting Layer - Acts as the Single Source of Truth
A centralized repository, balancing data sources and client needs, was established. AWS Glue and Lambda jobs built robust, auto-scaling data pipelines. Emphasis was on optimizing historical data retrieval and managing daily incremental loading. Amazon Redshift integration enabled high-performance analysis and reporting with efficient storage and querying of large datasets.
Empowering Senior Leadership with Visual Insights
As an integral part of out solution, we designed dashboards to empower senior leadership with visual insights. These dashboards facilitates the monitoring and tracking of crucial metrics, including, Geographical analysis of Sales KPIs, Broker churn rate, and Comparison of market penetration to the firm’s potential
Services
 AWS Lambda
 AWS Glue
 Amazon RedShift
 Amazon S3
Features

Scalability
The use of Amazon RDS (MySQL) and Multi AZ Amazon Redshift ensures that the system can scale horizontally and vertically, handling increasing amounts of data and user requests efficiently.

Reliability
Amazon RDS (MySQL) with replication and Multi-AZ, alongside Amazon Redshift, ensures high availability and fault tolerance. Integrating SNS and EventBridge maintains stability with reliable alerts.

Flexibility and Support
The AWS solution supports MLS, HomeJunction, VanillaSoft, Zoho, Google Ads, and Iterable data sources. AWS Glue enables seamless ETL processes for flexible data integration and transformation.

Compliance
AWS’s compliance certifications ensure the project meets industry standards thoroughly. AWS Secrets Manager and CloudWatch enhance both security and operational monitoring effectively.

Cost Efficiency
AWS's pay-as-you-go pricing model for services like RDS and S3 allows for cost-effective scaling. The solution’s design reduces the need for extensive upfront investments, optimizing operational costs.

Security
AWS Secrets Manager manages sensitive information robustly, while AWS CloudWatch provides comprehensive monitoring and alerting. Encryption ensures information protection.

Integration
The architecture seamlessly integrates real estate and marketing platforms. AWS Glue and EventBridge enable smooth, event-driven workflows for comprehensive data analysis.
Benefits

Empowered Decision-Making
Seamlessly transitioning from historical reports to real-time analytics enables enhanced data-driven decision-making, offering a dynamic understanding of the business landscape. This shift ensures that the decisions are informed by past trends and current insights, fostering agility in strategic planning.

Streamlined Maintenance
The solution's design prioritizes ease of maintenance, liberating resources from mundane operational tasks and redirecting them towards more strategic endeavors. This streamlined approach not only enhances efficiency in management and upkeep but also optimizes resource allocation for maximum productivity.

Scalability and Flexibility
With inherent scalability and flexibility, the implemented solution allows the organization to expand seamlessly and adapt to evolving data requirements. This agility ensures long-term viability and growth, enabling the organization to respond swiftly to changing market dynamics and opportunities.
Conclusion
The solution established a centralized repository managed by the IT team, ensuring data integrity and scalability. This optimized data model enabled efficient reporting tailored to CXOs' needs, promoting data-driven decision-making. The results include enhanced data accessibility, simplified maintenance, and a robust framework for strategic analysis.
FAQ
Frequently Asked Questions regarding a Redshift Data Warehouse Success Story
How did NeenOpal create a single source of truth?
By building a centralized data repository with Amazon Redshift and implementing automated ETL pipelines using AWS Glue and AWS Lambda.
Which AWS services were used in this implementation?
The solution leveraged AWS Lambda, AWS Glue, Amazon Redshift, Amazon S3, Amazon RDS (MySQL), Amazon SNS, Amazon EventBridge, AWS Secrets Manager, and Amazon CloudWatch.
How does the solution improve decision-making?
Interactive dashboards and a reporting layer provide leadership with real-time visibility into sales performance, broker churn, and market penetration.
Authors


Case studies
Related case studies

Building a Validated Conversational Sales Analyst on Amazon Quick for a Managed IT Provider
Our client, a managed IT services provider delivering all-inclusive computer, internet and help desk support to small and mid-sized businesses, already monitored sales opportunities across eight funnel stages in an established Power BI dashboard. Answering deeper questions about stage duration, win rates and trends still meant stacking filters and interpreting the resulting measures. NeenOpal extended that environment with a conversational AI Analyst Agent built on Amazon Quick, connected to the client's opportunity stage funnel dataset in Amazon RDS. Teams now ask questions in plain language and receive summaries, charts and the supporting SQL, cutting the time to a routine answer by 75% and the number of analysis steps by 60%. The depth sits in the foundation: a curated opportunity-stage data model, documented business rules, and answers reconciled with the existing Power BI dashboard month by month and filter by filter, which matched on every indicator tested. Power BI stays exactly where it was.
Read case study
Unifying Eight Disconnected Business Systems into Centralized Power BI Dashboards
Our client, a managed technology services provider (MSP), partnered with NeenOpal to replace a fragmented, siloed reporting process with a centralized Power BI dashboard environment. Business-critical data was scattered across multiple disconnected systems, from the CRM and PSA to the service desk, client surveys data, and network monitoring tools, leaving leadership without a single view of sales, customers, operations, or the workforce. NeenOpal designed and delivered a centralized Power BI reporting solution that unifies data from all of these sources into an automated, daily-refreshed analytics layer on AWS. By ingesting each source, staging it in a PostgreSQL warehouse, and modeling it into governed Power BI dashboards across every business function, the team turned manual, spreadsheet-bound reporting into interactive, self-service insight the client can filter and act on in seconds.
Read case study
Modernizing Finance Data Integration & Analytics Using AWS, Snowflake, and Power BI
A global manufacturing organization with regional headquarters in the United States operates across various sectors, including agriculture, construction, marine, and industrial. The company produces advanced diesel engines, diesel-powered equipment, and gas engine-based energy systems, with finance operations supporting complex, high-volume ERP-driven reporting needs.
Read case study
Revolutionizing BI Dashboard Creation with Mokkup.ai & AWS Bedrock-Powered Gen AI
Manual dashboard wireframing had become a hard bottleneck on decision-making, keeping dashboard creation out of reach for the business users who needed it most. Mokkup.ai set out to make it instant and accessible with a system that could generate and refine dashboards from simple prompts. Working closely with AWS, NeenOpal helped bring that vision to life, leveraging Claude models through AWS Bedrock, zero-shot AI prompting, and proprietary layout engines to automatically generate, review, and optimize dashboard designs. The platform now serves over 250,000 active users across 60+ countries.
Read case study
Scalable ILI Dashboard with AWS Lambda and Tableau Integration
A leading DEI consultancy was struggling with slow, outdated reporting systems, scattered data sources, and a lack of scalability. Their legacy database caused delays in processing survey data, leading to stale insights and a heavy manual reporting burden. NeenOpal’s Implementation Division stepped in to address these challenges by developing an Inclusive Leadership Index (ILI) dashboard using Tableau and AWS.
Read case study
Driving Strategic Growth with Power BI Evolution Index Tool
The Evolution Index (EI) Simulator Tool was built to help the client plan strategically by simulating various market growth scenarios across countries. Built in Power BI, the tool helps users to input key variables and dynamically evaluate their impact on year-end performance. This simulation-driven approach enhances forecasting accuracy and helps organizations allocate resources effectively, driving smarter business decisions and maximizing market opportunities.
Read case study