


Zoom Events to BigQuery: Capturing the Attendee Data Standard Zoom APIs Miss
Talk to Our Data EngineersOverview
A leading dental-industry media company hosts hundreds of webinars a year on Zoom Events. Its reporting showed how many people attended each one, but not who they were. Without attendee-level data, the team couldn't follow up with the right people or connect webinar engagement to the rest of its marketing and CRM data. NeenOpal traced the problem to how Zoom Events is built and found an API route that returns the attendee records the client's own registrants generate. A Google Cloud Run pipeline now loads those records into Google BigQuery and refreshes them every month. The initial load covered more than 200 webinars and identified over 13,000 unique attendees.
- 200+
- webinars processed in the initial load
- 60K
- attendee records loaded into BigQuery
- 13K
- unique attendees identified across all webinars
- 12
- of attendee history kept current by a monthly automated refresh
Customer Challenges
Zoom offers more than one webinar product, and the data for each lives in different places, so the usual integration approach missed most of the data.

Access Restricted to One App Type
The participant report permission the pipeline needed is available only on Zoom's Server-to-Server OAuth apps, not on general apps. The wrong app type means the data is simply unreachable, with no obvious error to explain why.

A 12-Month Retention Window
Zoom keeps participant report data for the last 12 months only. Requests for older events waste API calls and return nothing.

Registrant APIs That Returned Almost Nothing
The client ran its webinars on Zoom Events, not standard Zoom Webinars. Attendees registered through the Events hub, so the standard registrants API returned close to zero records for events that had drawn hundreds of people.

Head Counts Without Names
The existing pipeline captured only aggregate webinar metrics. With no individual attendee names or emails stored, subscriber-level engagement analysis was impossible.

Pagination Totals That Couldn't Be Trusted
The Zoom Events API reported unreliable record totals, returning the page size as the total on every request. A pipeline that trusted those totals would stop early and silently miss attendees.
Solutions
NeenOpal worked within Zoom's platform constraints rather than against them, starting with how Zoom Events relates to the rest of Zoom.
Map Each Event to Its Underlying Webinar
Zoom Events runs on top of standard Zoom Webinars, so every event has an underlying webinar ID. The pipeline reads those IDs from the client's existing BigQuery staging data, so it knows exactly which webinars to query.
Query Participant Reports With Server-to-Server OAuth
For each webinar, a Cloud Run function calls Zoom's participant report endpoint using a Server-to-Server OAuth token. That combination returns the attendee-level records the standard registrants API could not.
Page Through Every Result, Ignoring Unreliable Totals
The pipeline pages through every result set without relying on Zoom's record totals, so no attendee is dropped when those totals are wrong. Records are then inserted into BigQuery.
Skip Events Outside the Retention Window
A 12-month date filter skips events outside Zoom's retention window before any call is made. API usage goes only to webinars that can return data.
Join Attendees to Event Titles and Refresh Monthly
A staging view joins attendee records with event titles, giving analysts a reporting-ready table of who attended what. Google Cloud Scheduler runs the refresh every month with no manual effort.
Services
 Google BigQuery
 Google Cloud Run
 Google Cloud Scheduler
 Events API
 Participant Report API
Benefits

13K+ Named Attendees Instead of Head Counts
Attendee names and emails are now captured for every webinar in the last 12 months, turning aggregate attendance figures into a list of real people the team can act on.

Attendance Tied Directly to CRM and Campaigns
Attendee records sit in the same BigQuery warehouse as the client's CRM and campaign data, so webinar attendance can be tied to leads, contacts and campaigns.

Repeat Attendees and Popular Topics, Finally Visible
The team can now see which individuals attend repeatedly and which topics draw new audiences, analysis that was impossible with head counts alone.

Every API Call Returns Usable Data
Retention-aware filtering means every request goes to a webinar that can return data, keeping each run fast and within Zoom's limits.

No More Manual Attendee Exports
The monthly refresh runs on its own. No one has to download attendee reports by hand after each event.
Conclusion
By working out how Zoom Events and Zoom Webinars fit together, NeenOpal found the one API route that returns accurate attendee data and built a pipeline around it. The client now has subscriber-level webinar engagement data in the same warehouse as the rest of its marketing intelligence. This pipeline is part of the wider platform described in Unified Cross-Platform Intelligence Across 20+ Data Sources.
FAQ
Common questions about capturing attendee data from Zoom Events
Why do standard Zoom APIs return almost no registrants for Zoom Events webinars?
Because Zoom Events and Zoom Webinars are different products. When attendees register through the Events hub rather than a standard webinar registration page, the standard registrants API returns close to zero records even for events that drew hundreds of people. The data exists, but not where the usual integration looks for it.
How do you get attendee-level data out of Zoom Events?
Zoom Events runs on top of standard Zoom Webinars, so every event has an underlying webinar ID. The pipeline reads those IDs, then calls Zoom’s participant report endpoint for each webinar to retrieve attendee-level records. It pages through every result set without relying on Zoom’s reported record totals, which return the page size as the total on every request and would otherwise cause a pipeline to stop early and silently drop attendees.
Why does this require a Server-to-Server OAuth app?
The participant report permission is available only on Zoom’s Server-to-Server OAuth apps, not on general apps. With the wrong app type the data is simply unreachable, and there is no obvious error message explaining why, which makes this a common dead end for teams attempting the integration themselves.
How far back can Zoom attendee data be retrieved?
Zoom retains participant report data for the last 12 months only. The pipeline applies a 12-month date filter before any call is made, so requests are never spent on events that cannot return data. A monthly automated refresh then keeps that rolling 12-month window current.
Authors
Madhumita GiribabuSenior Associate Consultantin
Case studies
Related case studies

Moodle LMS to BigQuery: Replacing Thousands of Nested API Calls With One Pipeline
A leading dental-industry media company runs its continuing-education programs on a Moodle-based learning management system. Its 1.4M+ enrollment records held the answers to which courses drew learners, who finished them, and how completion trended over time, but none of it reached the company's analytics warehouse. The only route out was course-by-course API calls that could not run at that scale. NeenOpal designed and deployed a Python pipeline on Google Cloud Run that loaded every historical enrollment into Google BigQuery and now refreshes automatically each month. The full monthly run finishes in about 12 minutes, with no manual effort from the client's team.
Read case study
HubSpot to BigQuery: A Complete CRM History With SCD Type 2 Deal Tracking
A leading dental-industry media company runs its sales and marketing on HubSpot. More than 200,000 activity records sat across contacts, companies, deals, calls, emails, meetings, tasks, notes and SMS, with no automated way to bring them together for analysis. The team also had no way to analyze how deals moved through the pipeline over time. NeenOpal built ingestion pipelines across every major HubSpot object, linked them with 15 association tables and added SCD Type 2 tracking so deal stage history is preserved in Google BigQuery. The pipelines refresh weekly with no manual intervention.
Read case study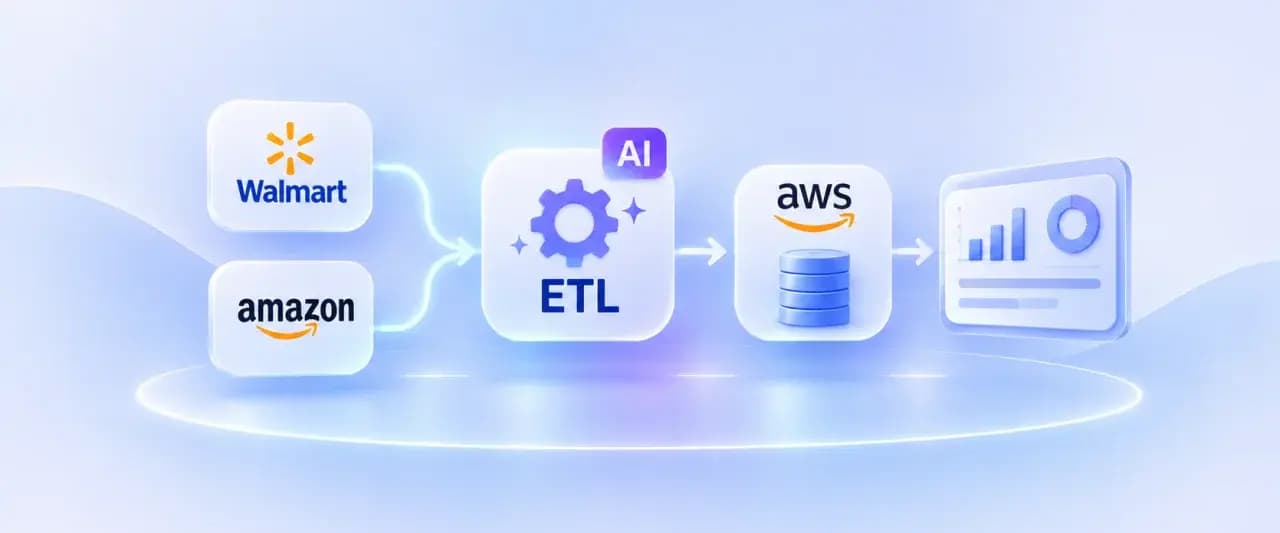
AI-Augmented ETL for Automating Multi-Portal Retail Reporting on AWS
A consumer beauty and personal care brand needed to bring its Walmart and Amazon supplier and performance data into a single AWS RDS PostgreSQL database. Walmart's data was split across a standard supplier API and three separate reporting portals (Retail Link, Scintilla, and Supplier One), each with its own authentication, file formats, and update cadence. NeenOpal designed a hybrid ETL platform with two ingestion paths running in parallel: an orchestrated API pipeline for the data Walmart exposes directly, and an AI-driven report retrieval pipeline for the data that fell outside the scope of the client's existing API access. Both paths converge on a shared Glue transformation layer, a common S3 staging area, and a single PostgreSQL database, with a separate one-time Spark job bringing in Amazon Vendor Central's historical data. The result is a single, config-driven system rather than a set of one-off integrations.
Read case study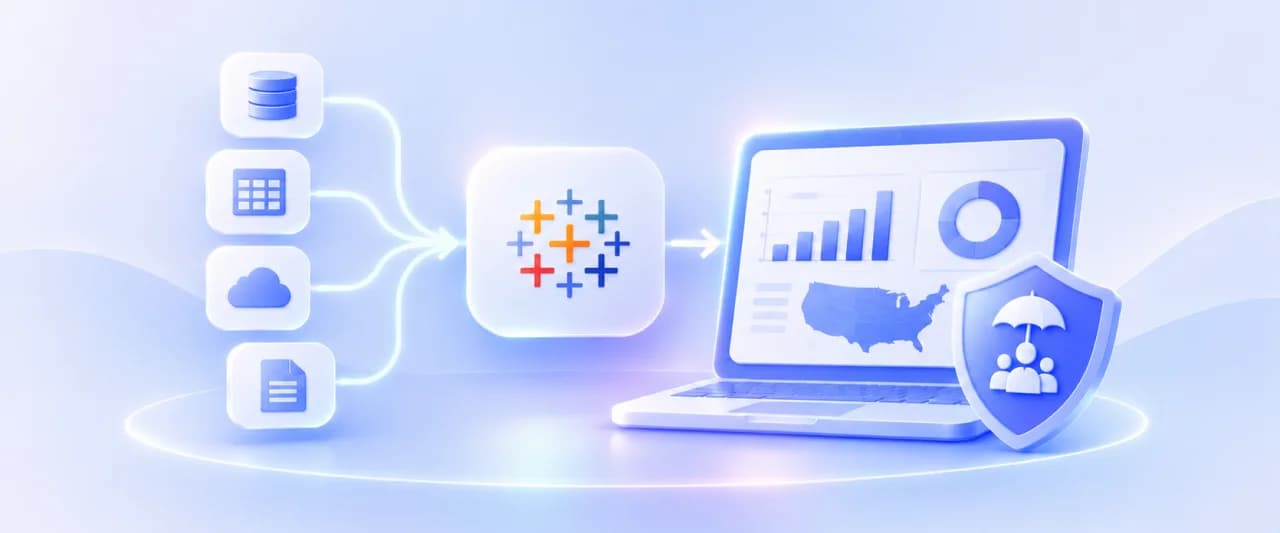
Tableau Dashboard Development for a US Insurance Organization: 4 Data Sources Unified
Our client, an insurance organization with field teams spread across every US state, partnered with NeenOpal to replace a manual, spreadsheet-driven reporting process with a consolidated Tableau dashboard environment governed by row-level security. Operational data lived in four separate systems covering Airtable, Salesforce, Google Analytics 4, and Google Search Console, and bringing them together meant exporting and stitching the data by hand, which left leadership without a single reliable view of performance. NeenOpal consolidated all four sources into an Azure SQL Server layer, reviewed and corrected the data quality issues that surfaced along the way, and delivered three Tableau dashboards across seven screens that refresh automatically every day. Row-level security was implemented across all fifty states and the independent districts, driven by an entitlement model the client maintains through a single Google Sheet, so every representative sees the states they are responsible for and nothing more.
Read case study
Unifying Multi-Region Sales Pipeline Analytics with Power BI and Power Query
Our client, a global healthcare company with commercial operations across Africa and Western Europe, partnered with NeenOpal to build a unified sales pipeline dashboard spanning more than six regional teams across two continents. Pipeline data was managed in isolation by each region, reported in inconsistent formats, and pulled from different systems including Salesforce and SAP, leaving leadership without a consolidated view of opportunities, orders, and revenue. NeenOpal designed and delivered a centralized sales pipeline dashboard in Power BI, powered by an automated Excel and Power Query ETL layer, that standardizes data from every region into one live view. The solution tracks each opportunity from lead to shipped order, benchmarks performance against multiple internal targets, forecasts revenue from existing customers, and lets non-technical users refresh the entire report in one to two clicks.
Read case study
Unified Cross-Platform Intelligence Across 20+ Data Sources
A leading dental industry media company partnered with NeenOpal to build a centralized marketing intelligence infrastructure from the ground up. With audience data, campaign performance, CRM activity, webinar engagement, and learning platform metrics scattered across more than a dozen disconnected systems, the client lacked a unified view of marketing performance and customer engagement. NeenOpal designed and delivered a fully automated, cloud-native data platform that ingests data from 20+ marketing, CRM, and engagement platforms into Google BigQuery enabling reliable, weekly-refreshed reporting and cross-platform analytics from a single source of truth.
Read case study