
Analytics & AI Transformation: Real-World Success Stories
Discover how NeenOpal empowers businesses with AI & Data-driven transformation.
40 case studies
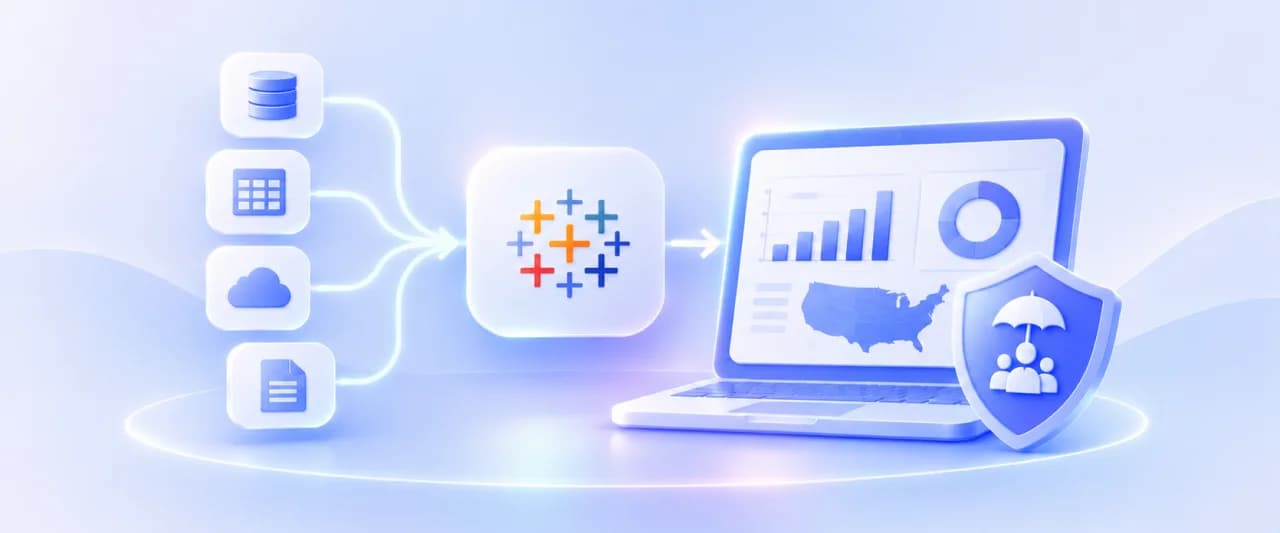

Tableau Dashboard Development for a US Insurance Organization: 4 Data Sources Unified
 Vishal Sharma
Our client, an insurance organization with field teams spread across every US state, partnered with NeenOpal to replace a manual, spreadsheet-driven reporting process with a consolidated Tableau dashboard environment governed by row-level security. Operational data lived in four separate systems covering Airtable, Salesforce, Google Analytics 4, and Google Search Console, and bringing them together meant exporting and stitching the data by hand, which left leadership without a single reliable view of performance. NeenOpal consolidated all four sources into an Azure SQL Server layer, reviewed and corrected the data quality issues that surfaced along the way, and delivered three Tableau dashboards across seven screens that refresh automatically every day. Row-level security was implemented across all fifty states and the independent districts, driven by an entitlement model the client maintains through a single Google Sheet, so every representative sees the states they are responsible for and nothing more.
Read case study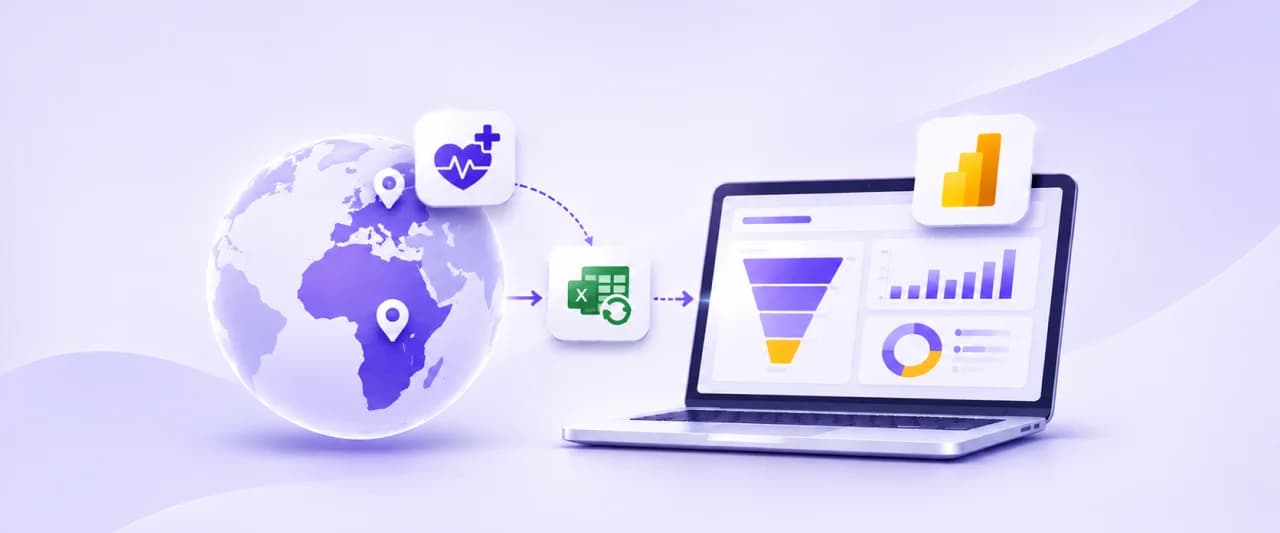

Unifying Multi-Region Sales Pipeline Analytics with Power BI and Power Query
 Kunwar Chawla
Our client, a global healthcare company with commercial operations across Africa and Western Europe, partnered with NeenOpal to build a unified sales pipeline dashboard spanning more than six regional teams across two continents. Pipeline data was managed in isolation by each region, reported in inconsistent formats, and pulled from different systems including Salesforce and SAP, leaving leadership without a consolidated view of opportunities, orders, and revenue. NeenOpal designed and delivered a centralized sales pipeline dashboard in Power BI, powered by an automated Excel and Power Query ETL layer, that standardizes data from every region into one live view. The solution tracks each opportunity from lead to shipped order, benchmarks performance against multiple internal targets, forecasts revenue from existing customers, and lets non-technical users refresh the entire report in one to two clicks.
Read case study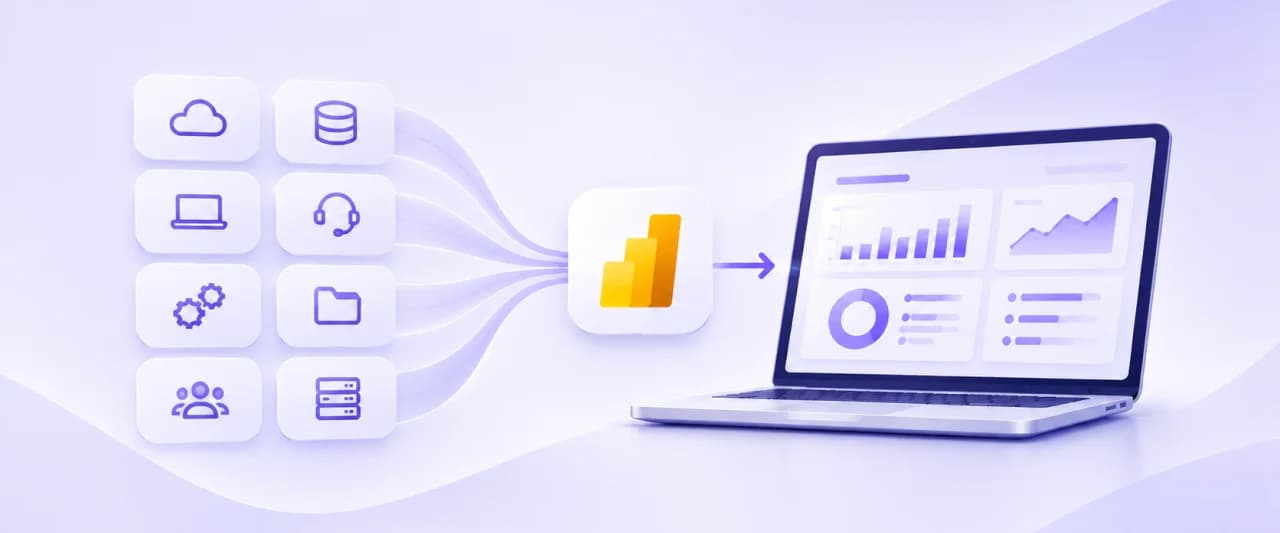

Unifying Eight Disconnected Business Systems into Centralized Power BI Dashboards
 Abhinav Sinha
Our client, a managed technology services provider (MSP), partnered with NeenOpal to replace a fragmented, siloed reporting process with a centralized Power BI dashboard environment. Business-critical data was scattered across multiple disconnected systems, from the CRM and PSA to the service desk, client surveys data, and network monitoring tools, leaving leadership without a single view of sales, customers, operations, or the workforce. NeenOpal designed and delivered a centralized Power BI reporting solution that unifies data from all of these sources into an automated, daily-refreshed analytics layer on AWS. By ingesting each source, staging it in a PostgreSQL warehouse, and modeling it into governed Power BI dashboards across every business function, the team turned manual, spreadsheet-bound reporting into interactive, self-service insight the client can filter and act on in seconds.
Read case study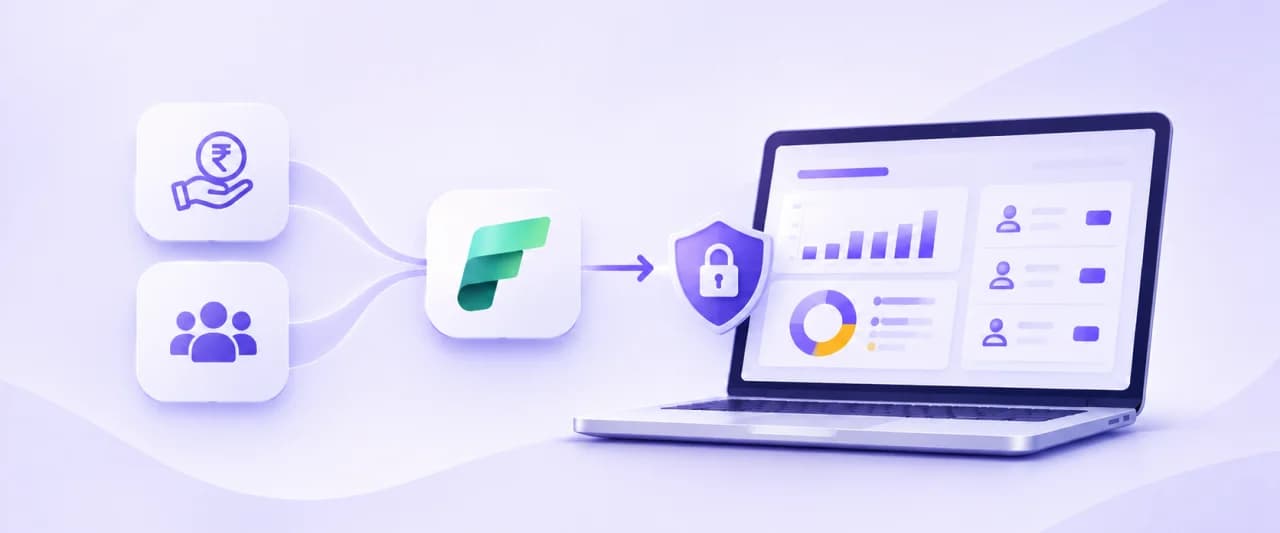

Microsoft Fabric Migration with Row-Level Security for Multi-Client Analytics
 Aashay Mehta
Our client, a B2B financial wellness and HR technology company, where we have worked on their data that delivers reporting to multiple business customers, partnered with NeenOpal to consolidate a fragmented reporting stack into a single, secure analytics platform. The client's finance and user-engagement data lived across MongoDB, AWS RDS, Google Sheets, and HubSpot, and was surfaced through standalone Power BI dashboards built on AWS. Serving each downstream client meant securely embedding a per-user filtered dashboard for external users logging into the client's portal, and app-owns-data embedding at that scale requires dedicated capacity. On shared, standalone Power BI the team had worked around this by building and maintaining a separate dashboard and semantic model for every client, which increased infrastructure cost and slowed delivery. NeenOpal designed and delivered a four-week Microsoft Fabric migration that unified every source into one governed semantic model with dynamic row-level security. By rebuilding the pipeline on a medallion architecture inside a Fabric Lakehouse and enforcing access with a single Power BI security role, the client replaced many duplicate dashboards with one unified report that automatically shows each user only the data they are permitted to see.
Read case study

How a Global Agricultural Equipment Manufacturer Built a Trusted Web Analytics Platform with GA4, Snowflake, and Power BI
 Monish Mohanty
Our client is a leading manufacturer of agricultural and industrial equipment operating across international markets, with a B2B sales model distributed through an authorised dealer and reseller network. The client's website serves as a primary discovery and research channel for prospects and distributors, where meaningful conversion actions centre on product brochure and playbook downloads rather than direct online transactions. Despite access to Google Analytics 4, the client had no reliable mechanism to trust or act on its own web data, with sampled GA4 reporting, undefined conversion events, and the absence of a structured data pipeline meaning internal stakeholders were making website and content decisions without confidence in the underlying numbers. NeenOpal partnered with the client to rebuild the analytics data foundation from the ground up, engineering a modern pipeline from GA4 through BigQuery into a multi-layer Snowflake data warehouse, and delivering a suite of Power BI dashboards that provided trusted, unsampled website intelligence for the first time.
Read case study

How a Healthcare Education Organisation Replaced Manual Survey Scoring with a Fully Automated Analytics Pipeline and Real-Time Leaderboard
 Alokesh Pyne
Our client is a healthcare and medical education organisation that runs competitive, survey-based learning programmes for clinicians, residents, and academic medical professionals across the United States. The organisation conducts multiple educational event series, structured as races with individual laps, where participants respond to clinically oriented survey questions under time pressure, and performance is ranked across both individual questions and cumulative laps with top performers recognised and rewarded at the close of each event cycle. Prior to NeenOpal's engagement, every aspect of survey data collection, aggregation, scoring, and leaderboard generation was handled manually through Excel, an approach that introduced systematic risk of error and created significant operational burden for the internal team. NeenOpal designed and delivered an end-to-end automated pipeline, migrating the client from a fragmented, manual process to a fully governed, cloud-based analytics platform powering daily leaderboard refreshes across all active events.
Read case study

Predicting Video Revenue Through Marketing Mix Modeling and Bayesian Forecasting
 Himanshu Bahmani
Our client, a media and entertainment company, sought to establish a scalable and repeatable process to predict video revenue based on varying marketing spend inputs. With multiple upcoming releases and limited visibility into which marketing channels drove the most impact, media planning decisions were largely manual and difficult to optimize. The client partnered with NeenOpal to operationalize a Marketing Mix Modeling (MMM) framework, enabling data-driven revenue forecasting, dynamic sensitivity analysis, and interactive scenario planning through a Tableau dashboard.
Read case study
How a Leading Gold Loan Provider Eliminated Retention Guesswork with ML-Powered Churn Prediction
 Rohit Kannan
Our client is a leading financial institution based in Sri Lanka, providing specialised gold loan products across a retail network of more than 50 branches and serving an active customer base estimated in the hundreds of thousands. The business model is built around short-term, collateral-backed lending, where customer retention at loan maturity directly determines portfolio revenue. Despite years of accumulated transactional data across five core SQL Server tables, the organisation had no mechanism to convert that data into customer-level insight. NeenOpal partnered with the client to build and deploy a machine learning churn prediction system, alongside a customer scoring model and Tableau dashboards, enabling the organisation to shift from reactive, instinct-driven outreach to precision-targeted retention.
Read case study
From Dashboards to Conversations: AI-Powered Real Estate Analytics with Tableau Concierge
 Yash Khare
As analytics evolve, so do the ways business teams interact with data. Traditional dashboards require users to navigate filters, build calculations, and interpret visuals manually, a process that slows decision-making and creates dependency on data teams. NeenOpal explored the capabilities of Tableau Concierge, part of the Tableau Next vision, by building an interactive real estate analytics experience that allows users to simply ask questions and get instant, visual answers powered by generative AI.
Read case study
Unifying Marketing, CRM, and Revenue Analytics Using HubSpot, GA4, BigQuery, and Power BI
 Raghav Kedia
A group of real estate–focused service businesses partnered with NeenOpal to unify their marketing, CRM, and revenue analytics. Data was fragmented across platforms like HubSpot, GA4, and advertising tools, making it difficult to track how marketing efforts translated into leads and revenue. NeenOpal designed an integrated analytics ecosystem using HubSpot, GA4, BigQuery, Coupler.io, and Power BI to create a scalable, reliable, and decision-ready reporting layer without disrupting the existing stack.
Read case study