
Overview
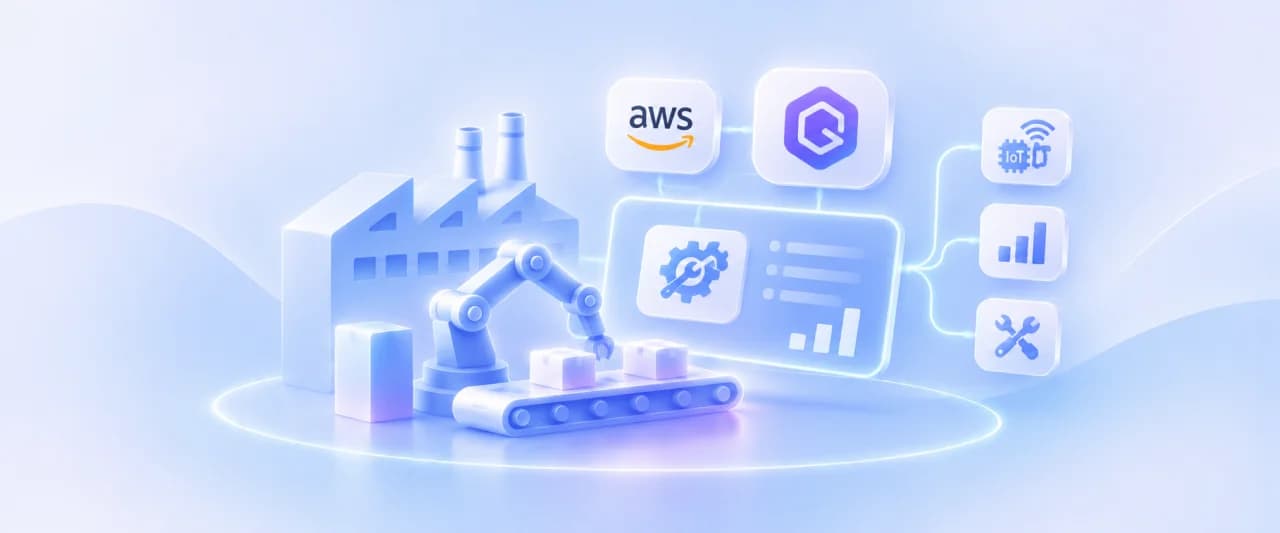
To modernize asset maintenance operations in a manufacturing setup, NeenOpal implemented an AWS-based system using Amazon Q Business. This solution empowers technicians to query equipment issues conversationally, access IoT and document data, and trigger work orders instantly. By integrating AWS IoT SiteWise, S3, Lambda, and Grafana, the project delivers real-time observability, faster diagnostics, and AI-driven insights accelerating asset uptime and operational efficiency across the plant.
- 70%
- Reduction in Diagnostic Testing Time
- 100%
- Work Order Traceability via Secure API
- 5x
- Increase in Operator Self-Service Queries
- 20+
- Advanced Real-Time Telemetry Sensors
Customer Challenges
Traditional maintenance systems lacked real-time visibility, intelligent search, and automation, leading to delays, inefficiencies, and a heavy reliance on IT teams for support. The following issues were key bottlenecks:

Disconnected Maintenance Knowledge Base
Maintenance records in S3 and tribal knowledge were unstructured and inaccessible without deep searching, slowing issue resolution during asset breakdowns.

Lack of Real-Time Equipment Insights
Teams had no centralized view of sensor telemetry from IoT devices, leading to delayed decisions and inefficient root cause analysis.

Manual Workflows Delayed Response
Operators couldn’t trigger or track work orders instantly, causing lag in repair cycles and impacting production SLAs.

High Learning Curve for Tools
Users weren’t familiar with querying data sources like SiteWise or S3 directly, leading to dependency on IT for insights.

Scattered Observability Infrastructure
Monitoring across CloudWatch, X-Ray, and logs wasn’t unified, limiting visibility into end-to-end system health and usage metrics.
AWS Architecture for Conversational Maintenance Insights
Amazon Q, IoT SiteWise, and cloud services integrate asset telemetry, maintenance records, and automated workflows.

Solutions
NeenOpal developed a conversational, production-ready solution by combining Amazon Q, AWS IoT, and serverless APIs for seamless, intelligent maintenance operations:
Conversational AI for Maintenance Teams
Amazon Q Business was configured with role-based access, enabling natural queries like “What’s wrong with Pump #3?” or “Show downtime logs from last week.” S3-based document connectors and plugin integrations allowed real-time asset information and repair records to be accessible in Outlook or Slack, streamlining communication across shifts.
Integrated IoT Data Monitoring
A simulated Python-based telemetry generator was set up for AWS IoT SiteWise to simulate real-time data streams. These signals fed into Amazon Q Business for proactive alerting and condition-based queries. Sensor thresholds and trends were monitored for actionable triggers to reduce equipment failure risks.
Lambda APIs for Smart Actions
NeenOpal designed lightweight Lambda functions behind API Gateway to allow conversational triggers to open work orders, escalate issues, and fetch past resolution data. These APIs integrated tightly with Q plugins, creating a fluid command-to-action pipeline without leaving Slack or Teams.
Production-Ready Observability Stack
In production, Amazon CloudWatch, AWS X-Ray, and Grafana were configured to monitor Q’s query performance, API latency, and plugin usage. IAM policy audits ensured access was secure and aligned with site-level operational roles. This gave stakeholders complete confidence in performance and uptime.
Services
 AWS Lambda
 Amazon Q Business
 Amazon IoT SiteWise
 Amazon S3
 Amazon API Gateway
 Amazon CloudWatch
 AWS X-Ray
 IAM Identity Center
 Grafana
Benefits

Faster Diagnostics & Reduced Downtime
Conversational AI and real‑time IoT telemetry cut diagnostic time by 70%, enabling proactive maintenance and minimizing costly production stoppages.

Streamlined Workflows & Higher Efficiency
Automated work order creation via Lambda APIs and Q plugins ensures instant response, complete visibility, full accountability, and 100% traceability, eliminating all manual delays.

Enhanced Operator Control and Empowerment
Self‑service natural language queries increased operator independence 5x, reducing reliance on IT teams for insights and accelerating on‑floor decisions.

Unified Observability and Secure User Access
A centralized monitoring stack with CloudWatch, X‑Ray, and Grafana improved system health visibility, while IAM role‑based access safeguarded operations.

Scalable, Production‑Ready Architecture
Modular AWS design integrates seamlessly with existing tools (Slack, Outlook, Teams), supporting future expansion across multiple plants and assets.
Conclusion
By blending Amazon Q Business with IoT SiteWise and custom APIs, NeenOpal transformed how maintenance teams interact with data. The project demonstrated that conversational AI can go beyond office use enabling critical, production-level insights at manufacturing scale without sacrificing control or security.
FAQ
Frequently Asked Questions About AI-Powered Asset Maintenance on AWS
How are work orders triggered through conversational AI?
Lambda functions integrated via API Gateway allow technicians to create, escalate, or track work orders directly through Amazon Q plugins in Slack, Teams, or Outlook—ensuring instant action without manual workflows.
Is the solution secure for production environments?
Absolutely. IAM role-based access, CloudWatch monitoring, AWS X-Ray tracing, and audit controls ensure secure, compliant, and production-ready deployment aligned with operational governance standards.
How does the system provide real-time equipment visibility?
IoT telemetry streams into AWS IoT SiteWise, where threshold monitoring and trend analysis enable proactive alerts. These insights are accessible through conversational queries in Amazon Q.
Authors



Case studies
Related case studies

How a Global Agricultural Equipment Manufacturer Built a Trusted Web Analytics Platform with GA4, Snowflake, and Power BI
Our client is a leading manufacturer of agricultural and industrial equipment operating across international markets, with a B2B sales model distributed through an authorised dealer and reseller network. The client's website serves as a primary discovery and research channel for prospects and distributors, where meaningful conversion actions centre on product brochure and playbook downloads rather than direct online transactions. Despite access to Google Analytics 4, the client had no reliable mechanism to trust or act on its own web data, with sampled GA4 reporting, undefined conversion events, and the absence of a structured data pipeline meaning internal stakeholders were making website and content decisions without confidence in the underlying numbers. NeenOpal partnered with the client to rebuild the analytics data foundation from the ground up, engineering a modern pipeline from GA4 through BigQuery into a multi-layer Snowflake data warehouse, and delivering a suite of Power BI dashboards that provided trusted, unsampled website intelligence for the first time.
Read case study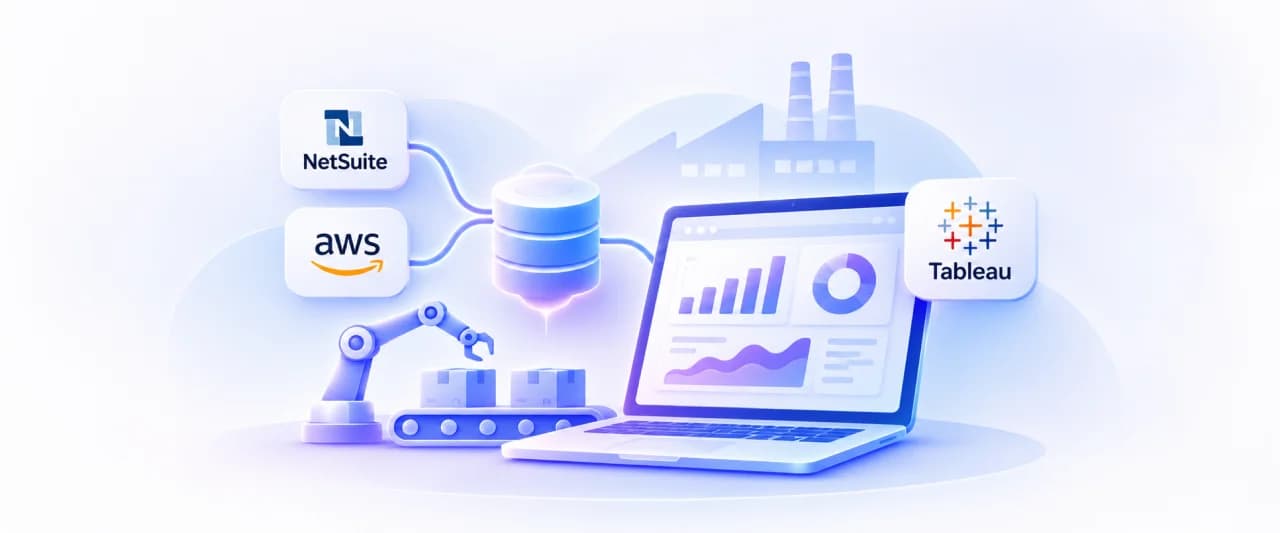
Streamlining Insights: Leveraging NetSuite Data with AWS and Tableau for Manufacturing Sector
Our client, a global leader in the manufacturing sector specializing in welding consumables and machinery, operates in over 100 countries with a network of more than 30 subsidiaries, delivering exceptional service and support worldwide. To enhance their operations, NeenOpal designed Tableau dashboards currently utilized across four regions and 26 countries, supporting a geographically diverse user base.
Read case study
Building a Validated Conversational Sales Analyst on Amazon Quick for a Managed IT Provider
Our client, a managed IT services provider delivering all-inclusive computer, internet and help desk support to small and mid-sized businesses, already monitored sales opportunities across eight funnel stages in an established Power BI dashboard. Answering deeper questions about stage duration, win rates and trends still meant stacking filters and interpreting the resulting measures. NeenOpal extended that environment with a conversational AI Analyst Agent built on Amazon Quick, connected to the client's opportunity stage funnel dataset in Amazon RDS. Teams now ask questions in plain language and receive summaries, charts and the supporting SQL, cutting the time to a routine answer by 75% and the number of analysis steps by 60%. The depth sits in the foundation: a curated opportunity-stage data model, documented business rules, and answers reconciled with the existing Power BI dashboard month by month and filter by filter, which matched on every indicator tested. Power BI stays exactly where it was.
Read case study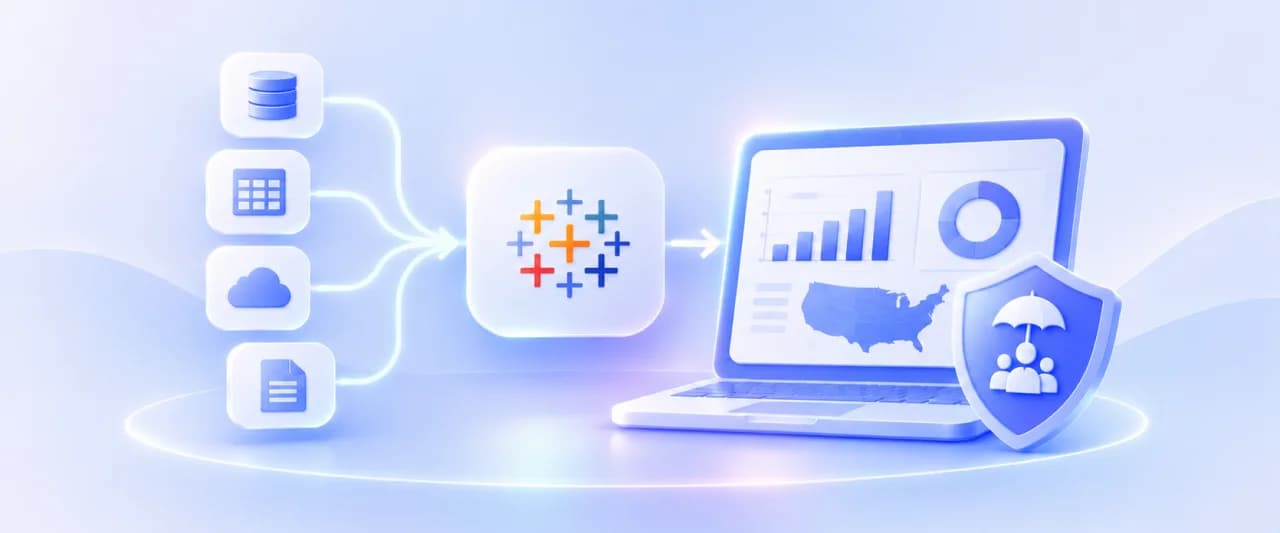
Tableau Dashboard Development for a US Insurance Organization: 4 Data Sources Unified
Our client, an insurance organization with field teams spread across every US state, partnered with NeenOpal to replace a manual, spreadsheet-driven reporting process with a consolidated Tableau dashboard environment governed by row-level security. Operational data lived in four separate systems covering Airtable, Salesforce, Google Analytics 4, and Google Search Console, and bringing them together meant exporting and stitching the data by hand, which left leadership without a single reliable view of performance. NeenOpal consolidated all four sources into an Azure SQL Server layer, reviewed and corrected the data quality issues that surfaced along the way, and delivered three Tableau dashboards across seven screens that refresh automatically every day. Row-level security was implemented across all fifty states and the independent districts, driven by an entitlement model the client maintains through a single Google Sheet, so every representative sees the states they are responsible for and nothing more.
Read case study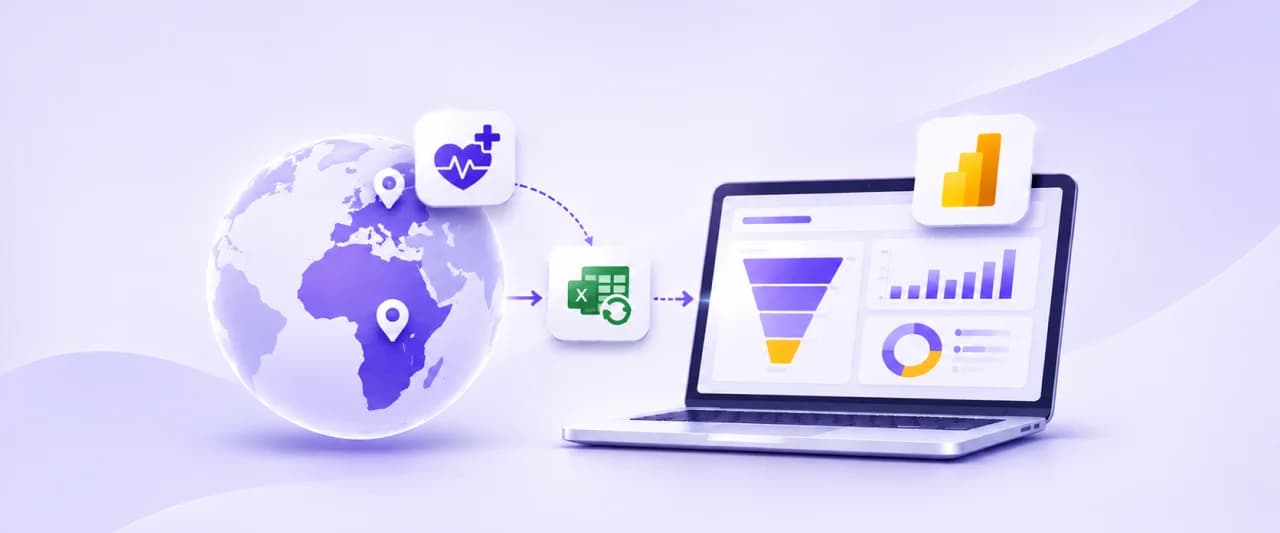
Unifying Multi-Region Sales Pipeline Analytics with Power BI and Power Query
Our client, a global healthcare company with commercial operations across Africa and Western Europe, partnered with NeenOpal to build a unified sales pipeline dashboard spanning more than six regional teams across two continents. Pipeline data was managed in isolation by each region, reported in inconsistent formats, and pulled from different systems including Salesforce and SAP, leaving leadership without a consolidated view of opportunities, orders, and revenue. NeenOpal designed and delivered a centralized sales pipeline dashboard in Power BI, powered by an automated Excel and Power Query ETL layer, that standardizes data from every region into one live view. The solution tracks each opportunity from lead to shipped order, benchmarks performance against multiple internal targets, forecasts revenue from existing customers, and lets non-technical users refresh the entire report in one to two clicks.
Read case study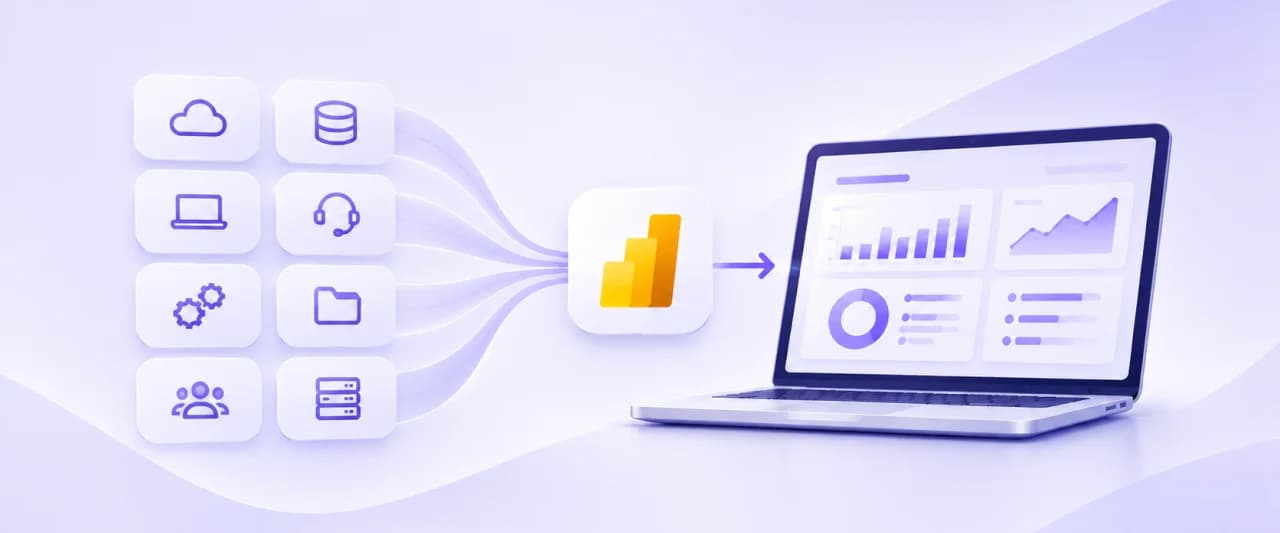
Unifying Eight Disconnected Business Systems into Centralized Power BI Dashboards
Our client, a managed technology services provider (MSP), partnered with NeenOpal to replace a fragmented, siloed reporting process with a centralized Power BI dashboard environment. Business-critical data was scattered across multiple disconnected systems, from the CRM and PSA to the service desk, client surveys data, and network monitoring tools, leaving leadership without a single view of sales, customers, operations, or the workforce. NeenOpal designed and delivered a centralized Power BI reporting solution that unifies data from all of these sources into an automated, daily-refreshed analytics layer on AWS. By ingesting each source, staging it in a PostgreSQL warehouse, and modeling it into governed Power BI dashboards across every business function, the team turned manual, spreadsheet-bound reporting into interactive, self-service insight the client can filter and act on in seconds.
Read case study