

Overview
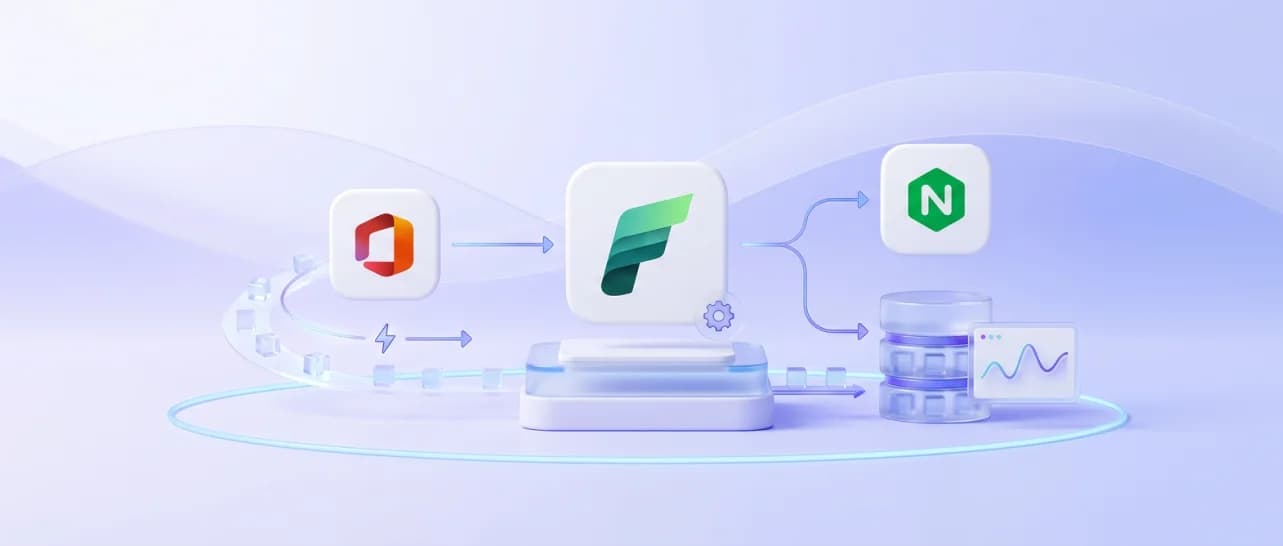
A leading EdTech company partnered with our data engineering team to modernize their data pipeline infrastructure. The client faced delays in data availability, limited real-time insights, and difficulties scaling analytics and machine learning workloads due to their traditional batch-oriented ETL pipelines. To overcome these challenges, they aimed to implement a streaming-first, unified data architecture using Microsoft Fabric and its Streaming capabilities to Onelake Lakehouse.
- 700+
- Enterprise Tables Integrated
- 60M
- Records Ingested per Hour
- 45%
- Reduced Manual Effort
- 27%
- Operational Cost Reduction
Customer Challenges
The client’s existing data infrastructure created several obstacles that limited efficiency, scalability, and compliance. To address these challenges, the client required a scalable, streaming-first architecture built on Microsoft Fabric, providing end-to-end support for ingestion, transformation, and secure delivery of data.

Scalable Data Sharing
Lack of a unified platform made it difficult to share data across teams and systems efficiently.

Latency in Data Availability
Traditional batch ETL pipelines delayed the delivery of critical data, slowing time-sensitive decision-making.

Limited Real-Time Analytics
Inability to process streaming data restricted live insights for educators and administrators.

Challenges in Machine Learning Experimentation
Disjointed pipelines and delayed data hindered iterative ML model development and testing.

Compliance & Data Privacy
Managing sensitive student information was complex, with no streamlined approach for secure data handling.
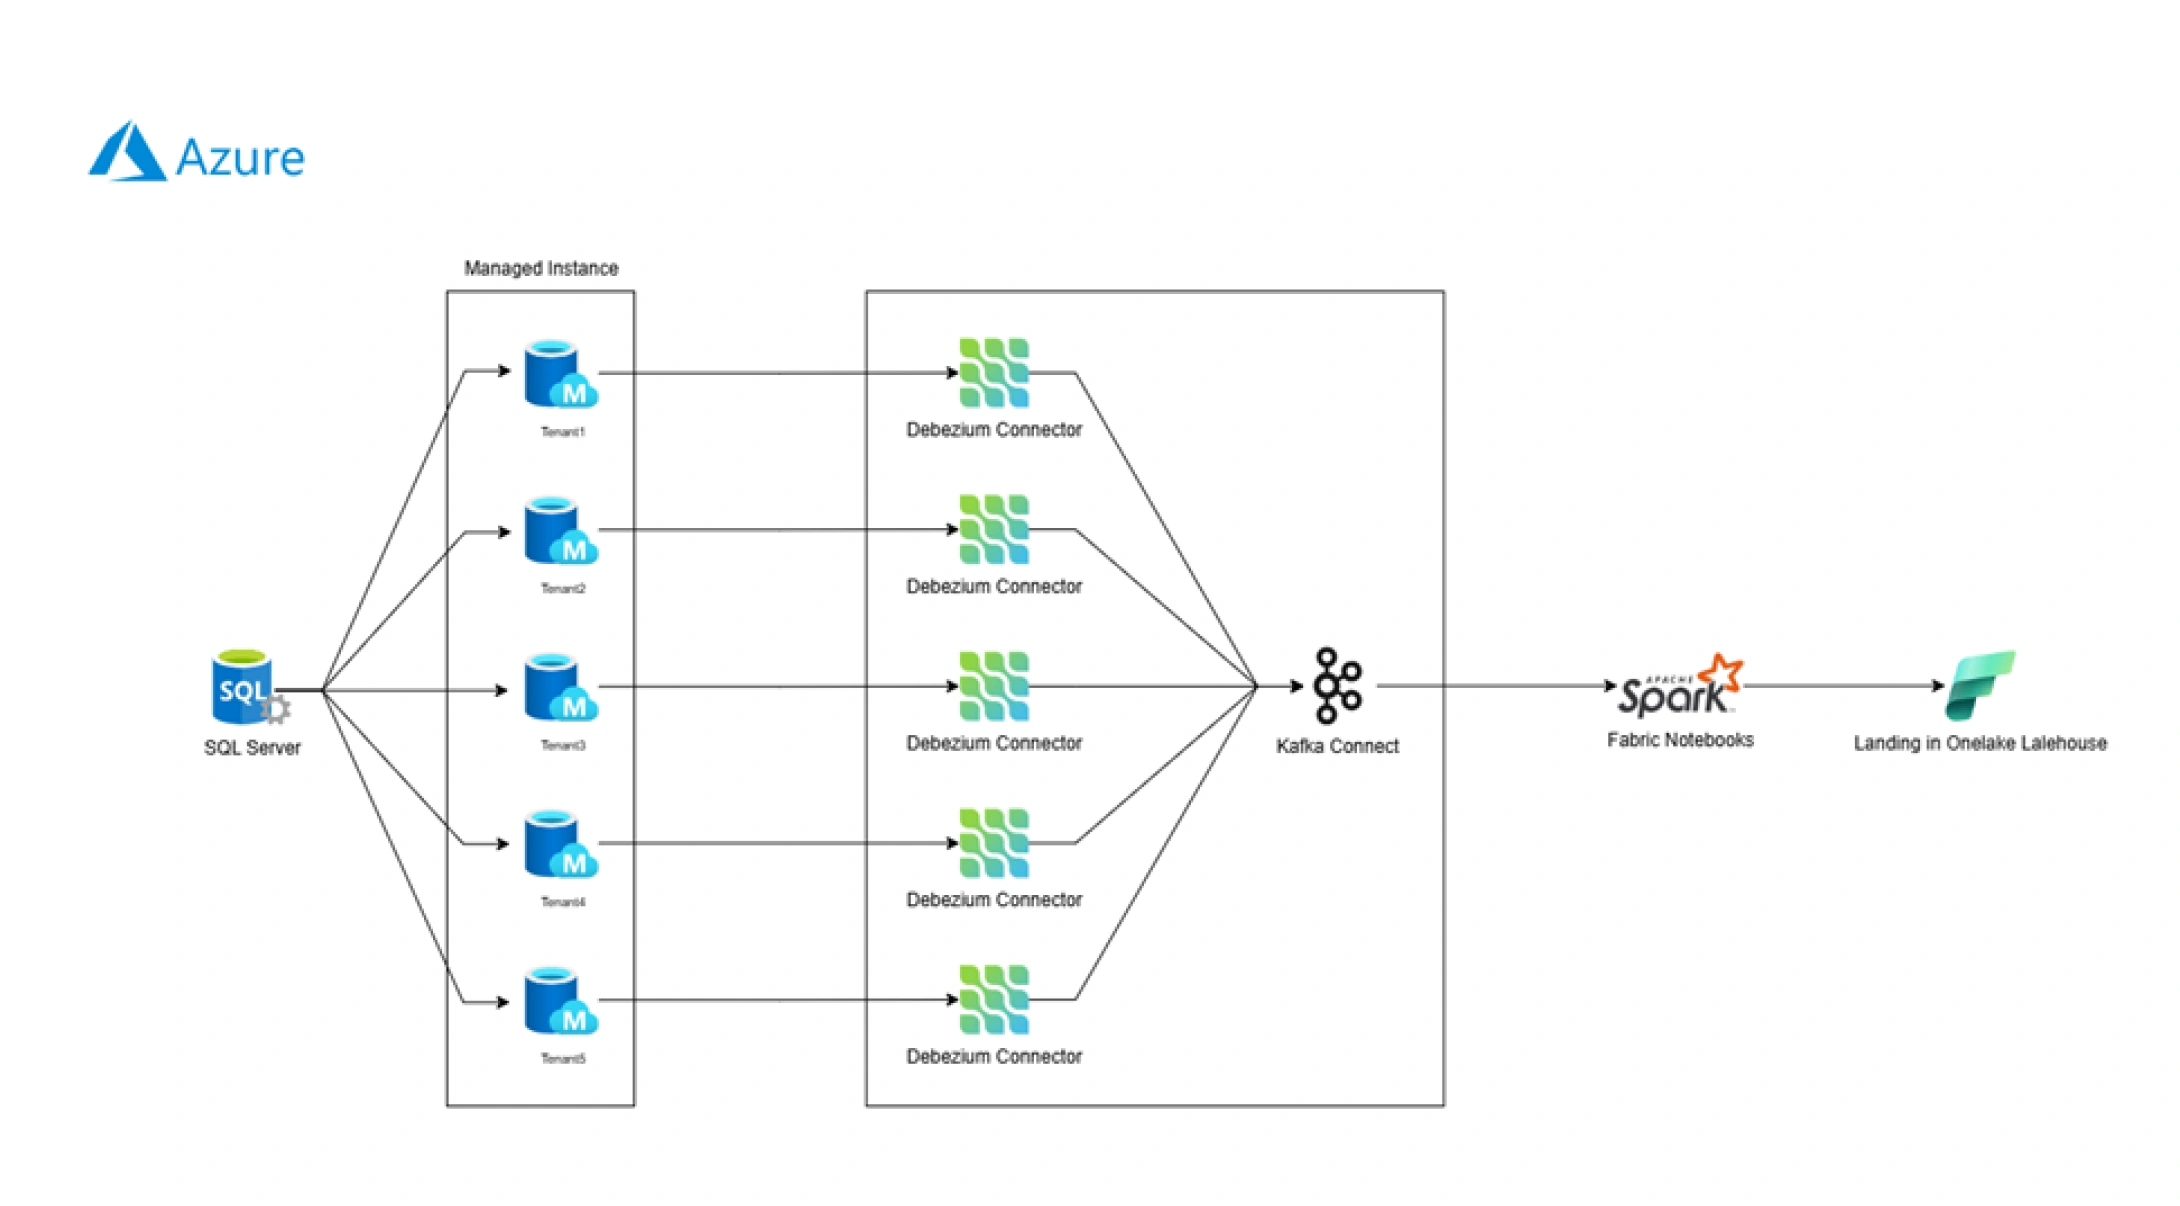
Microsoft Fabric Streaming Architecture for Real-Time Analytics
A streaming-first architecture that ingests data from multiple SQL Server sources into OneLake Lakehouse for real-time analytics and scalable data processing.
Solutions
Our team designed and implemented a robust streaming data pipeline to ingest, process, and deliver real-time data from over 700 SQL Server tables from multiple databases into Microsoft Fabric’s OneLake Lakehouse. The architecture was built using the following key components
Real-Time Data Ingestion
Kafka and Debezium were used to capture Change Data Capture (CDC) events from SQL Server databases. These events were published to Kafka topics in real-time, enabling continuous data flow from multiple sources without relying on batch processing.
Microsoft Fabric Streaming Integration
The Kafka topics were seamlessly integrated with Microsoft Fabric Streaming Dataflows, which streamed the data directly into OneLake Lakehouse. This integration ensured near real-time availability of raw data, allowing downstream analytics and reporting to be continuously updated.
Data Transformation & Schema Evolution
A multi-layered data architecture was implemented, following a Raw → Bronze transition using Microsoft Fabric’s transformation tools. Schema evolution logic was added to automatically handle changes in source systems, eliminating the need for manual intervention and preventing pipeline downtime.
Data Obfuscation for ML Use Cases
Data masking and obfuscation techniques were applied during transformation to protect sensitive information. This approach enabled secure data sharing with internal machine learning teams, accelerating model development workflows while maintaining compliance and data privacy.
Services
 Microsoft Fabric
 Apache Kafka
 Debezium
 SQL Server
 Data Obfuscation Frameworks
Benefits

Standards-Compliant Architecture
Modular pipeline design using Fabric services enables quick onboarding of new datasets and reduces third-party reliance.

Operational Efficiency Gains
Native Fabric services streamline ingestion, transformation, and storage, improving cost efficiency and consolidating infrastructure.

Streaming Unified Data Platform
Integrated pipelines across SQL Server databases enable near real-time access to transactional and historical datasets.

High-Throughput Ingestion
Ingested millions of records per hour using Microsoft Fabric Streaming, dramatically reducing data latency compared to legacy batch pipelines.

Real-Time Data for ML & Analytics
Transformed and obfuscated data is now available within an hour, accelerating machine learning and analytical workflows.

Automated Schema Evolution
Dynamic schema logic handles frequent source changes, reducing manual engineering effort and maintenance overhead.

Secure Data Sharing
Built-in obfuscation allows safe sharing of sensitive data with internal Machine Learning teams while maintaining compliance.
Conclusion
This case study demonstrates how organizations can leverage Microsoft Fabric Streaming to build modern, secure, and scalable real-time data pipelines. With minimal latency, robust schema handling, and data privacy controls, the solution has laid the groundwork for advanced analytics and AI use cases within the organization.
FAQ
Frequently Asked Questions (FAQs) About Real-Time Data Ingestion Using Microsoft Fabric
How does the solution ensure data privacy and compliance?
Data masking and obfuscation techniques are applied during transformation. This protects sensitive student information while allowing secure access for analytics and internal machine learning teams.
Can this architecture scale for high-volume enterprise data?
Yes. The architecture is designed for high-throughput ingestion (millions of records per hour). It supports hundreds of enterprise tables and can easily onboard new datasets with minimal reconfiguration.
How does this improve machine learning experimentation?
With near real-time, transformed, and obfuscated data available within an hour, data science teams can iterate models faster, test hypotheses efficiently, and reduce experimentation cycles significantly.
Authors



Case studies
Related case studies
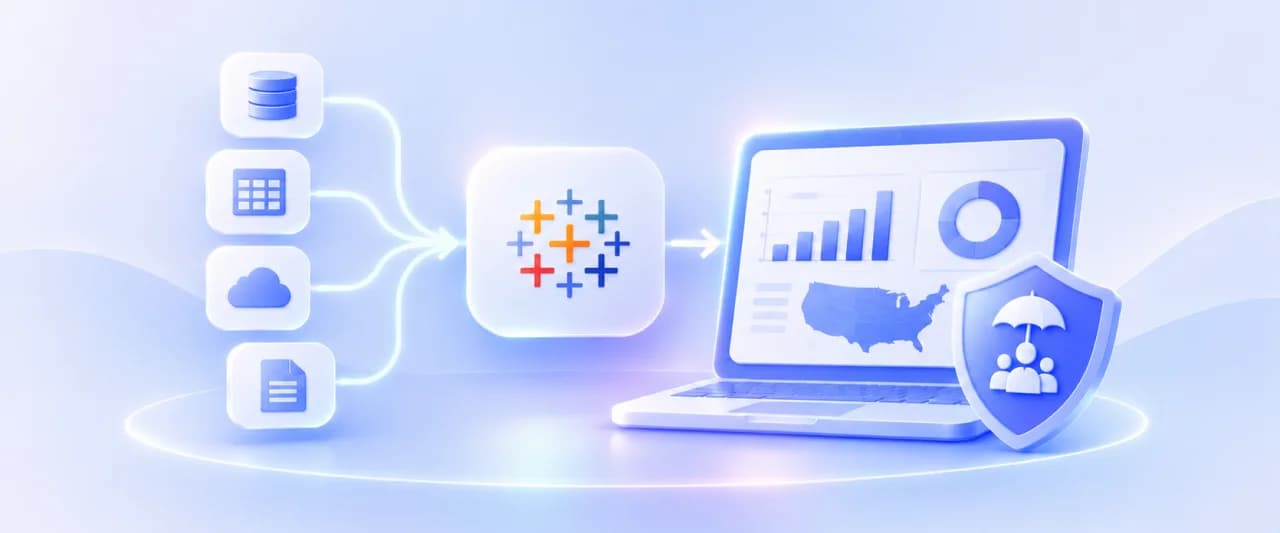
Tableau Dashboard Development for a US Insurance Organization: 4 Data Sources Unified
Our client, an insurance organization with field teams spread across every US state, partnered with NeenOpal to replace a manual, spreadsheet-driven reporting process with a consolidated Tableau dashboard environment governed by row-level security. Operational data lived in four separate systems covering Airtable, Salesforce, Google Analytics 4, and Google Search Console, and bringing them together meant exporting and stitching the data by hand, which left leadership without a single reliable view of performance. NeenOpal consolidated all four sources into an Azure SQL Server layer, reviewed and corrected the data quality issues that surfaced along the way, and delivered three Tableau dashboards across seven screens that refresh automatically every day. Row-level security was implemented across all fifty states and the independent districts, driven by an entitlement model the client maintains through a single Google Sheet, so every representative sees the states they are responsible for and nothing more.
Read case study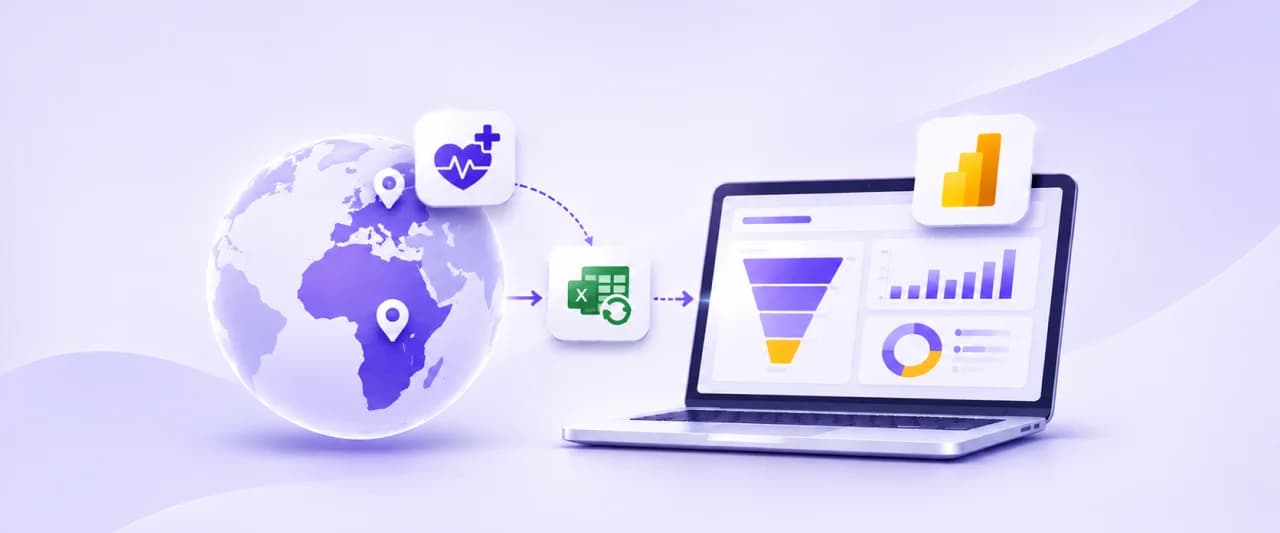
Unifying Multi-Region Sales Pipeline Analytics with Power BI and Power Query
Our client, a global healthcare company with commercial operations across Africa and Western Europe, partnered with NeenOpal to build a unified sales pipeline dashboard spanning more than six regional teams across two continents. Pipeline data was managed in isolation by each region, reported in inconsistent formats, and pulled from different systems including Salesforce and SAP, leaving leadership without a consolidated view of opportunities, orders, and revenue. NeenOpal designed and delivered a centralized sales pipeline dashboard in Power BI, powered by an automated Excel and Power Query ETL layer, that standardizes data from every region into one live view. The solution tracks each opportunity from lead to shipped order, benchmarks performance against multiple internal targets, forecasts revenue from existing customers, and lets non-technical users refresh the entire report in one to two clicks.
Read case study
Optimizing Vendor Metadata for Enhanced Content Discoverability
Our client, a prominent entertainment company, offers a unique blend of streaming and on- demand content, integrating material from cable, satellite, and streaming platforms. They work with several vendors to receive content metadata. The main objective of this project was to evaluate the vendor metadata provided for various programs against predefined benchmarks to assess its accuracy and reliability.
Read case study
Optimizing Solar Reporting with Power BI to Tableau Migration
Our client, a leading solar energy company in the USA, uses advanced technology to improve efficiency and decision-making. After being acquired by a parent company using Tableau, they needed to migrate all reports from Power BI to Tableau. They also faced challenges in tracking the usage and adoption of both new and existing dashboards and needed a solution to monitor these metrics effectively.
Read case study
Transforming Workforce Scheduling with Microsoft Azure and Power BI
Our client, a Seattle-based leading firm in employee scheduling software, specializes in shift-based workforce scheduling solutions. Their platform helps businesses streamline scheduling, adapting smoothly to changing demands. With NeenOpal’s expertise, they wanted to consolidate data from multiple sources including Salesforce, Quickbooks into Azure SQL database, offering clear visual insights for smarter decision-making and optimizing workforce scheduling.
Read case study
Building a Validated Conversational Sales Analyst on Amazon Quick for a Managed IT Provider
Our client, a managed IT services provider delivering all-inclusive computer, internet and help desk support to small and mid-sized businesses, already monitored sales opportunities across eight funnel stages in an established Power BI dashboard. Answering deeper questions about stage duration, win rates and trends still meant stacking filters and interpreting the resulting measures. NeenOpal extended that environment with a conversational AI Analyst Agent built on Amazon Quick, connected to the client's opportunity stage funnel dataset in Amazon RDS. Teams now ask questions in plain language and receive summaries, charts and the supporting SQL, cutting the time to a routine answer by 75% and the number of analysis steps by 60%. The depth sits in the foundation: a curated opportunity-stage data model, documented business rules, and answers reconciled with the existing Power BI dashboard month by month and filter by filter, which matched on every indicator tested. Power BI stays exactly where it was.
Read case study