
An AI agent for sales funnel analysis lets a sales leader type a pipeline question in plain English and get back the answer, with supporting tables and charts where relevant. We built one, the Funnel-Agent, on Amazon Quick for a US-based managed IT services provider whose sales team spent too long working through dashboard filters to answer everyday questions.
Previously, getting specific insights required applying multiple filters and exploring different combinations, such as filtering by owner, opportunity stage, duration, or closed opportunity status. Even a common query like "What's the median opportunity duration this quarter?" took several steps. Now sales leaders type the question into Amazon Quick and get the insight straight away, with numbers that match the dashboard they already trust. Questions that used to wait up to two business days for an analyst now come back in about two minutes.
Below, we cover what the agent adds on top of a dashboard, how we built the context layer that keeps its answers in line with Power BI, the two challenges we solved to make its numbers dependable, and what changed for the sales team.
What Does an AI Agent for Sales Funnel Analysis Do?
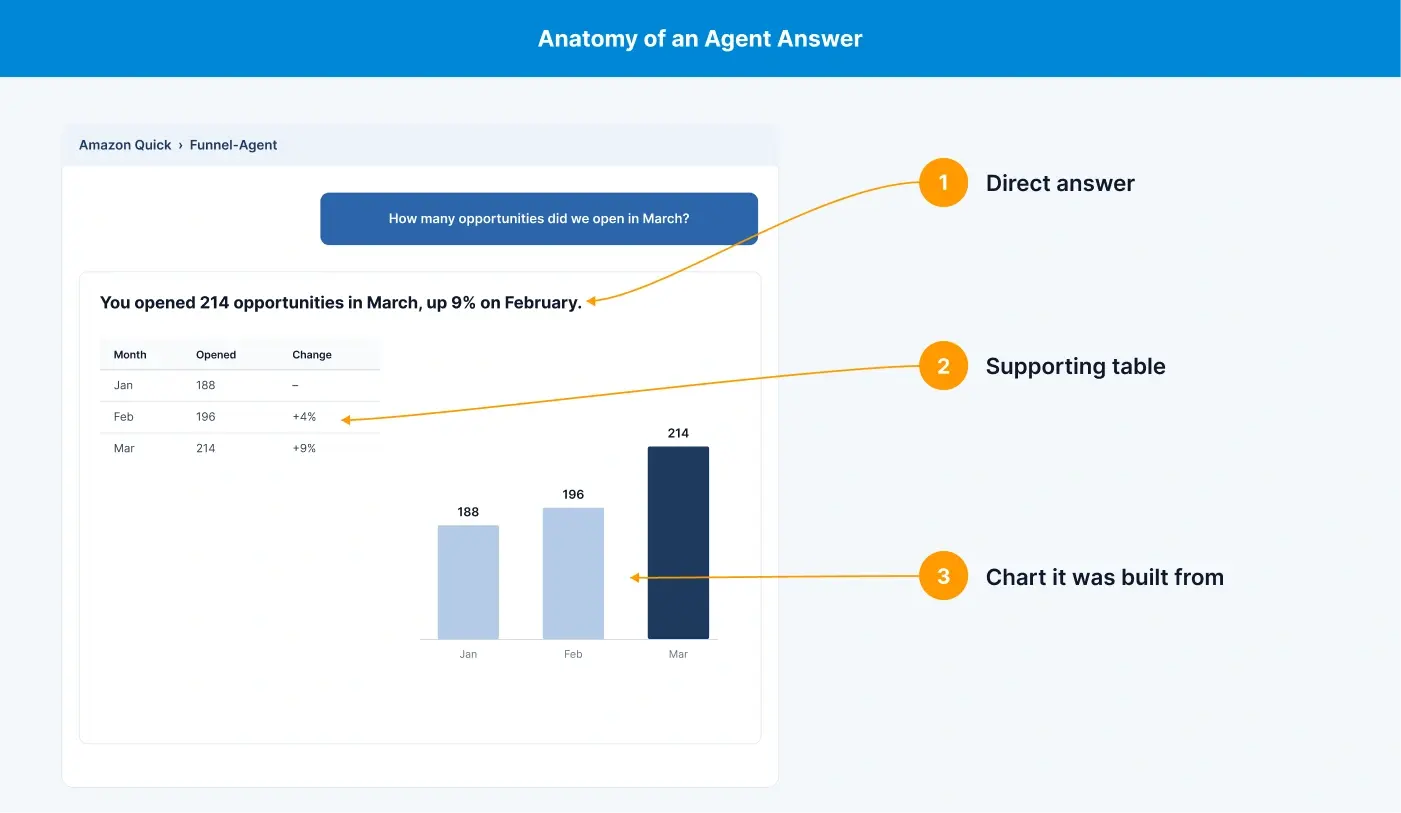
An AI agent for sales funnel analysis is a chat assistant connected to your CRM and BI data. Ask it how many opportunities opened in Q2 and you get the number, along with the supporting table and chart where relevant. It works on the same CRM and BI data as the client's dashboard and turns a typed question into a finished piece of analysis: the number, the data behind it, a chart where it helps, and the logic used to get there.
In practice, that gives the sales team five things a dashboard alone doesn't:
1. Ask Plain-English questions instead of hunting dashboard filters
Take the median opportunity duration for last quarter. In a filter-heavy Power BI dashboard, you'd set the date slicer, go looking for the visual that shows duration, and then check you've got the median measure and not the average. And in case you want it by month instead, you'll need to go back to the filters.
A natural language query over business data removes those steps. Users type the question as they would ask a colleague. The agent maps it to the right fields and KPI logic, so SQL, field names, and the data model never come up.
2. Get the answer with supporting tables and charts
Every reply leads with a direct answer, then backs it up. Where relevant, a supporting table shows the underlying data behind the figure and a chart shows the trend or breakdown. A sales leader asking which deals are stuck sees the deals themselves instead of just a count.
3. Drill down with follow-up questions
Pipeline questions tend to arrive in a chain. First it's total opportunities this quarter, then just March, then the median duration for those deals. Because the agent keeps track of what was already asked, each follow-up picks up where the last answer left off, which is what makes it an AI analyst for sales pipeline work rather than a search box on top of a dashboard.
4. See the logic behind every number
Applicable replies come with a SQL/explanation view that shows the query and logic behind the answer. Sales leaders can see exactly what was counted, and an analyst can verify any figure in minutes instead of rebuilding it from scratch.
5. Take routine data requests off analysts' plates
Business users no longer need someone who can write SQL to get deeper insights. Chat answers questions about specific owners, stages, or time periods, so analysts spend less time on one-off data pulls and sales leaders stop waiting on requests.
Starting Point: A Sales Funnel Dashboard Too Complex for Self-Service
We had built a Sales Funnel dashboard in Power BI for the client, and it held everything the sales team needed. Users could easily view the default metrics. Getting specific insights was harder because it often meant navigating multiple filters and combinations in one of their most complex reports.
This is a common place where self-service sales analytics fail to perform. Deeper questions about owners, opportunity stages, or time periods were challenging to explore, so most users stayed on the default view.
The knock-on effect was that a slipping deal often surfaced later rather than when it first lost momentum.
Why we started with the hardest dashboard
“We picked the Sales Funnel dashboard because it was the hardest one in the estate with the most metrics, filters that interact, and the heaviest reliance on analysts. If the agent held up there, every simpler dashboard would be a smaller step” — Abhinav Sinha (Senior Associate Consultant, NeenOpal)
Complex dashboards are often the first sign that a reporting setup needs rethinking. See how we approach Power BI consulting for teams that have outgrown their reports.
What Power BI Answers Today, and Where Amazon Quick Comes In
Power BI is very good at the questions its visuals were built for. It struggles with the ones nobody planned a view for. Here is how that split looked on this dashboard.
|
Type of Question |
Example |
Power BI Dashboard Today |
Funnel-Agent on Amazon Quick |
|---|---|---|---|
|
Default KPIs |
“How many opportunities are open right now?” |
Answered on the default view |
Answered in one reply |
|
A KPI under a new mix of filters |
“Median duration of Stage 3 deals owned by the East team, opened in Q2?” |
Possible, but takes several slicer and filter steps |
Answered in one reply |
|
A chain of follow-ups |
“Now just March. Now only closed-lost.” |
Reset and reapply filters for each step |
Scope carries over from the last question |
|
An explanation of a number |
“Why is the average so much higher than the median?” |
Shows the figure, not the reasoning |
Returns the figure with the deals pulling it up |
The Solution: A Funnel-Agent Built as an Amazon Quick Chat Agent
For this client, we built our agent, the Funnel-Agent, using the custom chat agent feature in Amazon Quick, AWS's agentic AI workspace that brings together QuickSight dashboards, Spaces, research, and automation.
Quick is where users have the conversation. What makes the answers reliable and secure is the context layer we curated and the AWS data foundation we built beneath it.
|
Dimension |
Dashboard filtering |
Funnel-Agent on Amazon Quick |
|
How a question is asked |
Slicers, filters, and visual selection |
A plain-English question |
|
Skills needed |
Knowledge of the data model, measures, and filter interactions; SQL for anything off the dashboard |
Knowing the business question |
|
Time to answer |
Quick for views someone already built; anything new waits for an analyst, which may take 1 or 2 business days |
About 2 minutes, including questions no one has built a view for. The answer arrives in a single reply, with no request to raise. |
|
Follow-ups |
Change the slicers and filters for each new angle |
Type the next question; scope carries over |
|
Output |
Fixed visuals |
Direct answer plus supporting table and chart |
|
Checking a number |
Trace the measure back through the data model |
Open the explanation view to see the query and logic |
How We Built the Context Layer Behind the Agent
A chat agent is only as good as what it knows about the data. So before anyone asked a question, we built a context layer in Amazon Quick from three pieces, each with its own job.
-
Datasets hold the data: We prepared the funnel data (opportunities with owner, stage, status, and open and close dates) and defined calculated fields such as opportunity duration here. The agent starts from clean data with the KPI math already done, and row-level security on the dataset carries through to every answer.
-
Topics give the data meaning: A topic turns datasets into business vocabulary and sets the default date field, so “deals” means opportunities and “this quarter” filters on the right date.
-
Column settings tell how to read fields: Friendly names, descriptions, and synonyms map “stuck deals” or “time to close” to the right column. Default and blocked aggregations keep duration averaged, never summed. Columns the agent shouldn’t use are excluded.
The Amazon Quick space sets the boundary. It links only the funnel topics and datasets, so the agent answers from that data alone. That is why the agent and the dashboard return the same number.
The Challenges We Solved to Make Every Answer Trustworthy
Getting an AI agent to answer a question is easy. The hard part is getting it to understand what the user meant, fetch the same up-to-date data as the dashboard, and return the number the business trusts. If the answer is off, sales leaders go back to the dashboard.
On this project, two challenges could have quietly pushed the agent's answers away from the truth: KPI definitions and data refresh timing. Here is what each one means and how we solved it.
Challenge 1: Making the agent calculate KPIs exactly the way the business does
A KPI name alone may not tell the agent how to calculate it. For example, "Opportunity duration" depends on which opportunities are in scope, which filters apply, and which view of duration the user is asking for. If the agent's version differs from the dashboard's on any of these, it still returns a clean number, just not the one leadership expects.
How we solved it: We matched total opportunities and each of the four duration views (average, median, minimum, and maximum) to the calculation in the client's existing Power BI dashboard, including which opportunities fall in scope under each filter. We also mapped the everyday phrases sales leaders use, like "stuck deals" or "how long things take to close," to the right KPI in the context layer.
“Have sales leadership sign off on each KPI definition in writing before building anything. Most of our reconciliation effort went into agreeing what a number should mean, not into getting the agent to calculate it." — Abhinav Sinha (Senior Associate Consultant, NeenOpal)
Challenge 2: Keeping the agent in step with the Power BI refresh cycle
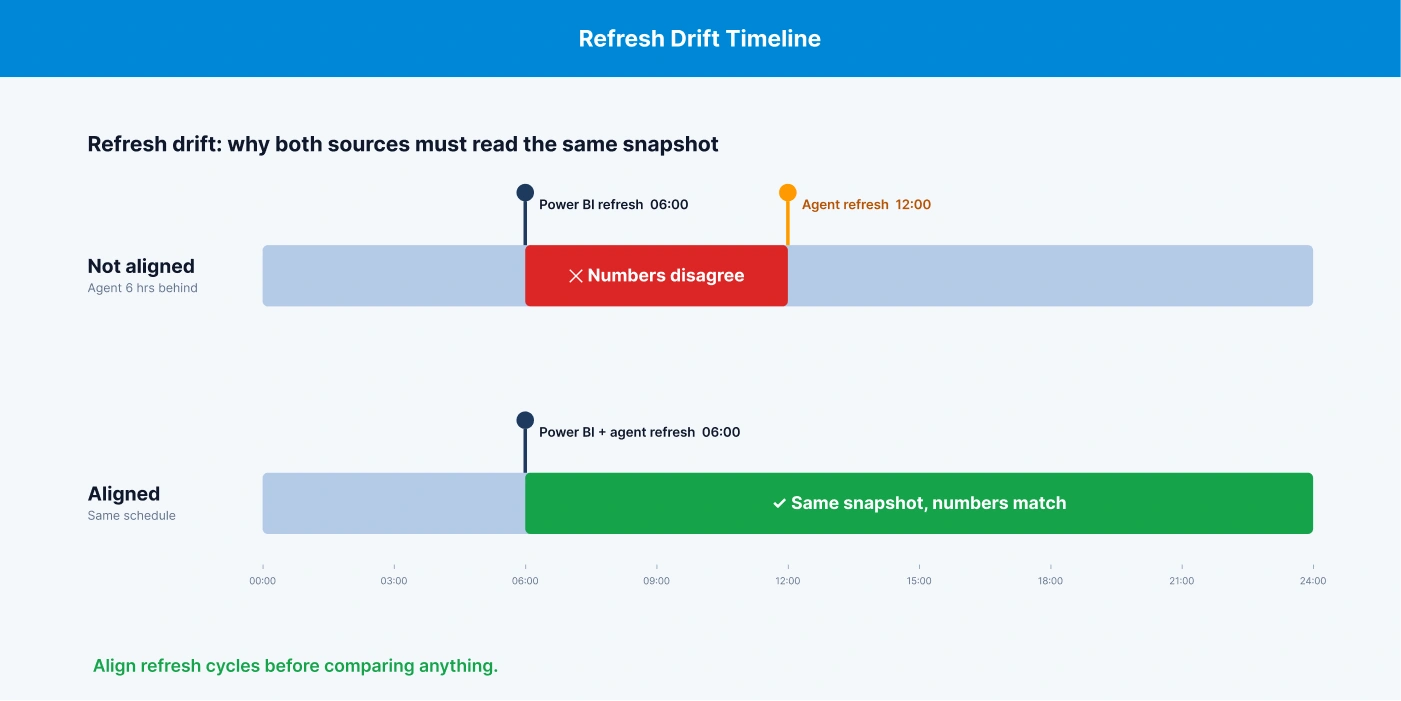
Even with the right logic, the agent and the dashboard will disagree if they read different snapshots of the data. Suppose Power BI refreshes at 6 a.m. and the agent's data updates at noon. Then a perfectly correct agent would still show a different number all morning, and users would side with the dashboard.
There is no standard timing to assume, either. Power BI allows up to eight scheduled refreshes a day on shared capacity and up to 48 on Premium, PPU, or Fabric capacity, so every dashboard runs on its own schedule.
How we solved it: We aligned the Quick data refresh with the dashboard's actual Power BI refresh schedule, so the agent and the dashboard always read the same snapshot and show the same numbers throughout the day.
Worth knowing before you scale: We checked one dashboard's KPI set, and that result doesn't carry over automatically. Each new dashboard or KPI added to the agent needs its own accuracy check before anyone relies on it.
Which AWS tools were used in the process?
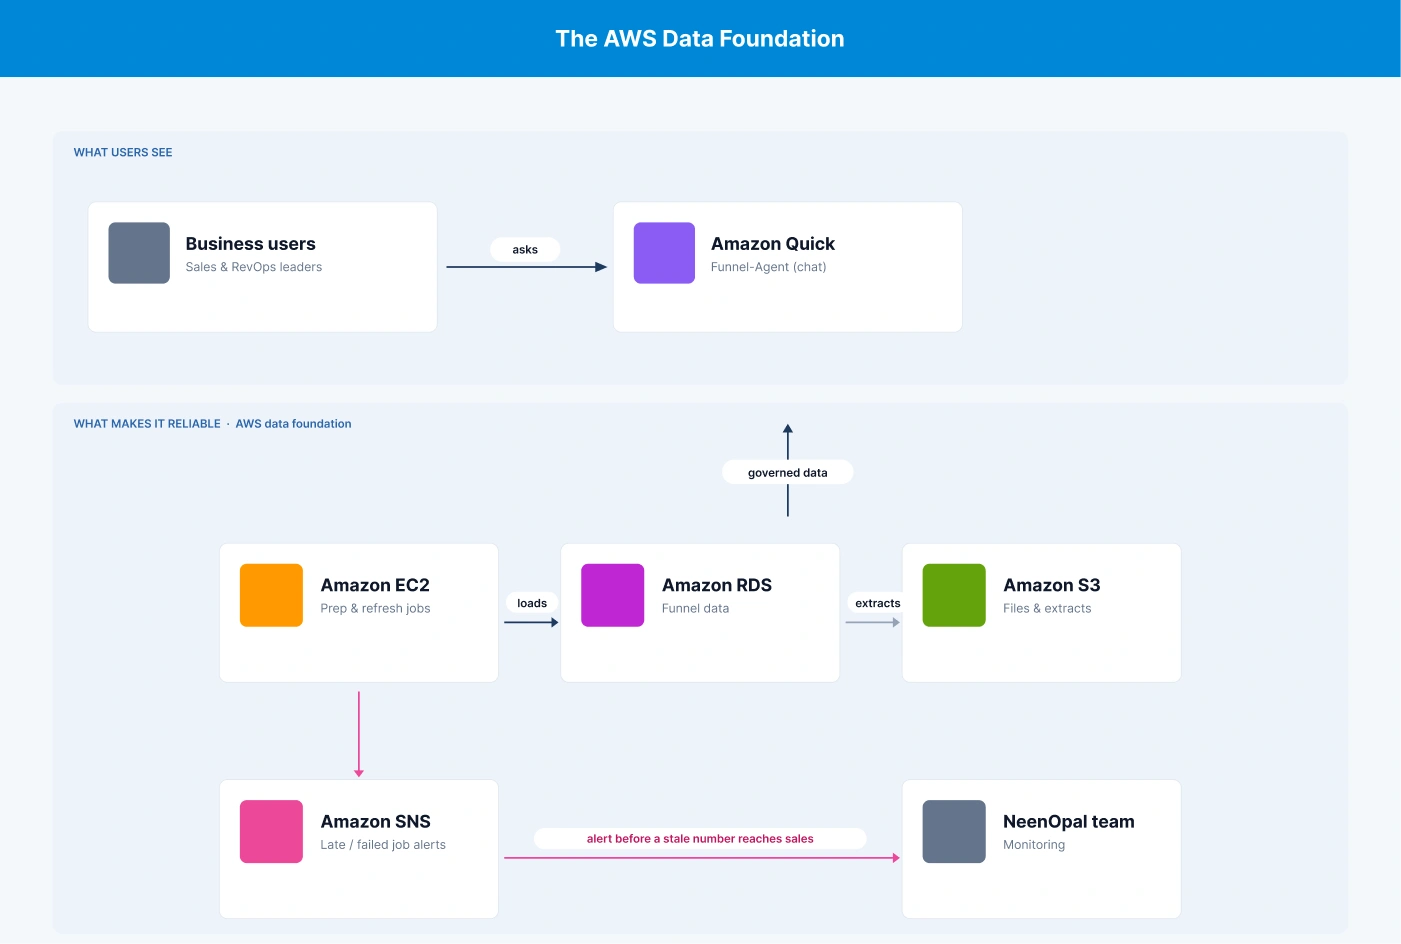
- Amazon Quick powers the conversational experience, so our team can ask questions and interact with our data using natural language.
- It's built on the AWS data foundation, using services including Amazon EC2, Amazon RDS, Amazon S3, and Amazon SNS.
So Quick gives us a simple way to interact with the data, while the AWS foundation underneath supports the solution's reliability and security.
How We Controlled Access to the Agent on AWS
Self-service shouldn't mean everyone can see everything. For the rollout, we set up individual AWS IAM users for user-level access, gave each one the Amazon Quick permissions they needed, and granted access to the Funnel-Agent explicitly. With individual identities, one person's access can be granted, reviewed, or revoked without touching anyone else's.
Agent sharing in Amazon Quick comes down to two roles. Owners can edit, share, use, and delete the agent; viewers can view and use it. Once launched, an agent stays private until its owner shares it.
Limitation: owner and viewer are the only roles, so the agent itself can't decide who sees which rows. That control has to sit in the data layer and permissions.
Standing up an agent that answers questions doesn't take long. Getting to answers your sales leaders will act on is the slower part. It needs KPIs everyone agrees on, a curated context layer, matched refresh cycles, and a secure data foundation, and that's the part we build.
Talk to our AWS analytics team.
Results: What Changed for the Sales Team
The Sales Funnel dashboard is still in place. What changed is how quickly the team gets from a question to a decision. The client's team points to three changes:
- Deeper answers without SQL: business users explore owners, stages, and time periods on their own instead of raising an analyst request for each question.
- Answers analysts can verify: every reply comes with a SQL/explanation view that shows the query and logic behind the number, so an analyst can verify an answer in minutes.
- Time back for decisions: less of the week goes on pulling numbers, more on decisions and customer relationships.
Is a Conversational AI Analyst Right for Your Team?
Not every dashboard needs one. Conversational BI pays off where a complex, filter-heavy report keeps analysts busy with requests, and where there's already a trusted system of record and agreed KPI definitions. That foundation matters more than the chat.
|
Your situation |
Honest Recommendation |
|
Users ask varied, follow-up-heavy questions of a complex dashboard |
Build an AI agent on top of it |
|
Questions are fixed and repeated every week |
Keep the dashboard on its own |
|
KPI definitions are disputed, or no reconciled source exists to validate against |
Fix the data and definitions first |
If you're deciding where to begin, look at which dashboard produces the most analyst requests. Start there, provided people already trust its KPIs.
Have a dashboard your team struggles to use? We will assess it for a conversational AI analyst on Amazon Quick: data readiness, KPI definitions, validation approach, and access design.
Frequently Asked Questions
1. What is an AI agent for sales funnel analysis?
An AI agent for sales funnel analysis is a chat assistant for pipeline questions. Ask it, in plain English, for something like median opportunity duration, and it answers with the figure plus a table and chart. Treat its answers as reliable only once its KPI definitions match your system of record.
2. Can an AI agent replace a Power BI dashboard?
No, and it doesn't need to. In our project, the dashboard stayed exactly where it was and remained the reference for every KPI. The agent adds a faster, conversational way into the same numbers.
3. How do you check if AI analytics answers are accurate?
Run the same questions through the agent and your BI tool for several months and filter combinations, then compare. Sort out refresh timing before you start, or a timing gap will look like a logic error.
4. What is Amazon Quick used for?
Amazon Quick is AWS's agentic AI workspace. Teams use it to ask questions of business data, build QuickSight dashboards, research, and automate work. You can also build custom chat agents for one domain, as we did for a sales funnel.
5. Do I need SQL to use Amazon Quick?
Not to ask questions; those go in as natural language. Setting up the data model, KPI definitions, and agent configuration is a different matter and still needs expert hands, along with validation.
6. Can an AI agent handle follow-up questions?
Yes. The Funnel-Agent keeps the scope of earlier questions, so users can go from a full quarter to a single month, or from a total to a median, without repeating themselves.
7. How to control access to an Amazon Quick agent?
Through user identities, Amazon Quick permissions, and agent sharing together. Agent sharing only has owner and viewer roles, so anything finer, like who sees which rows, belongs in the data layer and permissions.
8. Which dashboard should I turn into an AI agent first?
The most complex, most-requested one, as long as people already trust its KPIs. If the agent copes there, the simpler dashboards are a smaller step.