
A delivery delay shows up cleanly in a dashboard. Orders shipped late in February and March, the bar chart dips, and anyone looking at it can see the shape of the problem. What the dashboard cannot tell you is that the dip happened because the logistics network was reconfigured that quarter under an internal project, and that the team already knows this because somebody wrote it down in an incident report.
Ask an AI agent connected only to that dashboard why deliveries slipped, and it will answer confidently and generically. It will reach for seasonality. It will reach for weather. If the months fall in the right year it will reach for the pandemic. Every one of those answers is plausible; none of them is yours, and a senior stakeholder reading them will quietly stop trusting the agent.
This is the gap Tableau Knowledge is built to close. It is a capability that assembles your Tableau Cloud assets, their metadata and semantics, and your unstructured business documents into a single graph that AI agents can reason over. We built one end to end against a public e-commerce dataset to see what it actually takes, and this is what we found. If you are earlier in the journey and still working out why agents give shallow answers in the first place, our write-up on why AI agents fail without unified enterprise data covers the architectural side of the same problem.
What Is a Tableau Knowledge Graph?
A Tableau Knowledge graph is a connected map of your analytics estate plus the business context around it. It links the things Tableau already knows about, such as published data sources, workbooks, tables, fields and calculated fields, to the things Tableau has never had access to, such as PDFs, text files, internal memos, policy documents and glossaries.
Tableau infers much of the structure automatically from what is already in Tableau Cloud, which is why the feature is often described as an auto knowledge graph. You are not hand-modelling an ontology. You point it at a data source and a workbook, it reads the relationships, and you then spend your effort on the part that cannot be inferred, which is the meaning.
The three kinds of node in a working graph
- The data source, which expands into tables, fields, and calculated fields, each carrying whatever descriptions you have written.
- The workbook, which carries the visuals built on that data source.
- Business preferences, which is where unstructured files live: operational incidents, policy changes, and root cause context.
The edges between nodes are as important as the nodes. Clicking the connector between two tables shows the columns they are joined on, which means the graph doubles as readable documentation of a model that normally only exists inside a data source. If you have already invested in modelling your sources well, for example with composable data sources in Tableau, that work carries straight into the graph.
Why Field Descriptions Do More Work Than You Expect
The first real task in our build was not graph construction. It was writing a description for every column in every table across a seven-table dataset. That sounds like documentation hygiene, and it is, but in this context it is load-bearing.
An agent choosing between two similarly named columns has nothing to go on but the name unless you tell it more. A description is the instruction that tells the agent what a field holds, which of several near-duplicates to use, and what it means in your business rather than in general. Skip this and the graph will be structurally correct and semantically empty, and the agent will guess at exactly the moment you need it to be precise.
Practically, this means the sequence is: build the relationships between your tables, write the descriptions, and only then publish the data source to Tableau Cloud. Publishing first and describing later works, but you will be editing in a slower place.
How to Create a Tableau Knowledge Graph, Step by Step
1. Prepare and publish the data source
Build the relationships between your tables in Tableau, write descriptions for the fields and calculated fields, then publish the data source to Tableau Cloud. The graph connects to published assets, so nothing happens until this step is complete.
2. Create the graph and connect your assets
In the Tableau Knowledge interface, create a new knowledge graph. You are prompted to select the workbook and the published data source you want it built from. Selecting both and continuing is what gives the graph its structural backbone. Once the graph is created, mark it as the Default graph. Agents query the default graph unless you name a specific one in the request, so skipping this step can leave an agent reasoning over a different graph than the one you just built.
3. Add the business context as unstructured files
This is the step that separates a knowledge graph from a data catalogue. Upload the documents that explain your business to itself: incident reports, policy change notes, root cause write-ups. We uploaded a logistics incident document describing an internal project and the delivery delays it caused in specific months. That single file is the difference between an agent guessing at seasonality and an agent naming the actual cause.
4. Explore the graph and check what it inferred
Open the data source node to see its tables and calculated fields, drill into a table to inspect field metadata, and use the relationships view to confirm the joins are what you expect. This is your chance to catch a model that reads differently to a machine than it does to you.
5. Evaluate the health score and act on the recommendations
Tableau Knowledge includes Tableau Agent, a chat interface where you can ask it to evaluate your own graph. Ours came back at 73 out of 100, across 86 nodes, one data source and one workbook, with context coverage at 67%. Alongside the score it returns recommended actions, which is effectively a prioritised backlog for closing your own context gaps.
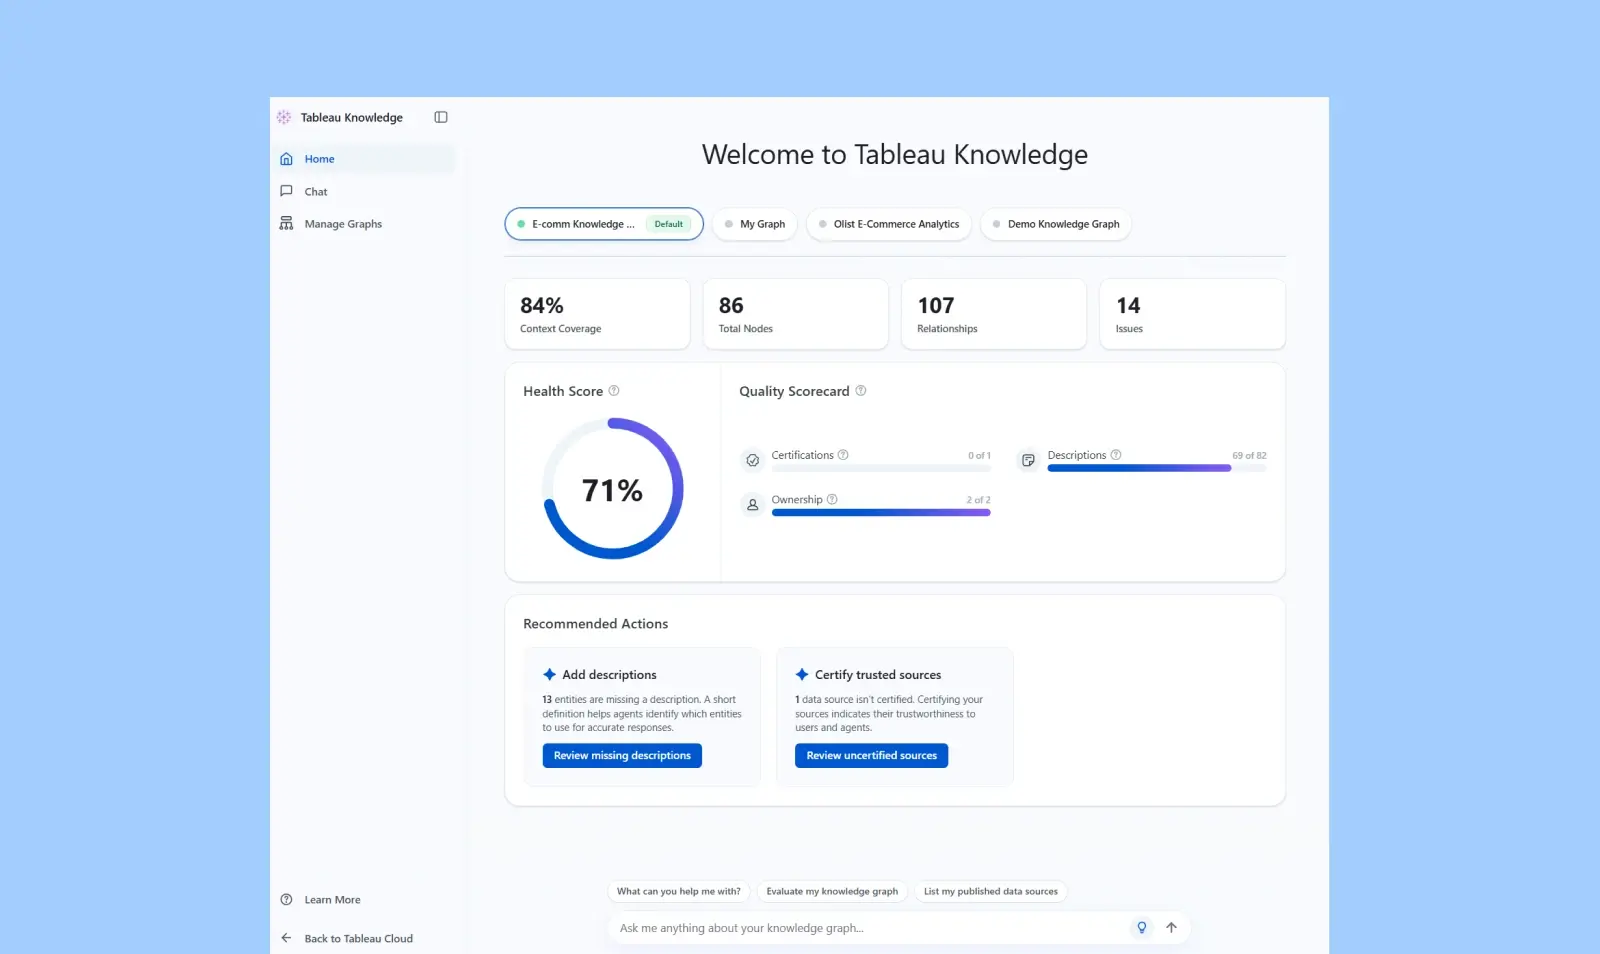
The health score is worth dwelling on, because it reframes the work. Context coverage is not a vanity metric. It is a direct measure of how often your agent will have to improvise. Treating it the way you would treat a data quality score, with an owner and a target, is the difference between a graph that improves and one that is built once and quietly decays. The same discipline applies to grounding conversational answers generally, which we covered in Tableau Pulse best practices for accurate AI answers.
Connecting the Graph to an AI Agent with Tableau MCP
A knowledge graph on its own is a well-organised reference. It becomes useful when an agent can query it in natural language.
We connected ours to Claude using Tableau MCP, which exposes the graph and its underlying data source so an external agent can read them and answer against them. With that in place, the question we had started with- why deliveries were delayed in those two specific months- returned the actual internal cause from the uploaded incident document rather than a generic hypothesis.
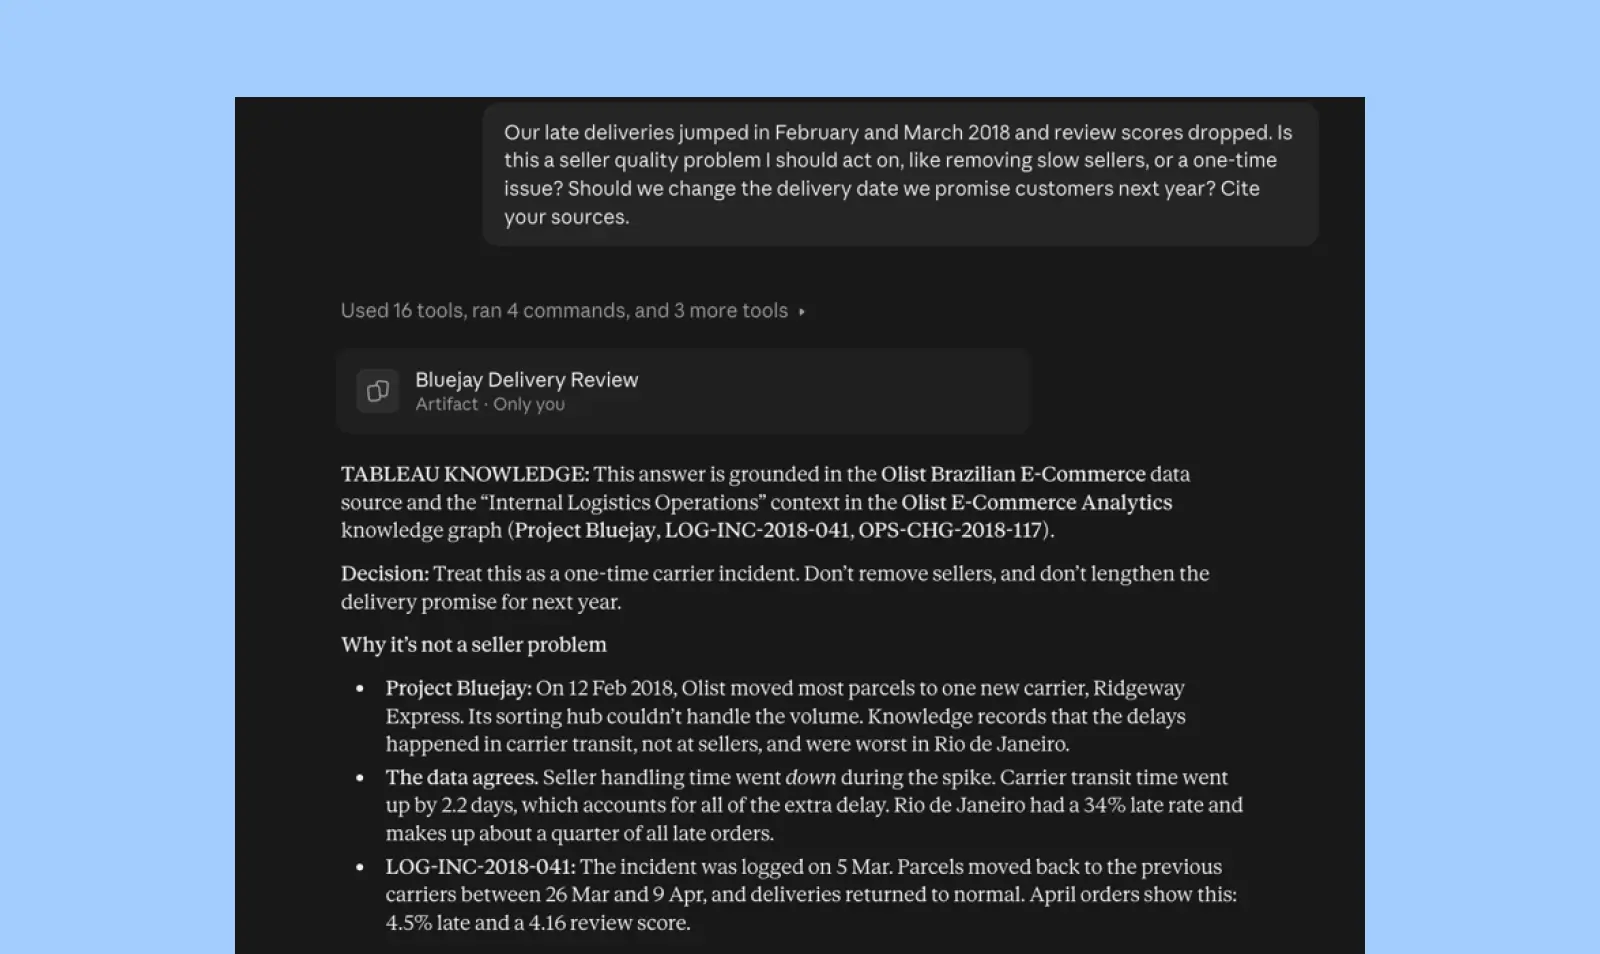
From the same request, Claude also turned the findings into a two-page HTML report as an artifact. We have written separately and in detail about what the MCP layer does and does not solve in Tableau MCP: what easy setup still leaves you to solve, including permissions inheritance and the eligibility constraints, so this piece will not repeat it.
The short version of the division of labour is worth stating plainly. MCP is the transport. The knowledge graph is the comprehension. Connecting an agent over MCP to a data source with no descriptions and no business context gives you a faster route to a shallow answer, not a better answer.
Three things we had to get right in the MCP setup:
- Knowledge tools are off by default: At the time of writing, Tableau MCP’s Knowledge tools sit behind a feature flag that is off by default, so we switched them on in a local install of Tableau MCP.
- Read and write carry different risk: The query and inspect tools are read-only, but the manage tool can write changes back to the graph. Keep it set to “needs approval” so an agent cannot edit your graph unattended.
- Tell the agent to use Knowledge first: We instructed Claude to check Tableau Knowledge before querying data. Without that instruction, an agent may answer from the numbers alone and skip the context you built.
What Changes When Business Context Is in the Graph
Answers cite your business, not the internet
The most visible change is the disappearance of plausible-sounding generic reasoning. An agent with access to your incident log explains an anomaly using your incident log. The answer becomes checkable, which is what makes it usable in a meeting.
Knowledge that lived in people becomes queryable
Operational context usually lives in three places: documents nobody reads, systems nobody connects, and the heads of the three people who were there. The first two are addressable, and a graph is how you address them. This also reduces how much institutional memory walks out of the door when somebody leaves.
The gaps become visible and rankable
A graph with a health score tells you where the context is thin before a stakeholder discovers it in an answer. That is a meaningfully different posture from finding out after the fact.
Where this leads is agent-assisted analytics that stakeholders are willing to rely on. We have seen the same pattern in conversational analytics engagements, including our work on conversational analytics with Tableau Concierge and on AI-powered real estate analytics on Tableau Next, where the quality of the answer tracked the quality of the context far more than the sophistication of the model.
What to Know Before You Start
Check three prerequisites before you build anything:
- License: Tableau says Tableau Knowledge is available now in the Tableau Cloud+ and Tableau+ editions, and coming soon to Tableau Server and Tableau Next.
- Site setting: A site admin has to turn it on in Settings, under AI in Tableau, which needs a connected Salesforce org.
- Roles: Creating graphs needs a Creator role, while querying a graph works with a Viewer or Explorer role.
Beyond access, Tableau Knowledge is new, and this account comes from a build on a public dataset rather than from a production rollout, so a few things are worth flagging honestly.
- The graph depends on published Tableau Cloud assets, so your Cloud estate is the ceiling on what it can see.
- Descriptions are manual effort and they scale with your field count, which is the real cost of entry on a wide model.
- A health score of 73 on a single data source and one workbook suggests the metric is demanding, and that a large estate will need sustained attention rather than a one-off pass.
- Unstructured context is only as current as the documents you upload, so an unowned graph will drift out of date quietly.
Where to Start
Pick one subject area where somebody regularly asks why rather than what. Model and describe that data source properly, publish it, build a graph against it with the two or three documents that actually explain that area, and check the health score. You will learn more from one well-described domain than from a wide graph with empty descriptions. If you want help deciding which domain earns it first, our Tableau consulting services and AI agent development services teams do exactly this scoping work.
Frequently Asked Questions
1. What is a Tableau Knowledge graph?
A Tableau Knowledge graph is a connected map that joins your Tableau Cloud assets, such as published data sources, workbooks, tables, fields, and calculated fields, to unstructured business documents like incident reports and policy notes. It gives AI agents both the structure of your data and the context needed to interpret it, so answers reflect your business rather than general patterns.
2. What Tableau editions include Tableau Knowledge?
At the time of writing, Tableau says Tableau Knowledge is available in the Tableau Cloud+ and Tableau+ editions, with Tableau Server and Tableau Next listed as coming soon. A site admin also has to enable it under Settings, AI in Tableau, which requires a connected Salesforce org. Building a graph needs a Creator role, while Viewer and Explorer users can query it.
3. What does the Tableau Knowledge health score measure?
It’s a score out of 100 that Tableau Agent reports for your graph, alongside measures like context coverage and recommended actions. Our single data source and workbook build scored 73, with context coverage at 67%. The recommended actions tell you which gaps to close first.
4. Do I need Tableau MCP to use a knowledge graph?
No. Tableau Knowledge includes Tableau Agent, its own chat interface for asking questions of the graph directly. Tableau MCP matters when you want an external agent to reach the graph, which is how we connected ours.
5. What kind of documents should go into the graph?
Anything that explains an anomaly your data cannot explain on its own. Operational incident reports, policy change notes, root cause analyses, internal project summaries and business glossaries are the highest value starting set, because they carry the reasoning that never makes it into a table.